Consumer Debt in Systemic Context
We do a deep dive into the moving parts of consumer systemic debt across mortgages, autos, credit cards and the ugly topic of student debt.
We hold up consumer debt to some macro prisms including GDP and household income using the most recent Z.1 report.
As much chatter as there has been around strained household balance sheets, the top down metrics are saying the consumer debt and residential mortgage totals are not a problem relative to past cycles and even look downright mild.
Demographics and the propensity to borrow/spend drives the size of the total consumer debt line and the residential mortgage balance, but underwriting quality and lender easing/tightening of credit standards are what moves the needle on mix and household credit risk.
Consumer debt is at record highs in nominal dollar terms alongside myriad other records (nominal GDP, nonfarm payrolls, income levels, etc.), and that mitigates the comparative household credit risk and calls into question the bear scenarios on consumer credit.
In this commentary, we do a chart-heavy drill on systemic consumer debt to give some historical context. The economic cycles of expansion/contraction and parallel consumer credit cycles overlap while often marching to a very different beat. Reckless lending is not the same as loose lending and tight lending is more about subtle trends than credit lockdowns. Then again, we have seen the extremes surface at times on both sides across the cycles.
The consumer debt quality backdrop is subject to how lenders and households alike operate in various markets. From our vantage point, we don’t see the macro level metrics for consumer debt as excessive or alarming in the context of household earnings (household disposable income) or in terms of asset protection afforded lenders (e.g., home equity under mortgages, used cars).
While it is a bigger project looking across lenders, we don’t see a wave of reckless consumer lending. There are always pockets of risky lenders (20% area subprime lenders on used cars at 100% LTVs, etc.) that play in that end of the market, but we see little resemblance to past cycles of excess.
The chart above plots the combined tallies of residential mortgages + consumer credit categories as a % GDP. At a 66% handle vs. GDP, we are in a very reasonable spot in historical context. We break out the totals in the bar chart, and 1Q23 is slightly below the 4Q22 record.
We add more granularity to the main categories of consumer credit (student debt, auto loans, credit cards) further below in the note. The concept comes first, and consumer credit totals are about the quality of the underwriting and ability of households to weather varying degrees of broad economic contraction. Just saying “record highs” lacks a measuring stick. The quality of the debt and relative default risk at the household level is the main event even if the sheer scale of the consumer debt increase is an eye-opener across time. The totals are supposed to be higher in a growing economy with rising incomes.
Household balance sheets and debt service risk…
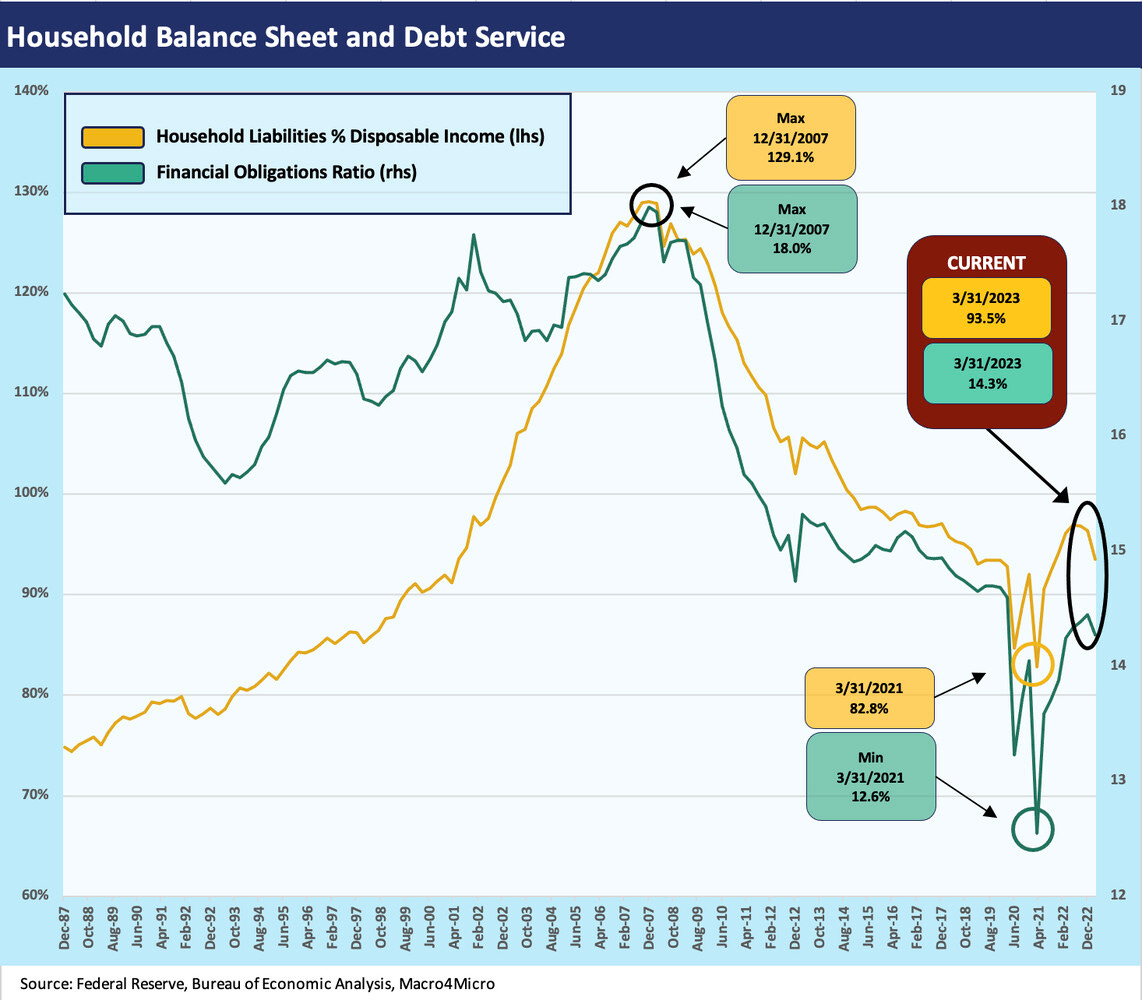
Below we frame the debt/liability levels and debt service demands. We frame the balance sheet against household income for better context. We use a two-sided chart and plot some ratios that frame how risky the household financial profiles are in aggregate. There are always outliers, but this provides a reasonable systemic snapshot.
Household liabilities % Income is one household version of Debt/EBITDA, and the current levels are well below where we saw the markets ahead of the credit crisis. We also use the well-traveled Financial Obligations Ratio (Household financial obligations as a % disposable income) from the Fed. This is somewhat of a household variation of fixed charge coverage that includes lease payments, mortgage payments, and a broader range of obligations. Both have climbed off the recent lows but are well below some of the more financially aggressive cycles on the timeline.
Much of the commentary in 2023 focuses on how households have run down their excess cash and drawn on their lines to sustain a high rate of spending. The theory is that the liberal use of savings and credit is a major factor behind why the personal consumption expenditure lines in GDP have hung in well into 2023. The idea of slowing growth is that the PCE line will fade from here despite the high payrolls.
For this exercise, we are looking more at the consumer debt lines vs. GDP and then we frame them vs. household earnings using the most recent Z.1 report (filed in June). What we find is not all that worrisome from a systemic standpoint even though credit quality always deteriorates as cycles wear on and employment and growth inevitably fade and the economy contracts.
Every cycle has had some variation of excess such as credit cards in the 1980s/1990s (mailbox counts became a metric with so many stuffed with credit card applications), subprime autos in the late 1990s/early 2000s, and then the mother of all residential mortgage binges in the post-TMT crisis period when Greenspan engaged in a radical easing process years into the recovery including 1% fed funds into 2004 (see Greenspan’s Last Hurrah: His Wild Finish Before the Crisis 10-30-22). We don’t have to revisit how that one ended.
Pandemic mortgage refinancing helped today’s household monthly payments…
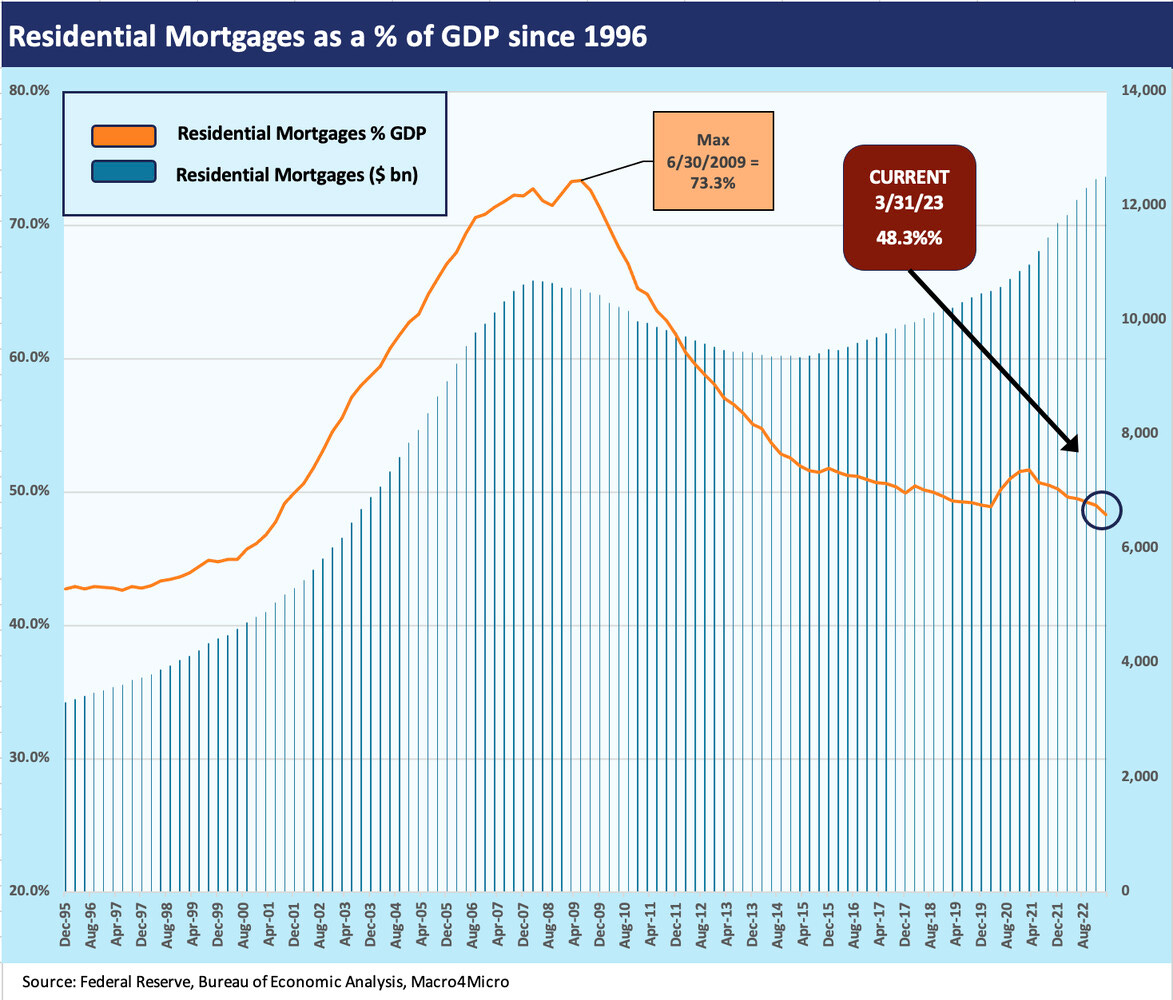
The relative systemic exposure of residential mortgage debt is captured in the chart above. The pattern of total debt offers a reminder that the term “record debt” is not always that meaningful when nominal GDP, the population, nominal income, and the number of households all keep growing. If you are a bear and axed, you simply shout “record consumer borrowing” at the top of your lungs and tell stories of a burning fuse. The “records” come with other relevant variables such as payroll counts, total income trends, the relative credit quality of the borrowing base, and asset protection (e.g., home equity, loan to value on vehicles in the loan mix, etc.).
Looking back at the chart above, the time series line in the chart shows residential mortgages since the start of 1996 on through 1Q23. We plot total amounts in the bar chart as it moves to record totals of $12.5 trillion at the end of 1Q23. As a frame of reference, the residential mortgage market crossed the $10 trillion milestone in 1Q07 on the way to a 1Q08 peak. That 1Q08 peak was the month that Bear Stearns collapsed (not a coincidence). It was also after Countrywide was rescued by BofA.
With GDP contracting during the crisis, Residential Mortgages climbed to over 73% of GDP vs. just over 48% at 1Q23. That 48.3% is the lowest since 2001, which was a year of a very mild economic contraction.
Fiscal and monetary action prevented another crisis in consumer credit…
The pandemic raised fears of mass defaults on mortgages as well as all forms of consumer credit, but the cyclical recovery came on very quickly in sharp contrast to the credit crisis and job destruction that also saw lasting, tight lender credit conditions even with the Fed at ZIRP and in QE mode.
Given the tone in Washington, we expect that Powell or Mnuchin will not get credit for leading a masterful plan on circumventing a massive disaster during the pandemic. The GOP and Democrats smack Powell as a routine, and the Democrats have outlawed giving Mnuchin any credit for anything. Those two leaders designed policies that stepped in front of a potential contagion of risk aversion. Household refinancing benefitted as did corporate sector refi and extension.
During COVID, mortgage relief was provided by Washington, and the combined action of the Fed and fiscal relief and stimulus mitigated household debt risk and got jobs soaring. There was plenty of pain, but the macro backdrop did not suffer the way the post-crisis market did in 2009-2011. Jobs continue to rise sharply in 2021-2023 to the point where labor shortages brought pricing power to the lower income brackets. Refinancing and extension of mortgages during COVID in fact brought material relief to households today as 30Y mortgage rates plunged to a low around 2.6%.
Growth in residential mortgages will be getting a systemic side-eye until the end of days after the experience of the housing bubble, but the longer-term timeline above frames how bizarrely out of line residential mortgages dislocated from the long-term trend line from 1970 to 2023.
The visual of the spike in systemic mortgage exposure is compelling on multiple counts including wondering if elected policy makers were too busy fund raising and state leaders enjoying the taxable revenue stream while it lasted.
That spike in the mid-2000s was turbocharged by leverage on assets pumped up by questionable, exaggerated appraisals (home prices) and multiplied in scale by leveraged derivatives and securitization excess. The process was exacerbated by reckless underwriting standards and inputs that were rife with borrower fraud (“liar loans”) and fee generation fixation (ratings, underwriting). The underwriting came with flawed ratings criteria in securitization and an extreme form of caveat emptor by packagers (“not my job”). That all made for a bad day at many offices for many months (i.e., longest downturn since the Great Depression).
In the post-crisis market, mortgage underwriting standards are higher, due diligence practices at least exist, and the regulatory and legal checks on representations are more threatening. Housing prices are tied to supply and demand and not easy credit. The rating agencies are at least somewhat more measured after all the pain they went through in Washington.
The pandemic and Fed response created a backdrop in 2020-2021 where many households locked in record low mortgage rates. Refinancing eased a lot of household cash flow worries and is a mitigating factor when it comes to other household debt.
Those in financial trouble today could find ready buyers to monetize their growing home equity values. As we plot in the chart below, home equity as a % of real estate value is back to levels not seen in decades. The low mortgage rates make it harder to sell an existing home now on mortgage refinancing hurdles, but that beats the alternatives with a high base of home equity.
The above timeline of relative asset protection in the housing base could go under the heading of “you don’t see this every decade” even if it has more than a few asterisks you can attach to such macro level data rolled up in this manner.
The math from the Z.1 report is “owners’ equity % total real estate value.” It is a trend line that begs an explanation, and the easy read is the “base of positive home equity in the system is high relative to mortgage debt.” Each individual household story will have its own set of circumstances, but there is a lot of housing value out there in the market set against the mortgage rates transacted before the UST spike of later 2022.
The golden handcuff theme covers how low mortgage rates on a currently owned home impairs building existing home sales inventory. That is a very real problem for homebuyers, but it also serves to keep home equity high. We cover that in our housing sector commentary. That said, you can always sell and rent for a while. The existing home seller can also sell, incur a higher mortgage on the next move, and then refi later. Those situations are always household-specific and subject to a personal checklist of priorities (e.g., school systems, school years, job change, relocation, retirement, etc.).
Consumer debt (ex-mortgage) stays in a tight range…
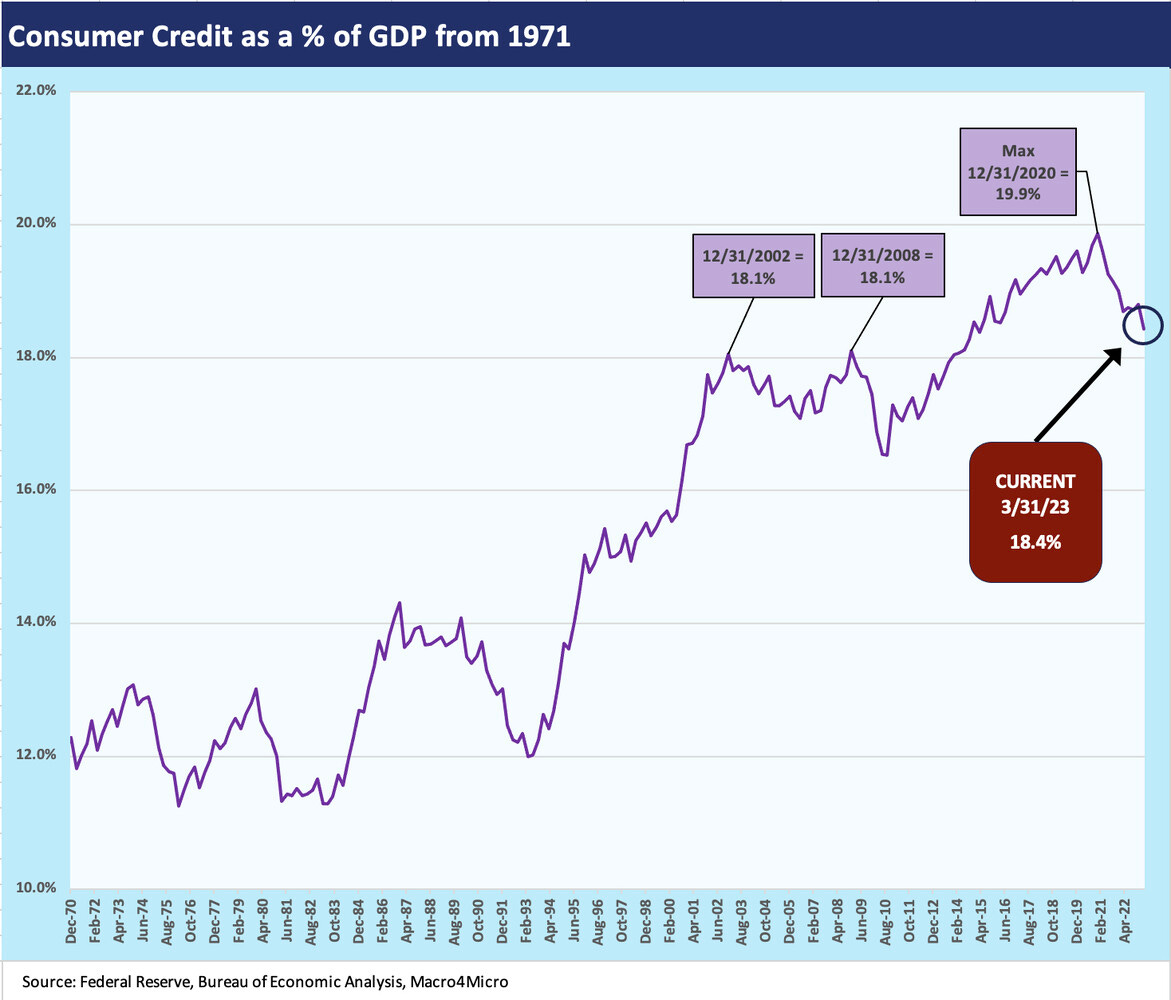
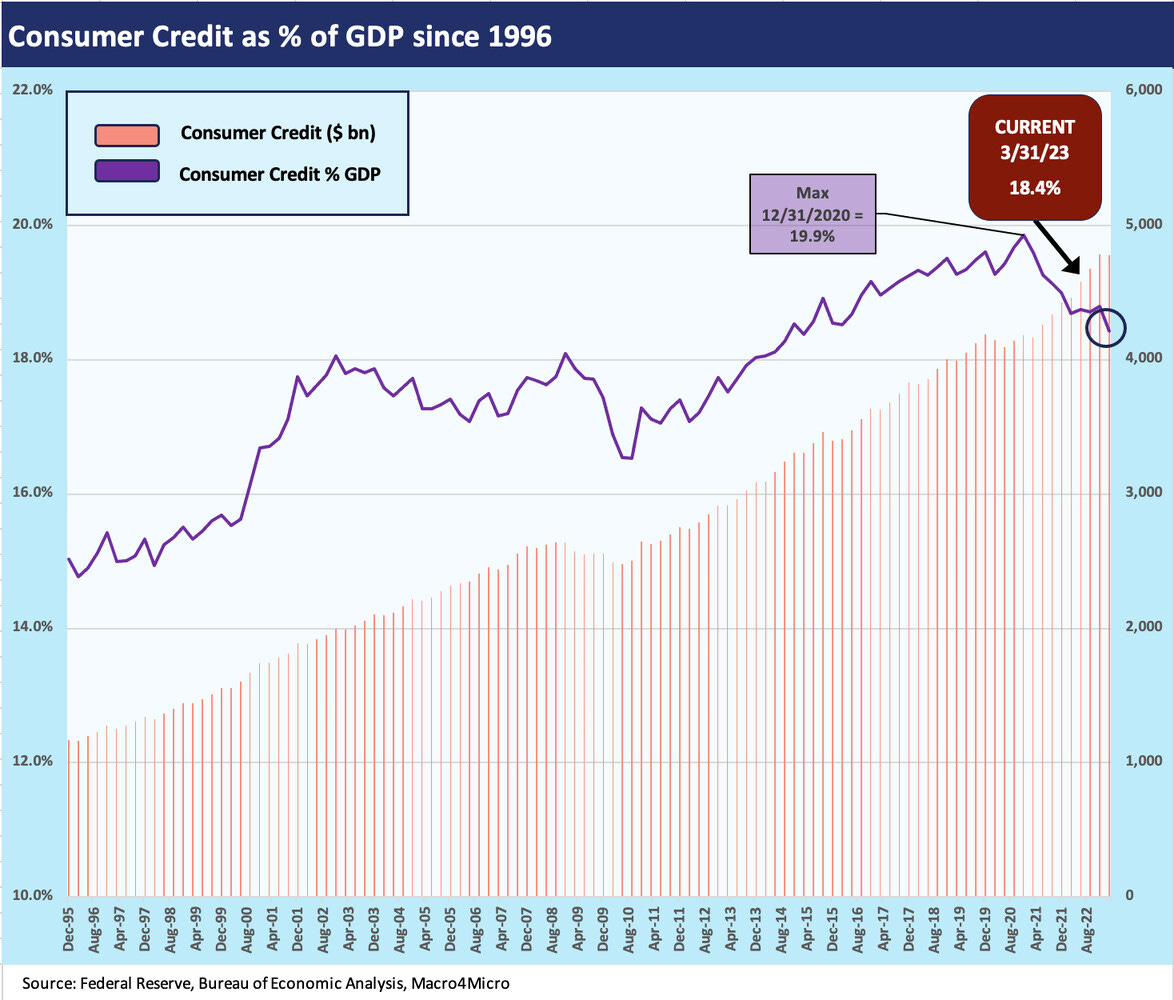
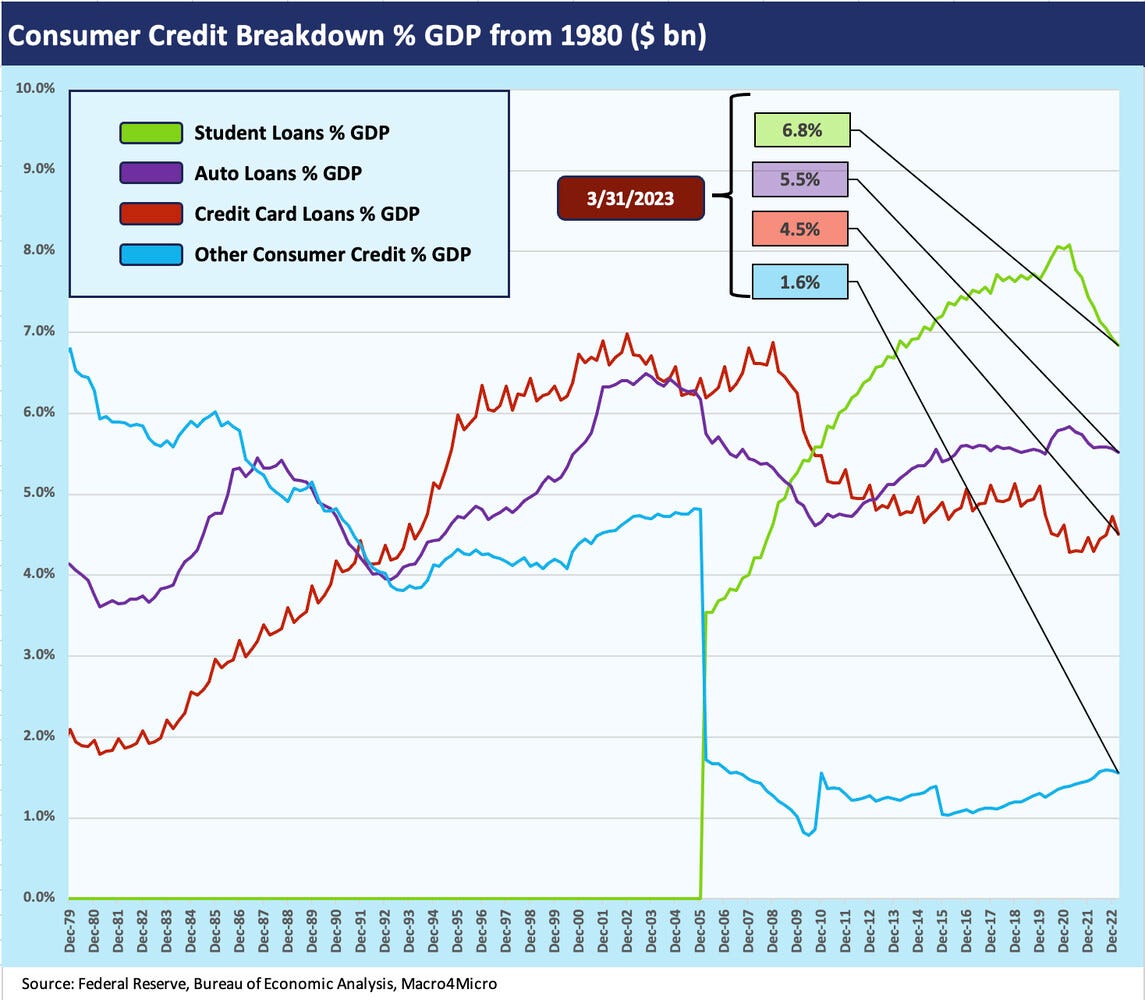
Before we break out the “Consumer Credit” category into pieces, the above chart plots the timeline of total Consumer Credit categories vs. GDP. While Credit Cards became a major factor in the 1980s and 1990s, Auto Loans took the lead vs. cards in mid-2013 and have held that lead since that time. Student loans climbed with a vengeance in the new millennium.
As we review further below, Student Debt did not even have its own category until 1Q06 at 3.5% of GDP and $481 billion vs. the $1.77 trillion balance and 6.8% of GDP in 1Q23. Student Debt climbed over 3.6 fold since 2006 through 1Q23 while Auto Loans climbed 1.5x and Credit Cards 1.7x.
The explosive growth of consumer credit in the bull market 1990s was driven by various factors beyond the strong economy and bullish stock markets. The extreme easing by Greenspan in 1991 after the late 1980s credit implosion and financial system turmoil made the credit card business very lucrative (see Greenspan’s First Cyclical Ride: 1987-1992 10-24-22 ).
High interest margins in such products relative to potential loss exposure brought a flood of entrants and credit card programs. Some were good at it, and some were not. From 4Q 1990 to 4Q 2000, credit card totals pulled well ahead of auto loans although both grew quickly. Auto Loans doubled and Credit Card balances almost tripled.
In the early 1990s, aggressive fed funds easing, industry consolidation, and growth of consumer lending businesses helped some institutions weather a lot of the post 1980s credit cycle fallout in real estate, energy, and corporate lending. Funding costs were low and consumer rates were high. Smaller banks grew rapidly with a focus on the consumer and middle market businesses as the post-deregulation, post-Glass Steagall years saw major banks move rapidly into capital markets business lines and expand securitization businesses.
The capital market and underwriting operations needed the consumer loans to fuel those business lines, and the assembly line was constructed for rising consumer loan origination. Prime quality receivables in autos and cards were commoditized and the subprime consumer lending and mortgages started to take hold in the late 1990s. Those operations struggled, but the underwriters did not learn the hard way back then.
Getting into the consumer credit weeds…
In the next series of charts, we plot the histories of the major categories of consumer credit. We frame the categories in dollar terms and as a % of GDP. As noted above, the 18% to 19% range for Total Consumer Credit the past two decades held within a range, and the analysis comes down to looking at the mix of quality across the products and which balance sheets they end up on or in what structure. We saw a blip in the debt % GDP ratio in 2020 when the denominator (GDP) was slammed during COVID, but the story across the years was more about quality mix than systemic totals.
The Consumer Credit assets generated range from pristine AAA-type exposures down to higher risk near prime, subprime, and deep subprime. The most reckless structures had their defining/redefining moments in the credit crisis. Watching the bank and finance companies and tracking the durables goods lenders is part of the portfolio monitoring and risk management routine. The ability to fund via nonrecourse structures drove growth in all these categories. The securitization business is also walking more upright now than in the 2004-2007 time frame, when there was more slithering than walking.
The post-pandemic cycle has seen rapid growth in consumer credit with new car supply not able to keep up with demand, but credit was more than adequate to pay the rising average transaction prices on new cars when inventory was available. Of the major categories, Auto Loans rose the fastest from 4Q19 to 1Q23.
The pandemic rolled in during March 2020 and Goods were the hottest purchases and cars very much in demand along with houses in the flight from crowds and work-at-home trends. Used cars and new auto financing was very much in demand, and auto loans kept on growing along with the population of driving age and the number of workers on the payroll. We see growth in all the categories.
As the charts in this commentary hammer home, the dominant balance sheet item in consumer credit (ex-mortgages) right now is Student Debt. To reiterate, that line item did not even have its own category broken out until the middle of the 2000s (2006) and has now soared into the lead ahead of Auto Loans. For its part, Auto Loans had a battle with credit cards for the lead in recent decades but pulled away just over a decade ago and widened its lead over credit cards. The rising prices of new cars is no small part of that trend.
As with Residential Mortgages, the Credit Card and Auto Loan categories are easier to grasp as a systemic risk than the Student Loan bucket. Too much reckless underwriting in mortgages, auto loans, and credit cards lead to charge-offs on the books of banks and finance companies or problems in securitized products. We have had such asset quality bouts over the cycles, but the practices are much improved in the wake of the credit crisis. Goods and services get purchased and the wheels of the economic cycles go round and round. We see auto loans and credit cards as in a reasonable range in context of these past cycles.
Student loans as a growth albatross…
Student loans are a trickier proposition given their scale and given the questions around what the economy gets for those dollars borrowed. What does the economy (and borrower) in fact get for those dollars spent and usually borrowed? We are not going to open up that can of worms here, but the scale of the debt burden is a drag on the ability of those borrowers to invest and spend as they are more strained with student debt payments.
Those stretched balance sheets influence many industries from used cars (growing preference for late model used over new for the student loan encumbered) and residential real estate (growth in rentals vs. ownership for the same stretched balance sheets) and migration patterns (affordable states with lower taxes). There is a lot to unpack for an entry level employee with onerous debt service payments for past education vs. current purchases.
The student debt relief battles unfolding in Washington now is in part about equity (“Why do they get a break from the taxpayer?”) but also in part about fiscal stimulus by freeing up balance sheets of those borrowers for other spending. That is the inflationary theme or the economic growth pitch depending on which side you pick. The opponents of the attempted relief can argue on multiple fronts – equity and inflation. That is a tough combination for loan relief supporters to counter in an inflationary market.
The supporters of student debt relief also had the problem of the Constitution with the House in Congress holding the purse strings. Even if we assume many of the current House members skipped class in college (or simply forgot what they learned), they control the budget process. Somehow the White House missed the boat on the Constitution thing. They should have passed it when they had the chance if they wanted to de-risk the legislation from legal challenges. That was a whiff.
Of course, some of the biggest opponents of student debt relief are also against minimum wage reform, more affordable public college education, investments in more education from pre-school to high school, and workforce retraining that requires spending in actual dollars (as opposed to speeches and cheap talk).
Over time, these educational debt issues become growth issues as the 2% handle annual GDP growth posted under Obama and Trump are perhaps signaling (see 1Q23 GDP: Facts Matter 6-29-23). Let the election debates begin…


