
Footnotes & Flashbacks: Asset Returns 1-14-24
We look at a stronger Week #2 for January returns that hitched a ride on a tech rebound and a sharp front end UST rally.


The PPI weakness vs. expectation undid some anxiety from a CPI release that was not supportive of the early-and-often-easing school with the 2Y to 30Y now back to “flattish” on the 2Y UST rally.
Corporate bonds and HY bonds were boosted along with other fixed income returns on the UST move while spread contraction was also back in bloom.
Earnings season has started as a mixed bag with an industry-by-industry grind ahead with a stack of financial names releasing this week across major banks, regionals, and consumer lending leaders.
The political environment (“SEAL Team 6 on Line 2, Sir”) starts the year with even more bizarre headlines, China was tweaked by the Taiwan election outcomes, the Houthi retaliation action ups the ante on Gulf traffic and for energy scenario spinning, and a big chunk of the US Congress is still rooting for Putin (and by transitive property their Iranian and North Korean weapons suppliers) as Ronald Reagan spins in his grave.
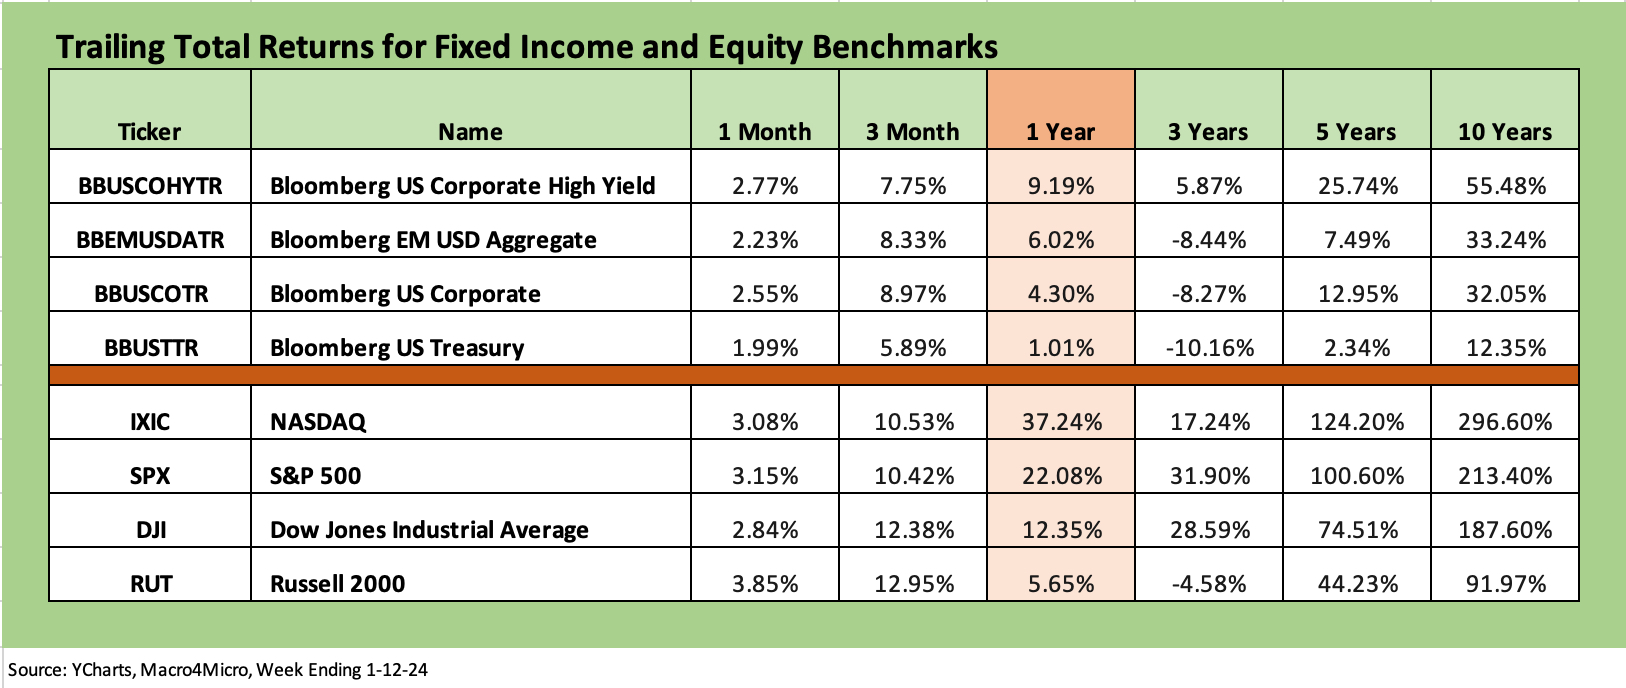
The above chart keeps the 1-month columns positive for the main debt and equity benchmarks we watch each week as Tech rebounded to offset the Week 1 damage with small caps still off to a slow start. As we cover in our separate “Footnotes” publication on the state of the yield curve, fixed income had a good week despite a CPI reading that did not point at early easing (see Dec 2023 CPI: Big 5 and Add-Ons, the Red Zone Challenge 1-11-24).
The market consensus is bullish on UST projections and looking for more support. The negative PPI did the trick as it came in slightly in the red vs. the expectation of slightly in the black. The total return impact on the UST curve and mixed picture across industry groups (notably in Airlines/Transports, Financials, Energy) delivered solid numbers in credit markets.
It is way too early in the earnings season incoming to get a read, but this coming week will bring a slew of numbers from large banks to regionals to consumer oriented financial operators. These releases should shed some important light on the health of consumer credit and the household state of affairs and regional bank loan books. Regional banks would like to get this year underway in better shape than what happened in 1Q23.
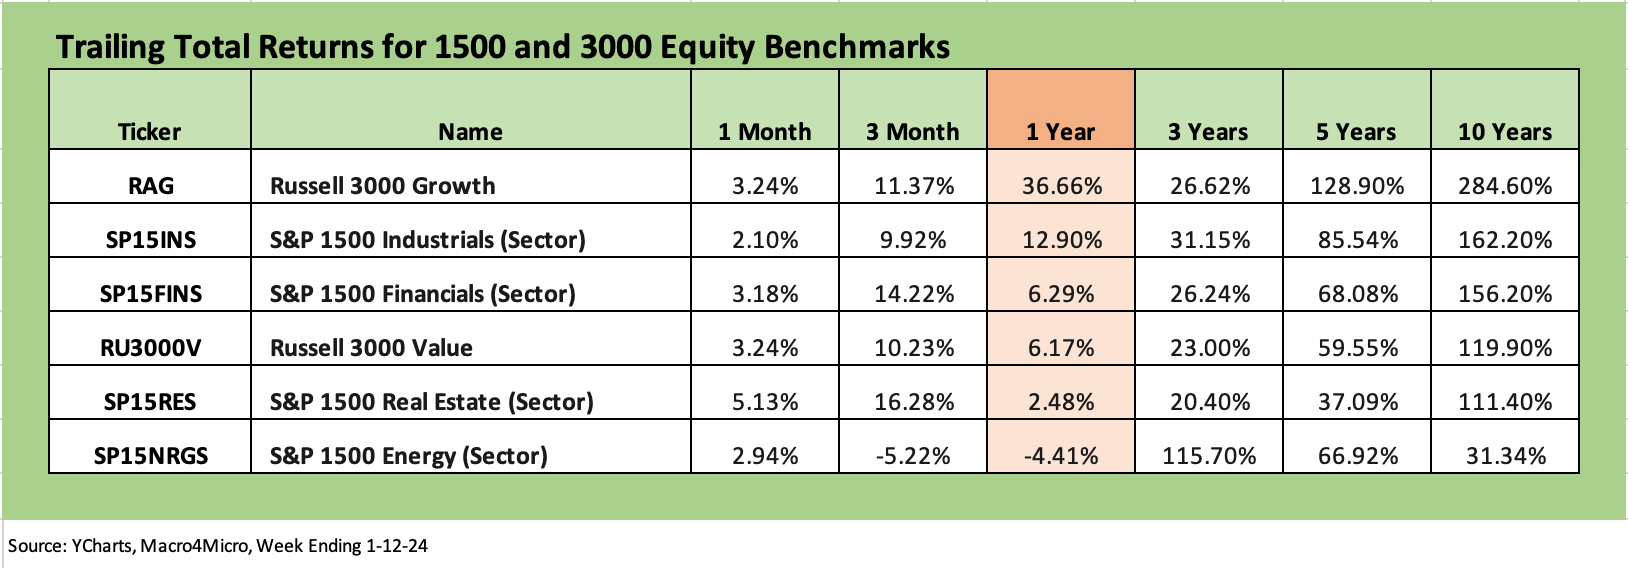
The above chart updates the 1500 and 3000 series, and the week was not as kind to small caps and midcaps as it was to the broad market large caps. We look at more granular level data in our ETF section below, but running the guidance through the outlook blender will take weeks even if the reaction can be immediate at the narrow industry level as we saw with airlines on subdued Delta guidance sending airline stocks plunging.
Energy equities are lagging against a backdrop that would have sent broader markets into a panic in the old days of the 1990s. Since then, a few decades of Mideast wars and a US “shale revolution” and explosion in infrastructure investment has hardened investors to Middle East geopolitical tension. The tepid reaction to escalation (e.g., Houthi strikes) also undermines the panic mongers around US energy “dependence.” This is not even 2003 (Iraq War), let alone 1990 (Desert Storm) or the brutal periods of 1979 (Iran crisis) or 1973 (oil embargo).
Energy will be the hardest call of all with China demand always murky. On the supply side, we have seen confusion since the Russian invasion of Ukraine as record US production dovetails with the wildcard of Russian and Iran supply. OPEC+ is one thing, but the US is in an election year where information and political axes on energy can’t even agree that the US is running at record levels of production and exports.
Meanwhile, Ukraine is getting starved of ammo by Congress at the same time the Strait of Hormuz and Red Sea look like a tinder box. The Israel-Hamas war is always one that could bring in some surprises from Hezbollah and Iran as holder of the strings (and provider of equipment). For now, placing bets on a clear supply-demand picture in oil is for the commodities gamblers. A wide range from mid $60 handles to mid $90 handles appears reasonable. That was last year’s reality and is a reminder of how much it can swing around.
ETF and benchmark time horizon returns…
The chart below allows for an easy way to view the shape of ETF and benchmark returns for each period (1-week, 1-month, 3-months, and now 1-year). We had been using “YTD” in 2023 but are now switching to trailing 1-year as we enter 2024.
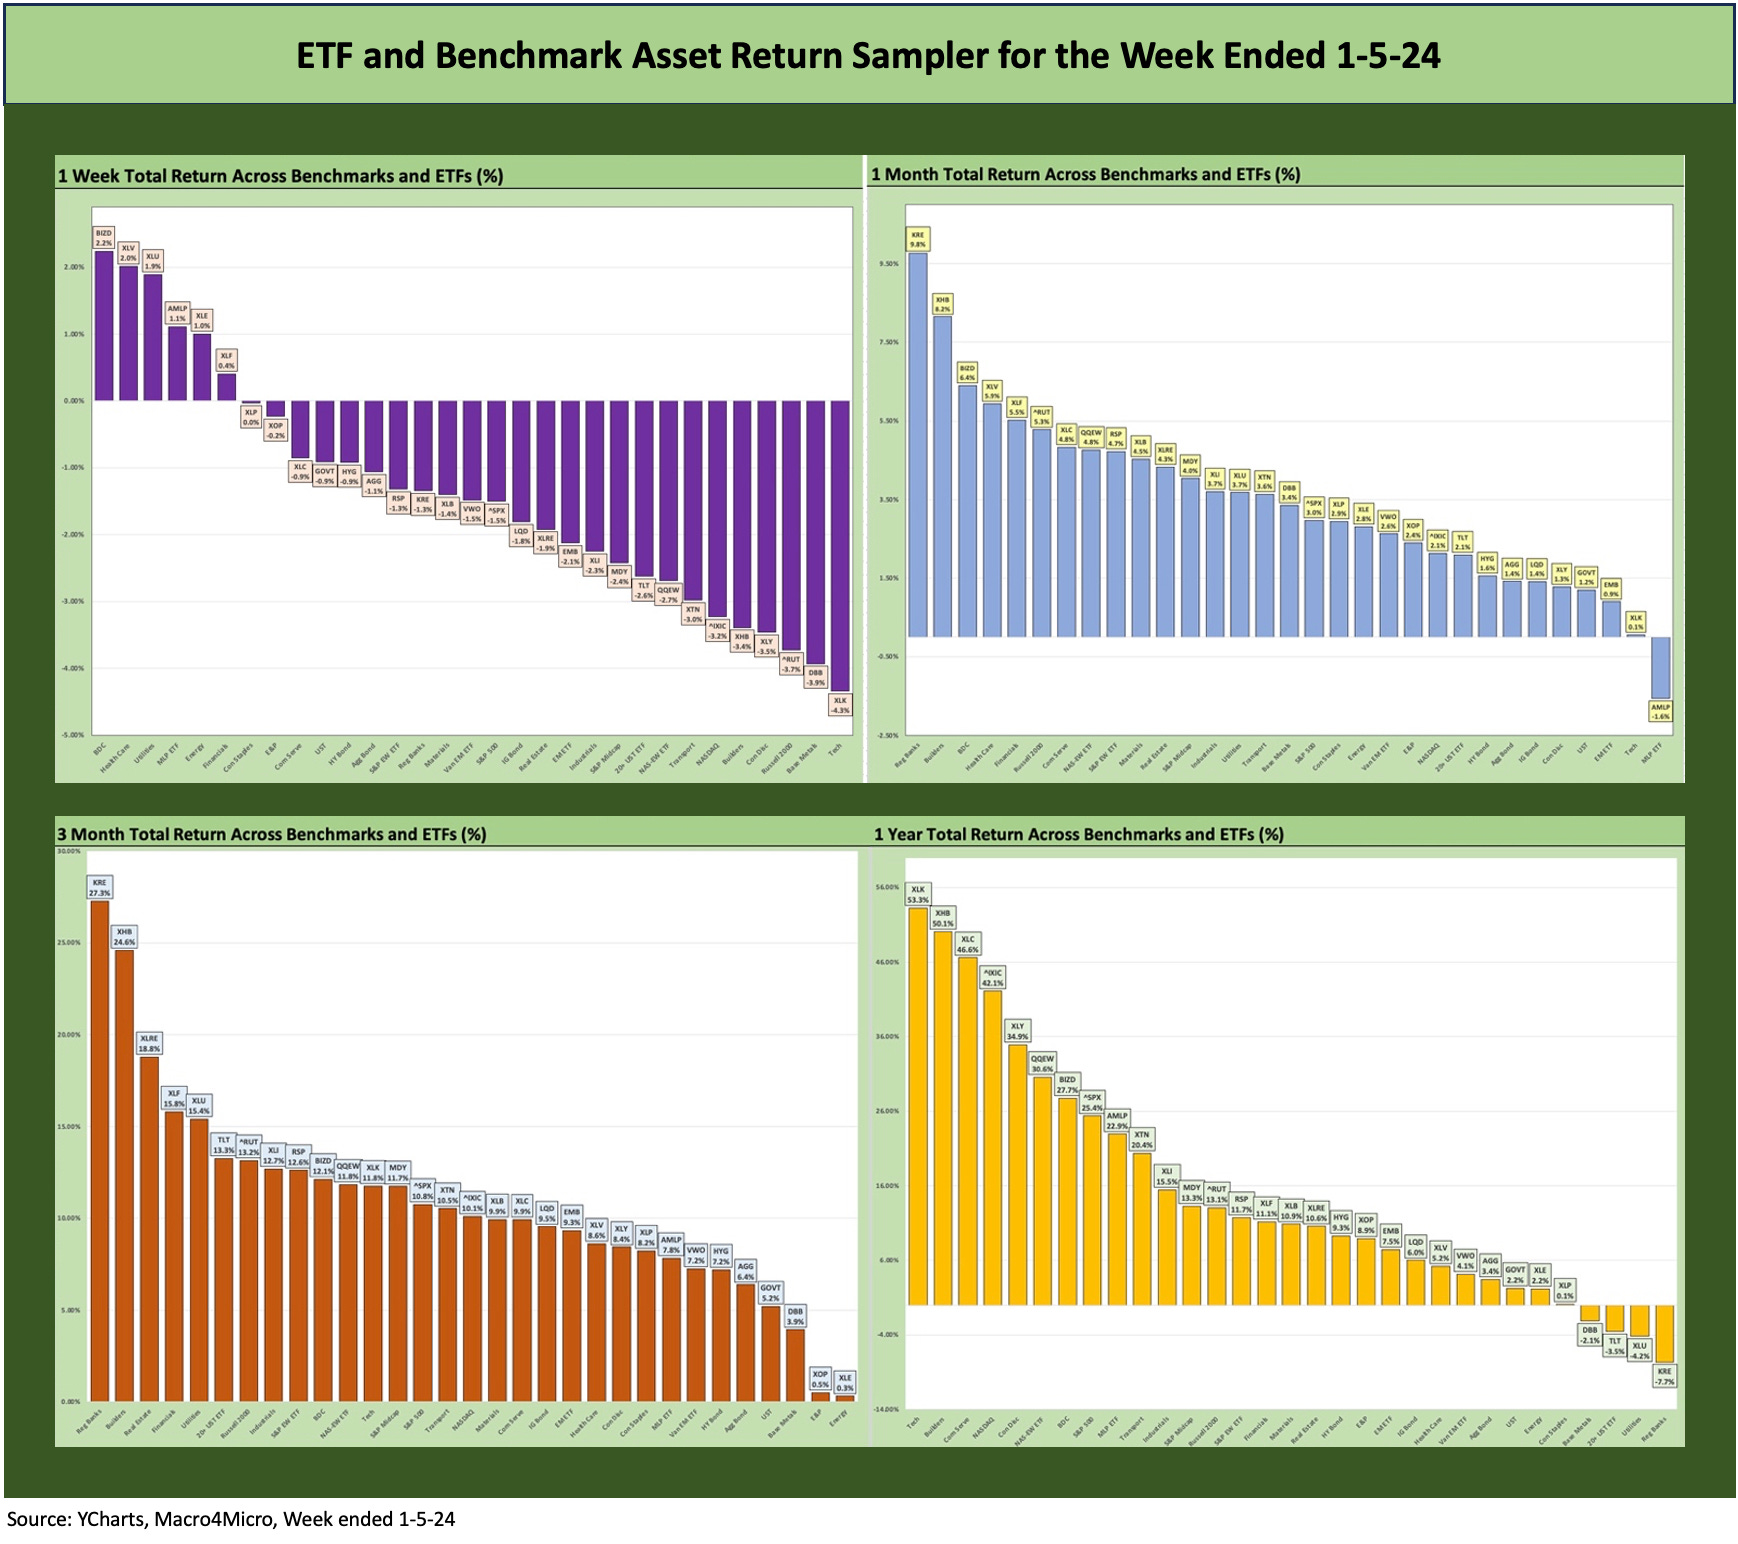
When markets get volatile, the reshaping can flow in quickly. We include the last two weeks separately below since Week #1 was much different than Week #2.
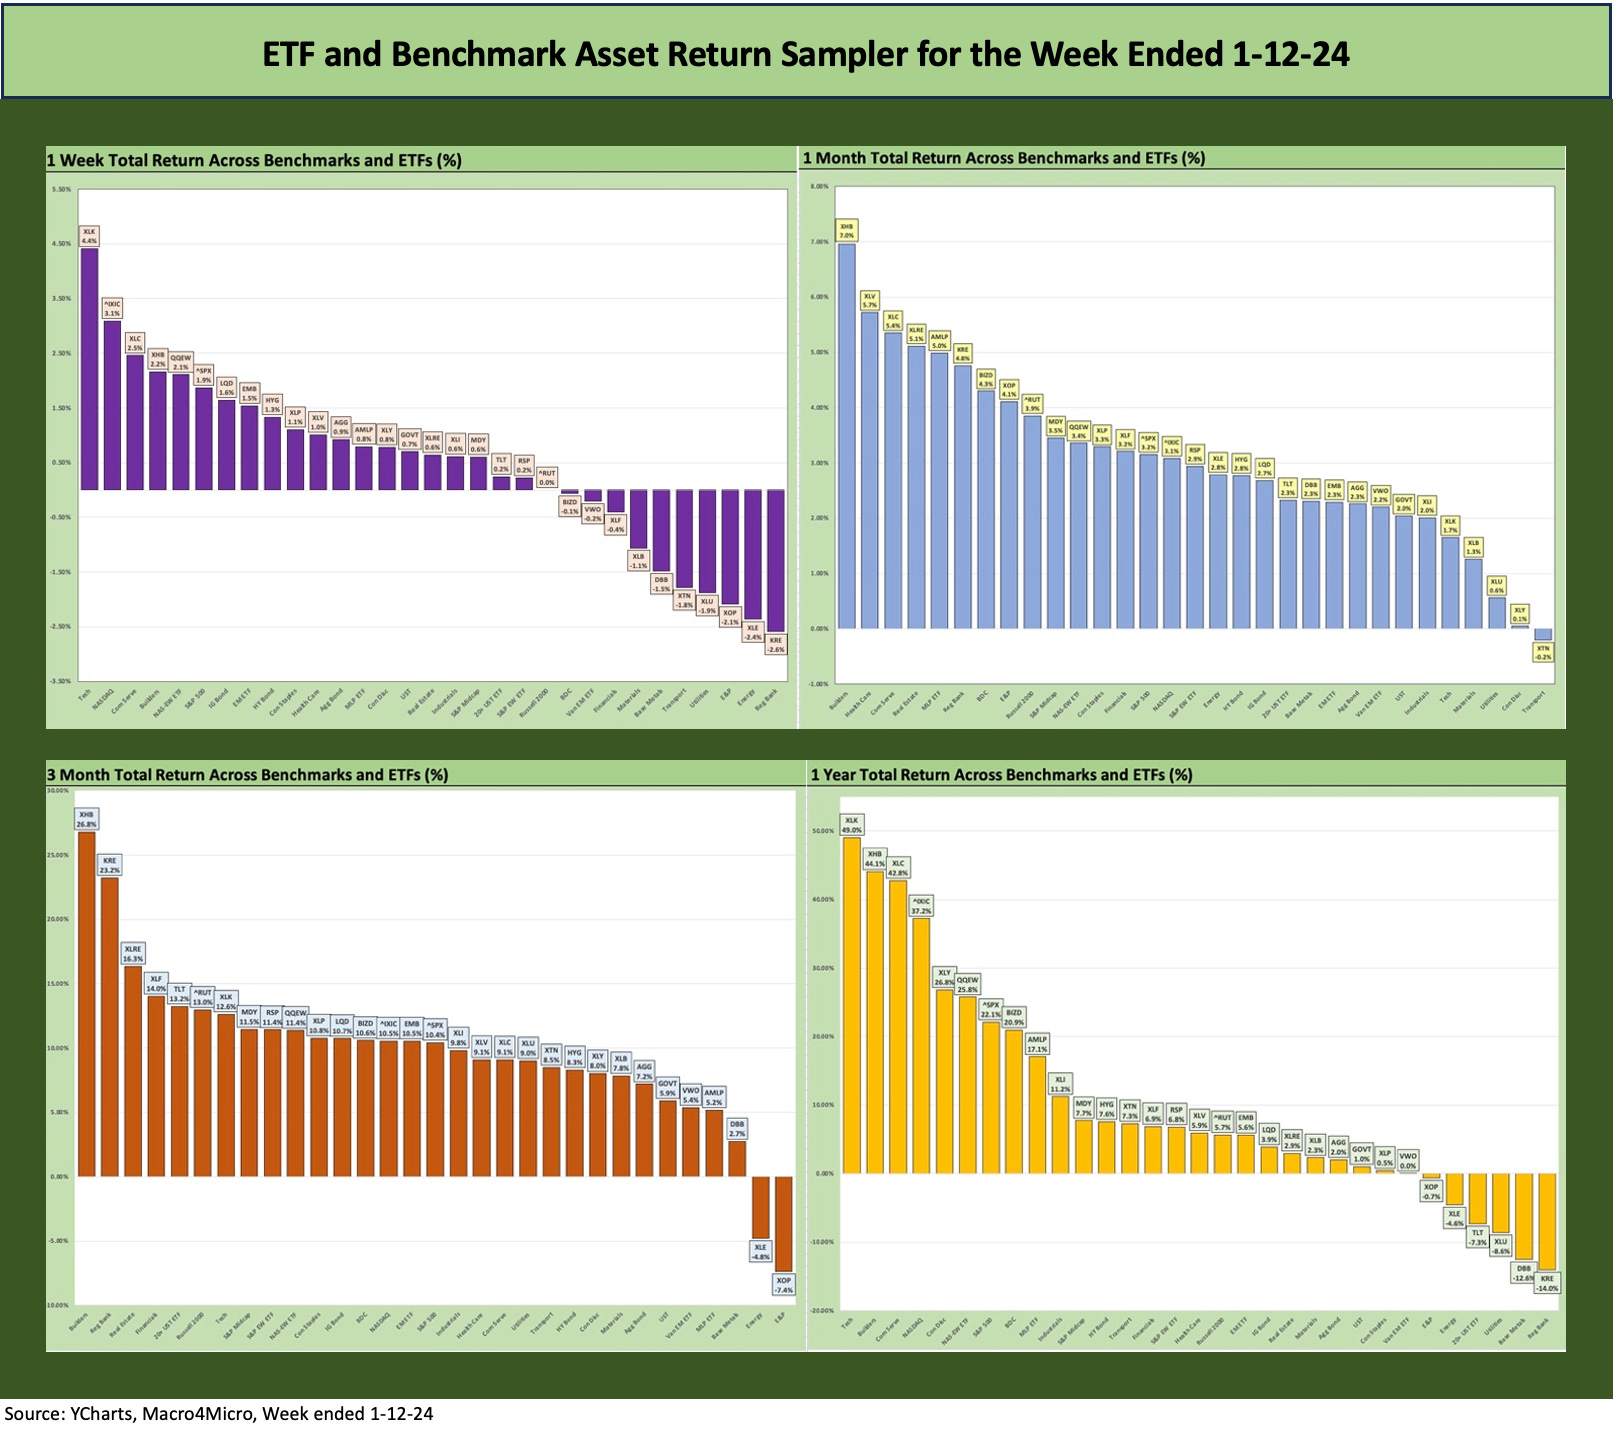
The above chart mix hammers home how it will take some time to unsettle the trailing 1-month, 3-month, and 1-year return symmetry across the 31 benchmarks and ETFs we track each week. We look in more detail at industry-by-industry results further below.
As noted below, the shape of the week ended 1-5-24 (see Footnotes & Flashbacks: Asset Returns 1-7-24) was decidedly negative to kick off the year. For this past week, the move in the UST from CPI to PPI made a ruckus while some softer guidance from DAL after a good quarter and good year sent airline stocks sharply lower. This 1Q24 earnings season will be a digestion challenge and it all will be set against international and domestic chaos. The government at least will not shut down (yet).
The Magnificent 7 heavy ETFs…
Some benchmarks have a few issuer concentration elements that leave them wagged by a few names. When looking across some of the bellwether industry/subsector ETFs, it is good to keep in mind which narrow ETFs (vs. broad market benchmarks) get wagged more by the “Magnificent 7” including Consumer Discretionary (XLY) with Amazon and Tesla, Tech (XLK) with Microsoft, Apple, and NVIDIA, and Communications Services (XLC) with Alphabet and Meta.
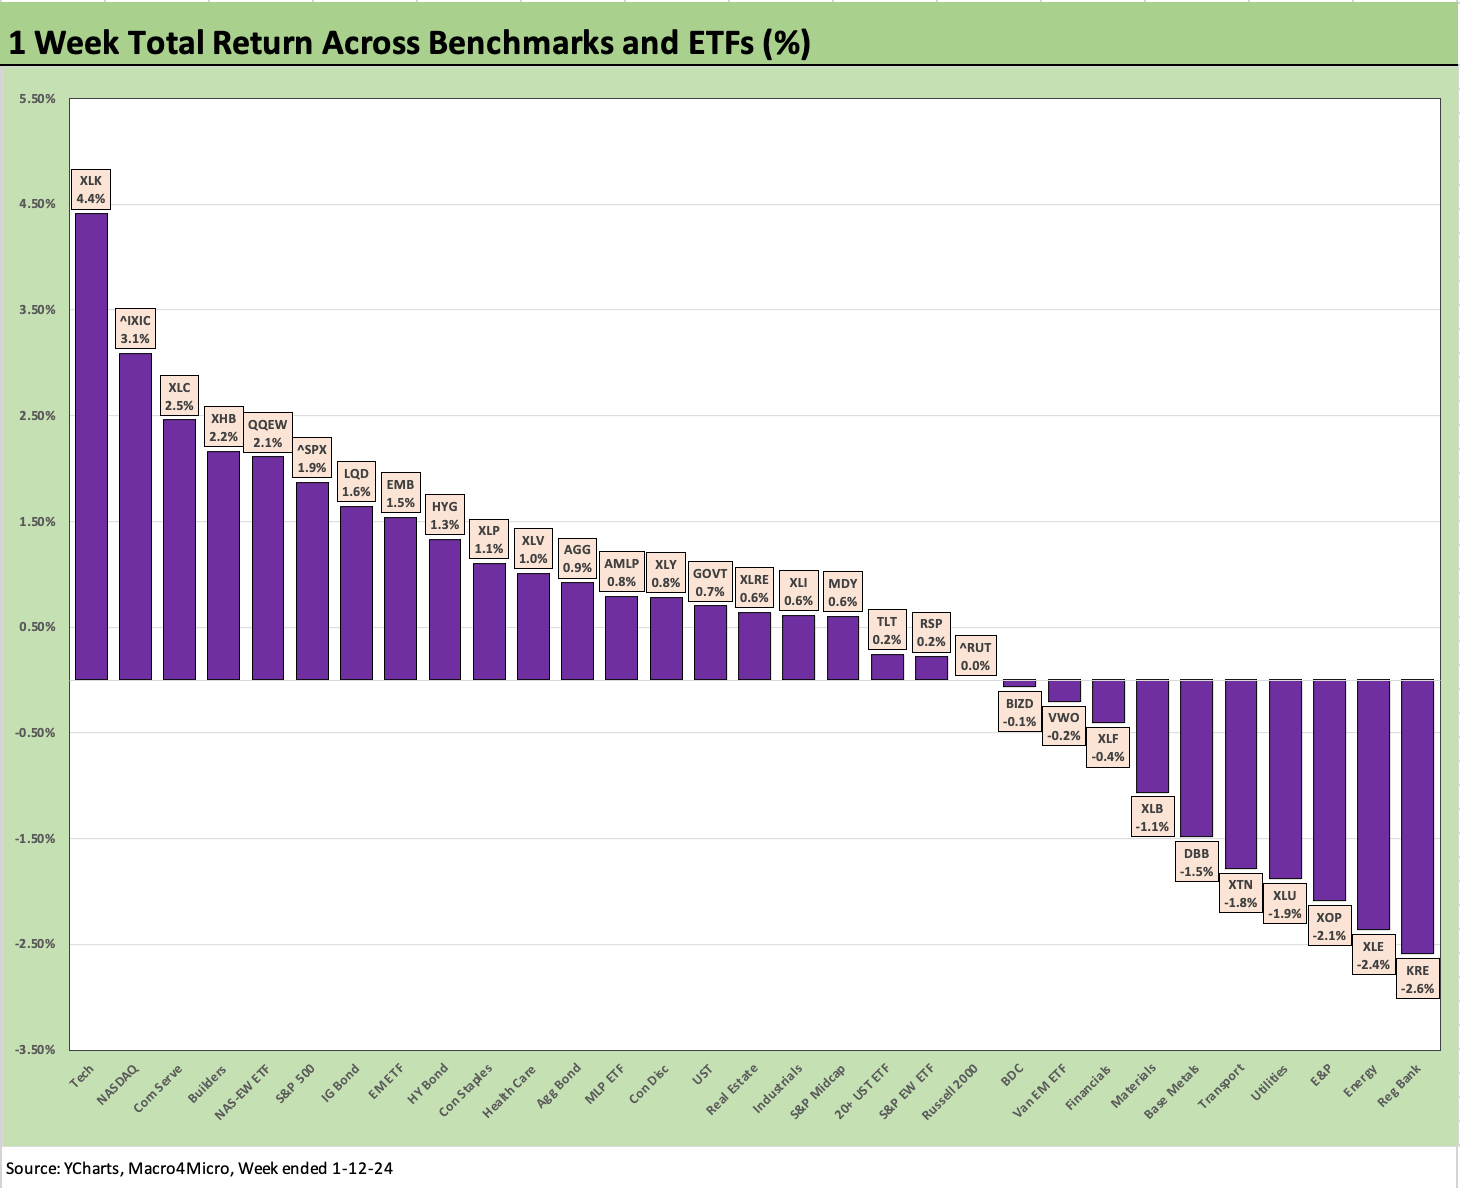
The 1-week returns for the 31 benchmarks and ETFs came in at 21-10 with the Tech ETF (XLK) back on top and Regional Banks (KRE) back on the bottom. This week posted a major differential between the S&P 500 and the equal weighed ETF (RSP) as investors will be watching for signs of breadth again in the new year. That positioning for the week is not bringing much new to what we just went through the past year. The regional banks will be reporting in bulk this week along with some consumer-focused bellwethers.
We did see 3 of the Top 10 come from Fixed Income ETFs this past week with the IG Corporate Bond ETF (LQD) and EM Sovereign ETF (EMB) in the top quartile and HY slightly behind. HY did well on the front end UST shift lower and solid HY spread tightening by -12 bps on the week (ICE). Yields for the HY index are back down inside 8% on the curve and HY spread compression to 7.8% YTW. The BB tier is down to only 6.4% YTW vs. 5.4% on the BBB tier and 5.1% for the IG index. With the 3M UST just under 5.4%, one’s curve view is an overriding allocation variable.
The Energy ETF (XLE) and E&P ETF (XOP) were just above KRE on the bottom of the rankings. The top of the rankings saw the Builders (XHB) in the mix with the tech line items while the bottom of the rankings were more eclectic and diverse by industry. It will take a while to find some patterns as reporting season and more FOMC mindreading hints play out.
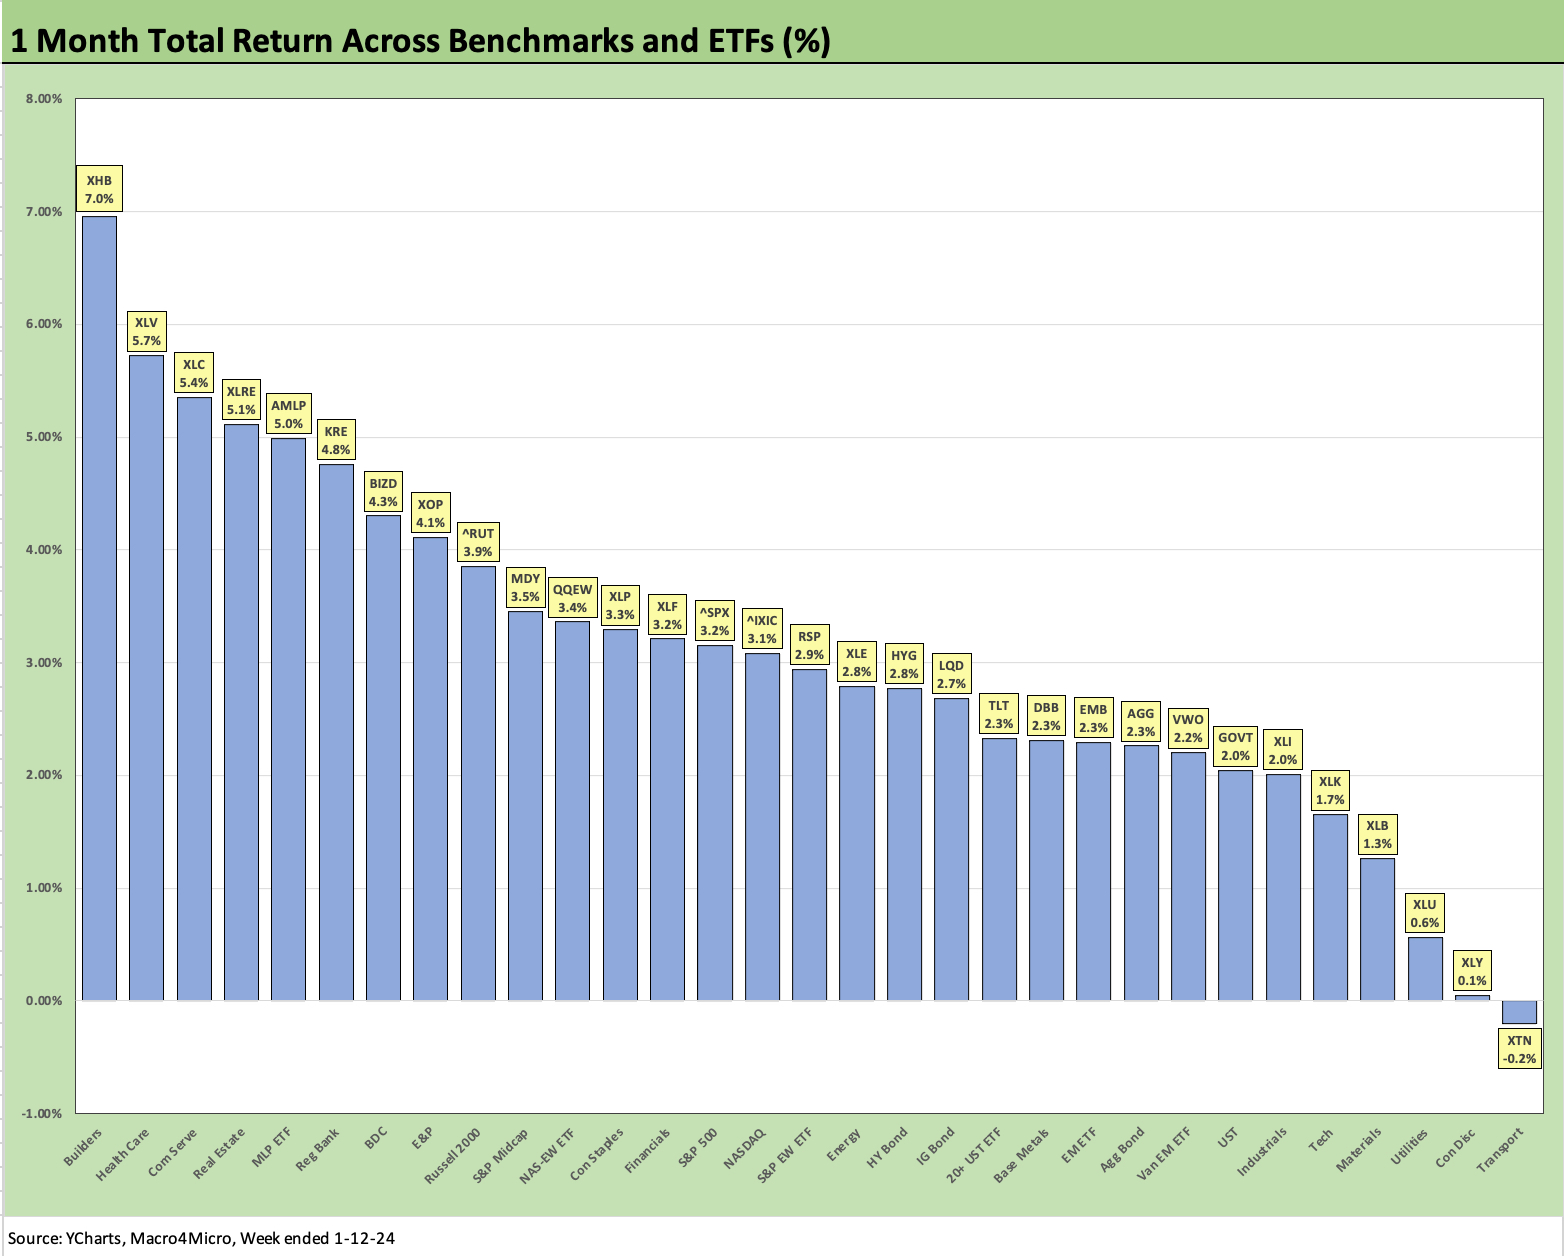
The 1-month numbers show the December party and strong finish spilling over into the numbers with 30 positive and only 1 negative for the second straight week. The Transports ETF (XTN) dropped into last place and the Midstream Energy ETF (AMLP) moved up the ranks with the shift in the measurement period and two decent weeks to start 2024.
The builders finished the year very impressively and are still #1 for the month and the same is true for the 3-month period even though the Tech ETF (XLK) edged ahead for the trailing 1-year period. The strong homebuilding order books to wrap the year will make for an interesting homebuilder earning season and guidance ahead.
The color from the 10-31 and 11-30 fiscal year reporting builders (see KB Home: Wraps Industry Rebound Year, Exiting on Upswing 1-14-24) has been constructive, and the UST curve watching period ahead will clearly be very important to them as the early 2024 period proceeds ahead of their peak season periods.
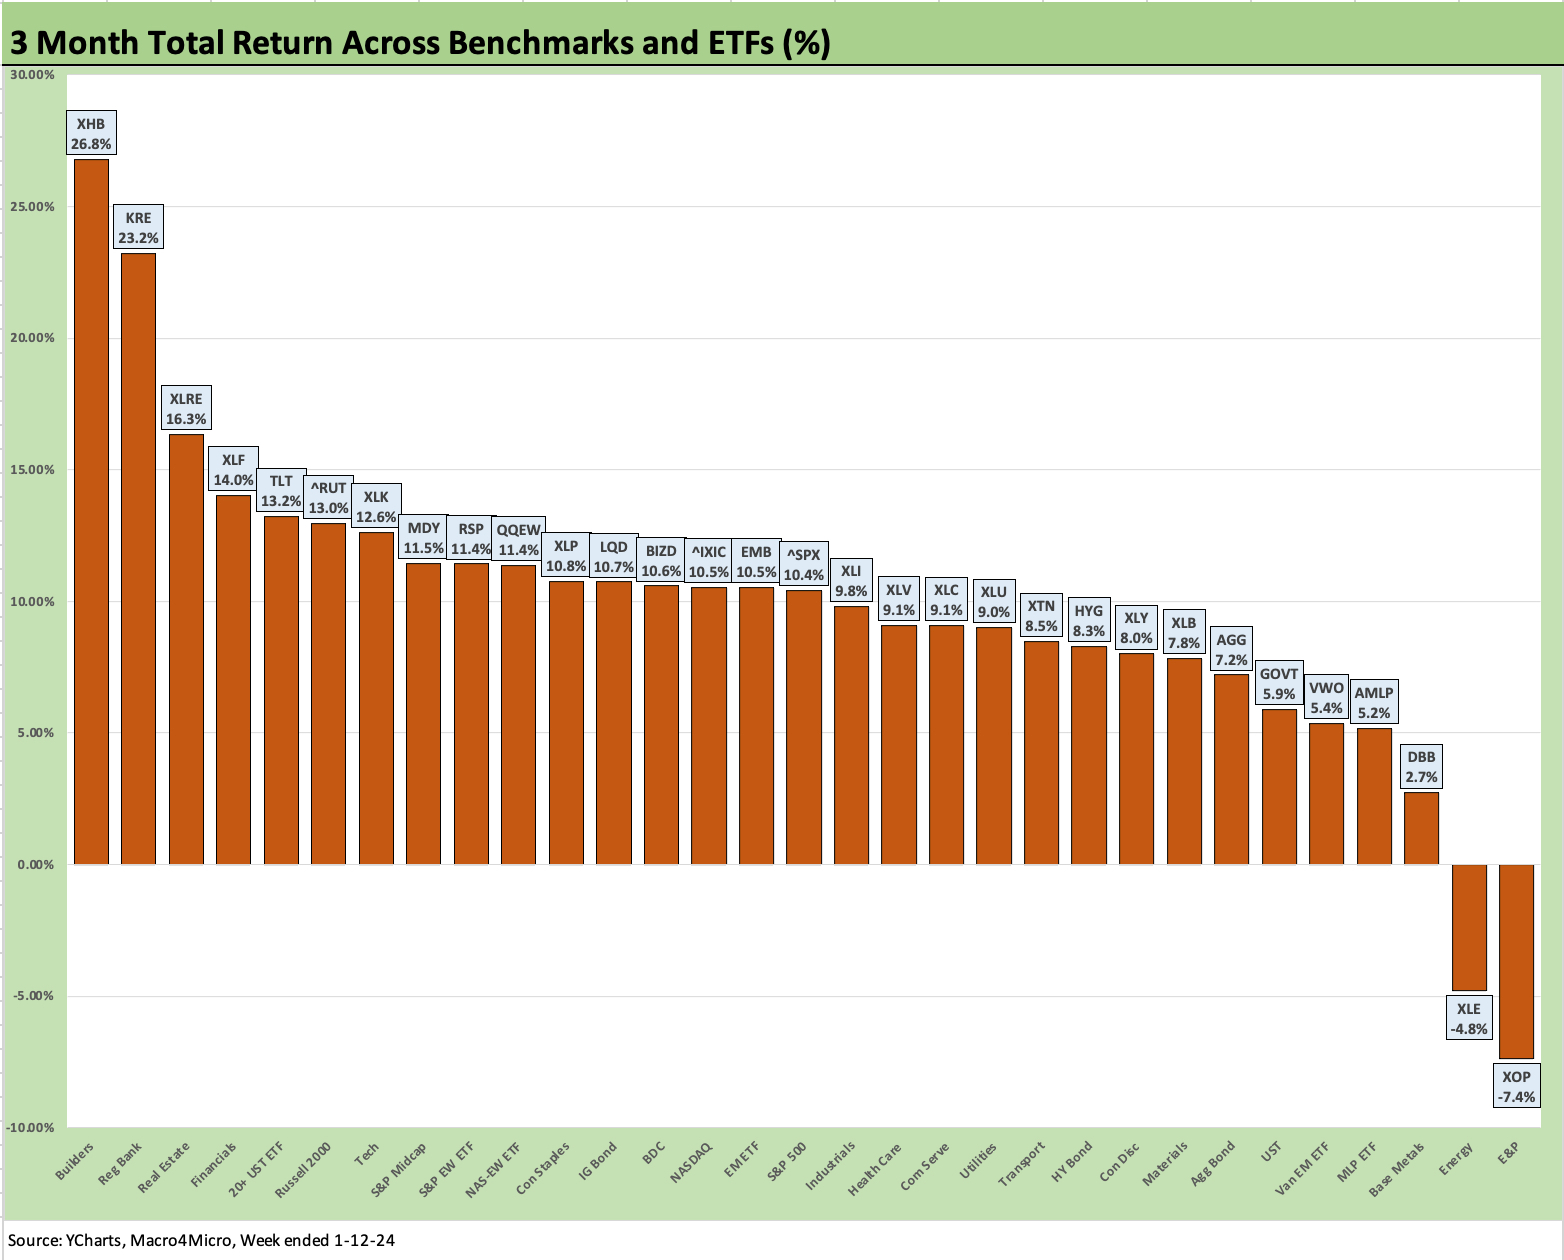
The 3-month period also remains a dull but impressive chart with little movement after ending the year with only one Energy name in the negative zone. Then it was the Midstream ETF (AMLP). For this 3-month chart, the bottom of the rankings in the negative range are comprised of two energy ETFs with the E&P ETF (XOP) and Energy ETF (XLE).
The builder ETF (XHB) is still holding down the lead at #1 with a 3-month return at just under 27% as that sector is feeling the optimism around easing and a lower UST curve taking mortgage rates potentially back into 5% handle range. Lower UST 10Y would translate into favorable 30Y mortgage rates and pull in a lot more housing activity at the entry level and along the value chain up to the move-up segment. Lower rates will also allow even more empty nesters to find a “new nest” whether it be “new” or “existing.” Existing home sales inventory will remain a struggle (but less of one) even at high 5% mortgage rates. Price and how much home one wants to buy on the other side of a sale are the swing factors.
Notable members of the top quartile for the rolling 3-months include the interest rate sensitive Real Estate ETF (XLRE) and Financials (XLF). XLRE was a comeback story after being broadly beaten down with the rolling 3-month returns for XLRE well in excess of the trailing 1 year. XLF will be getting a wave of news over the next two weeks as well with names such as Goldman and Morgan Stanley among the “Big Boys” this week along with PNC, Truist, and M&T plus consumer heavy names such as Discover and Ally. Just that collection alone covers a lot of business line expanse and asset subsectors.
Russell 2000 small caps also are in the top quartile mix above with most of the LTM total return also being generated in 4Q23 but with the first two weeks starting out very slowly for the Russell 2000. The stark improvement in breadth seen in 4Q23 will get tested during this earnings and guidance season.
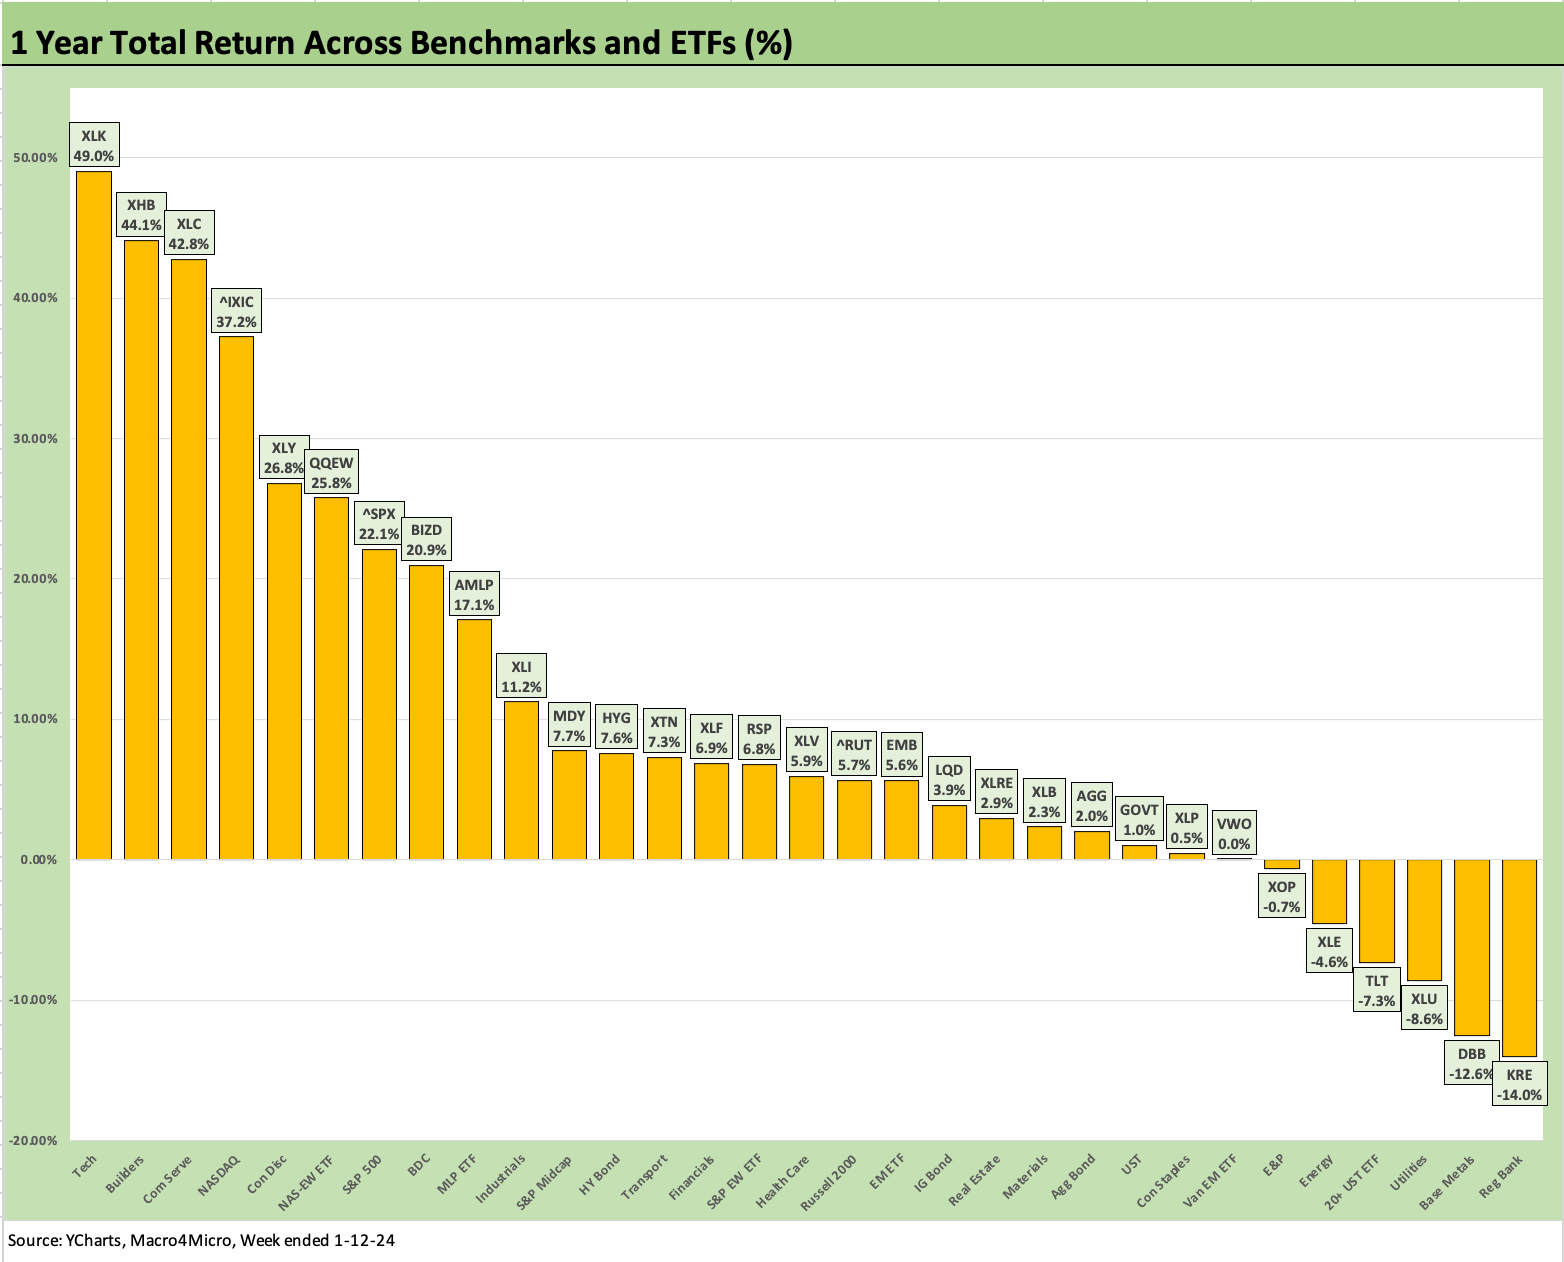
The above chart does not add much to the conversation from what was discussed for the full year 2023 already. XHB dropped to #2 on the strong tech start with XLK back at #1, but there are still 6 of 8 in the top quartile that are comprised of tech-based line items or Magnificent 7 heavy ETFs. XHB and BIZD crashed the top quartile party.
See also:
Credit Performance: Excess Return Differentials in 2023 1-1-24
Return Quilts: Resilience from the Bottom Up 12-30-23
Coupon Climb: Phasing into Reality 12-12-23
HY vs. IG Excess and Total Returns Across Cycles: The UST Kicker 12-11-23
HY Multicycle Spreads, Excess Returns, Total Returns 12-5-23
HY Credit Spreads, Migration, Medians, and Misdirection 11-6-23
Quality Spread Trends: Treacherous Path, Watch Your Footing 10-25-23