
Footnotes & Flashbacks: Asset Returns 1-7-24
We look at week 1 asset returns with a slow start, earnings season teed up, and CPI this week.


We look at how asset returns frame up after a rough start to the year as the curve backed up and the 31 benchmarks and ETFs we watch weighed in at 25 negative and only 6 positive.
Numerous highfliers of late 2023 took a step back with a mixed bag of names in the top quartile.
Eyes turn to CPI this week for some reinforcement and clarity after a very heady rally in the UST to close out 2023.
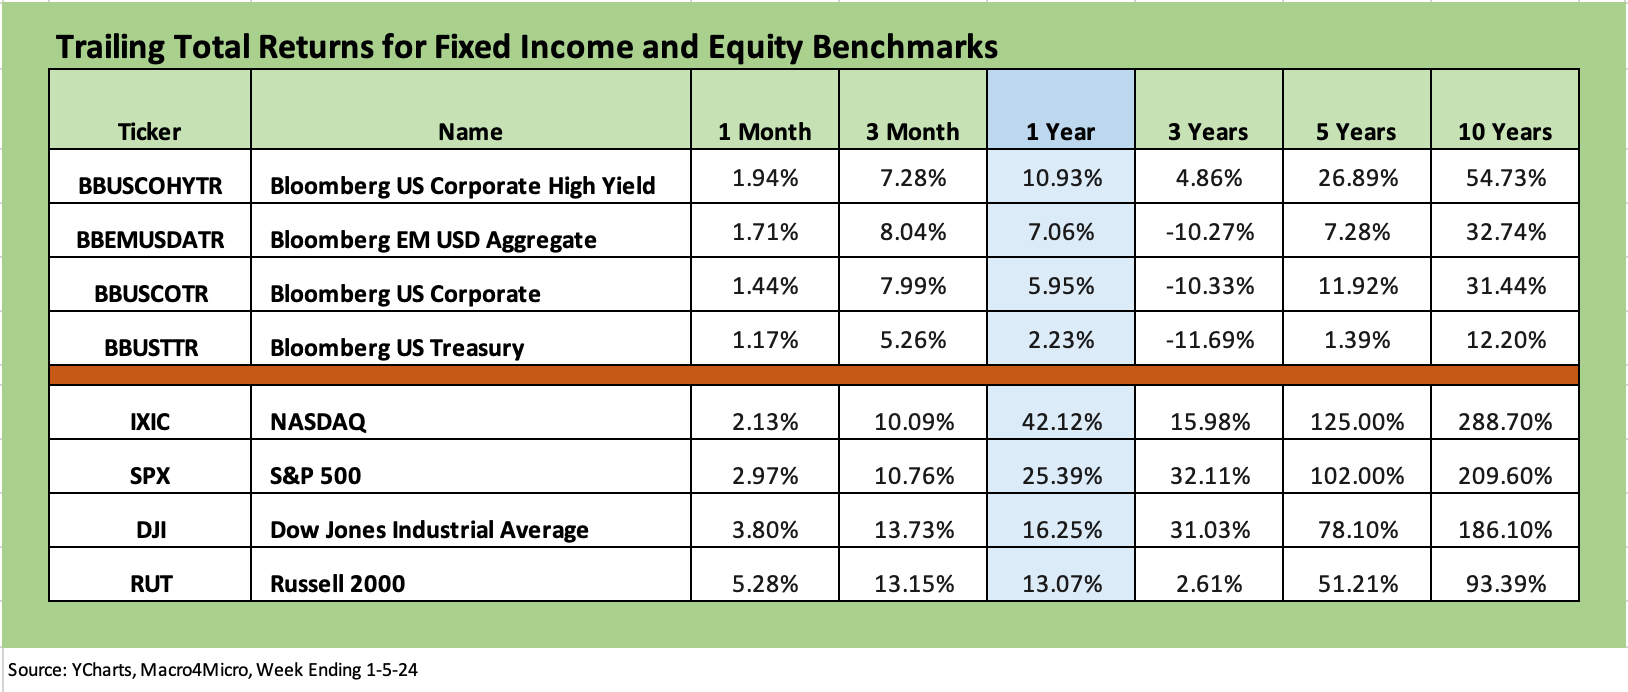
The above chart runs through the trailing time horizon returns for the main debt and equity benchmarks we monitor. The full year 2023 numbers were covered in detail in last week’s edition (see Footnotes & Flashbacks: Asset Returns 1-1-24).
We highlight that we are shifting over from a YTD column in the above charts to a trailing 1-year column with the new year just underway. The same is true for our other former year-to-date charts herein as we look back over various trailing time horizons. We line up the total returns above in descending order of returns for that 1-year horizon.
We already covered the initial action in 2024 for yields this past week (see Footnotes & Flashbacks: State of Yields 1-7-24). The UST rose and steepened after an amazing run in Nov-Dec. Duration was pummeled during the 2022 tightening shock and then beaten up for much of 2023 before the big late year rally.
As noted in the chart in the 3-month column, HY and IG Corporate had a very strong finish to the year with spreads tighter and duration winning. The UST curve pulled back a bit this past week as covered in our separate Footnotes publication on yields, and spreads also widened slightly in IG and were materially wider in HY. The 8% threshold for HY and 5% line in IG will attract plenty of interest from yield starved pension asset allocators in 2024.
If the fear is a steepening on solid fundamentals, then HY can ride the credit cycle and take less of a hit on duration. If you believe the Fed will cut aggressively on lower inflation but face a bull steepener on the other side on fundamental strength and UST supply, then US HY wins vs. IG. If you see the UST declining in a bull steepener while fundamentals stay solid, there are fresh winnings in both IG and HY. The scenario of the credit cycle cracking would favor IG as an allocation on the UST response and quality spreads widening.
That is a mixed menu of ingredients in the total return recipe. We see a better balance of risks overall in IG for 2024.
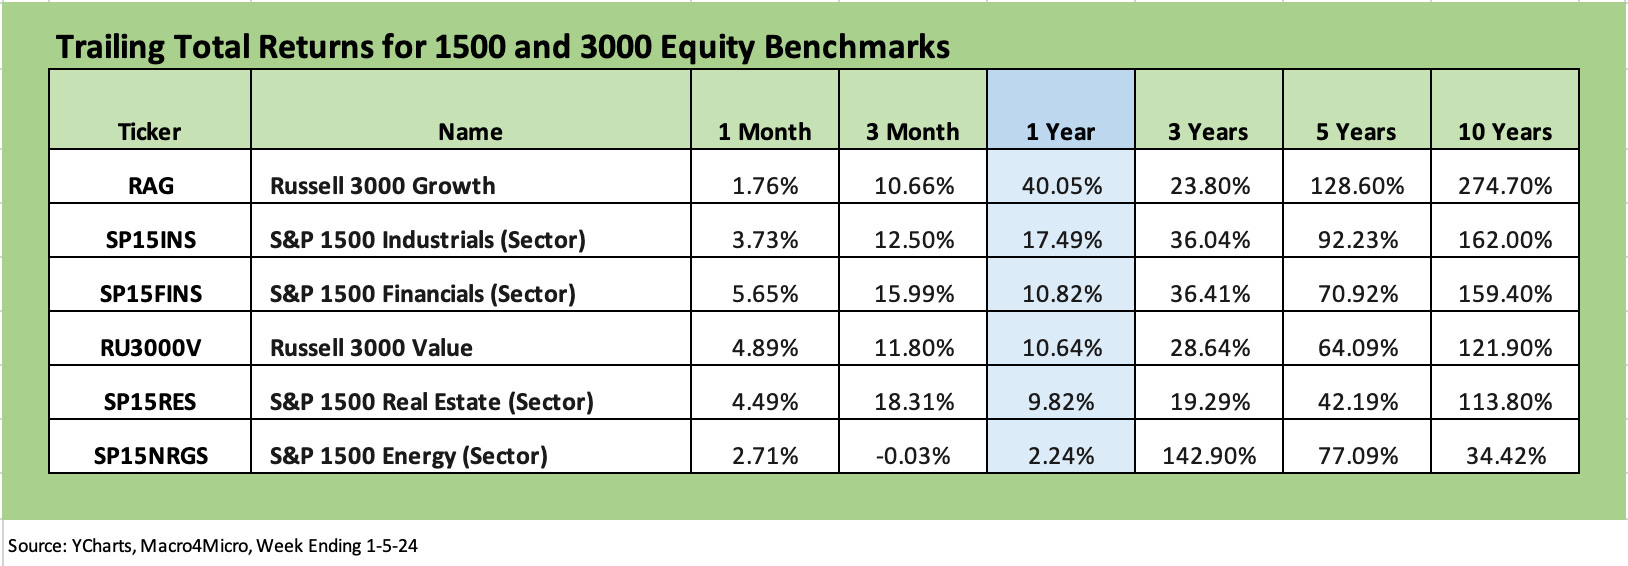
The above chart updates the 1500 and 3000 series that broadly saw a very strong rally late in the year with the exception of the volatile energy sector. The main takeaway from a look at this chart is 5 of the 6 benchmarks have double digit returns over only 3 months. For many years looking at long-term returns in equities, that is a year worth of returns in only one quarter. Quite a 4Q23 period!
With all the noise around Real Estate, the 3-month rebound of +18.3% stands out from the pack. The market has evolved in making distinctions across the underlying real estate categories, but the main driver has been the downshift in the UST curve and what that means for the real estate cycle and value of dividend stocks (e.g. REITs).
Financials and Industrials are also rolling along at a good 3-month clip with Financials needing a good run late in the year to crack into double digits. Well over 100% of the 1-year trailing returns for financials were generated in the last 3 months. With banks a feature in the early stages of the reporting season, there will be a lot of fine print dead ahead on asset quality and business line reserving needs. Regional banks have been digging themselves out of the March 2023 pit for most of the year and, as we detail in the ETF section below, have been right up at the top for 1-month and 3-month returns.
ETF and benchmark time horizon returns…
As we show in the next chart, we started dropping in the following box of four different time horizons in the weekly. The chart grouping allows for an easy view of the shape of returns for each period (1-week, 1-month, 3-months, and now 1-year). We had been using “YTD” but will now switch to trailing 1-year as we enter 2024.
We occasionally see all negatives or all positives, but we found this chart mix to be an easy way to look at the current configuration and how running numbers may have reshaped in just a week, a month, or a rolling 3-month period and flow into the 1 year or YTD run rates. When markets get volatile, the reshaping can flow in quickly.
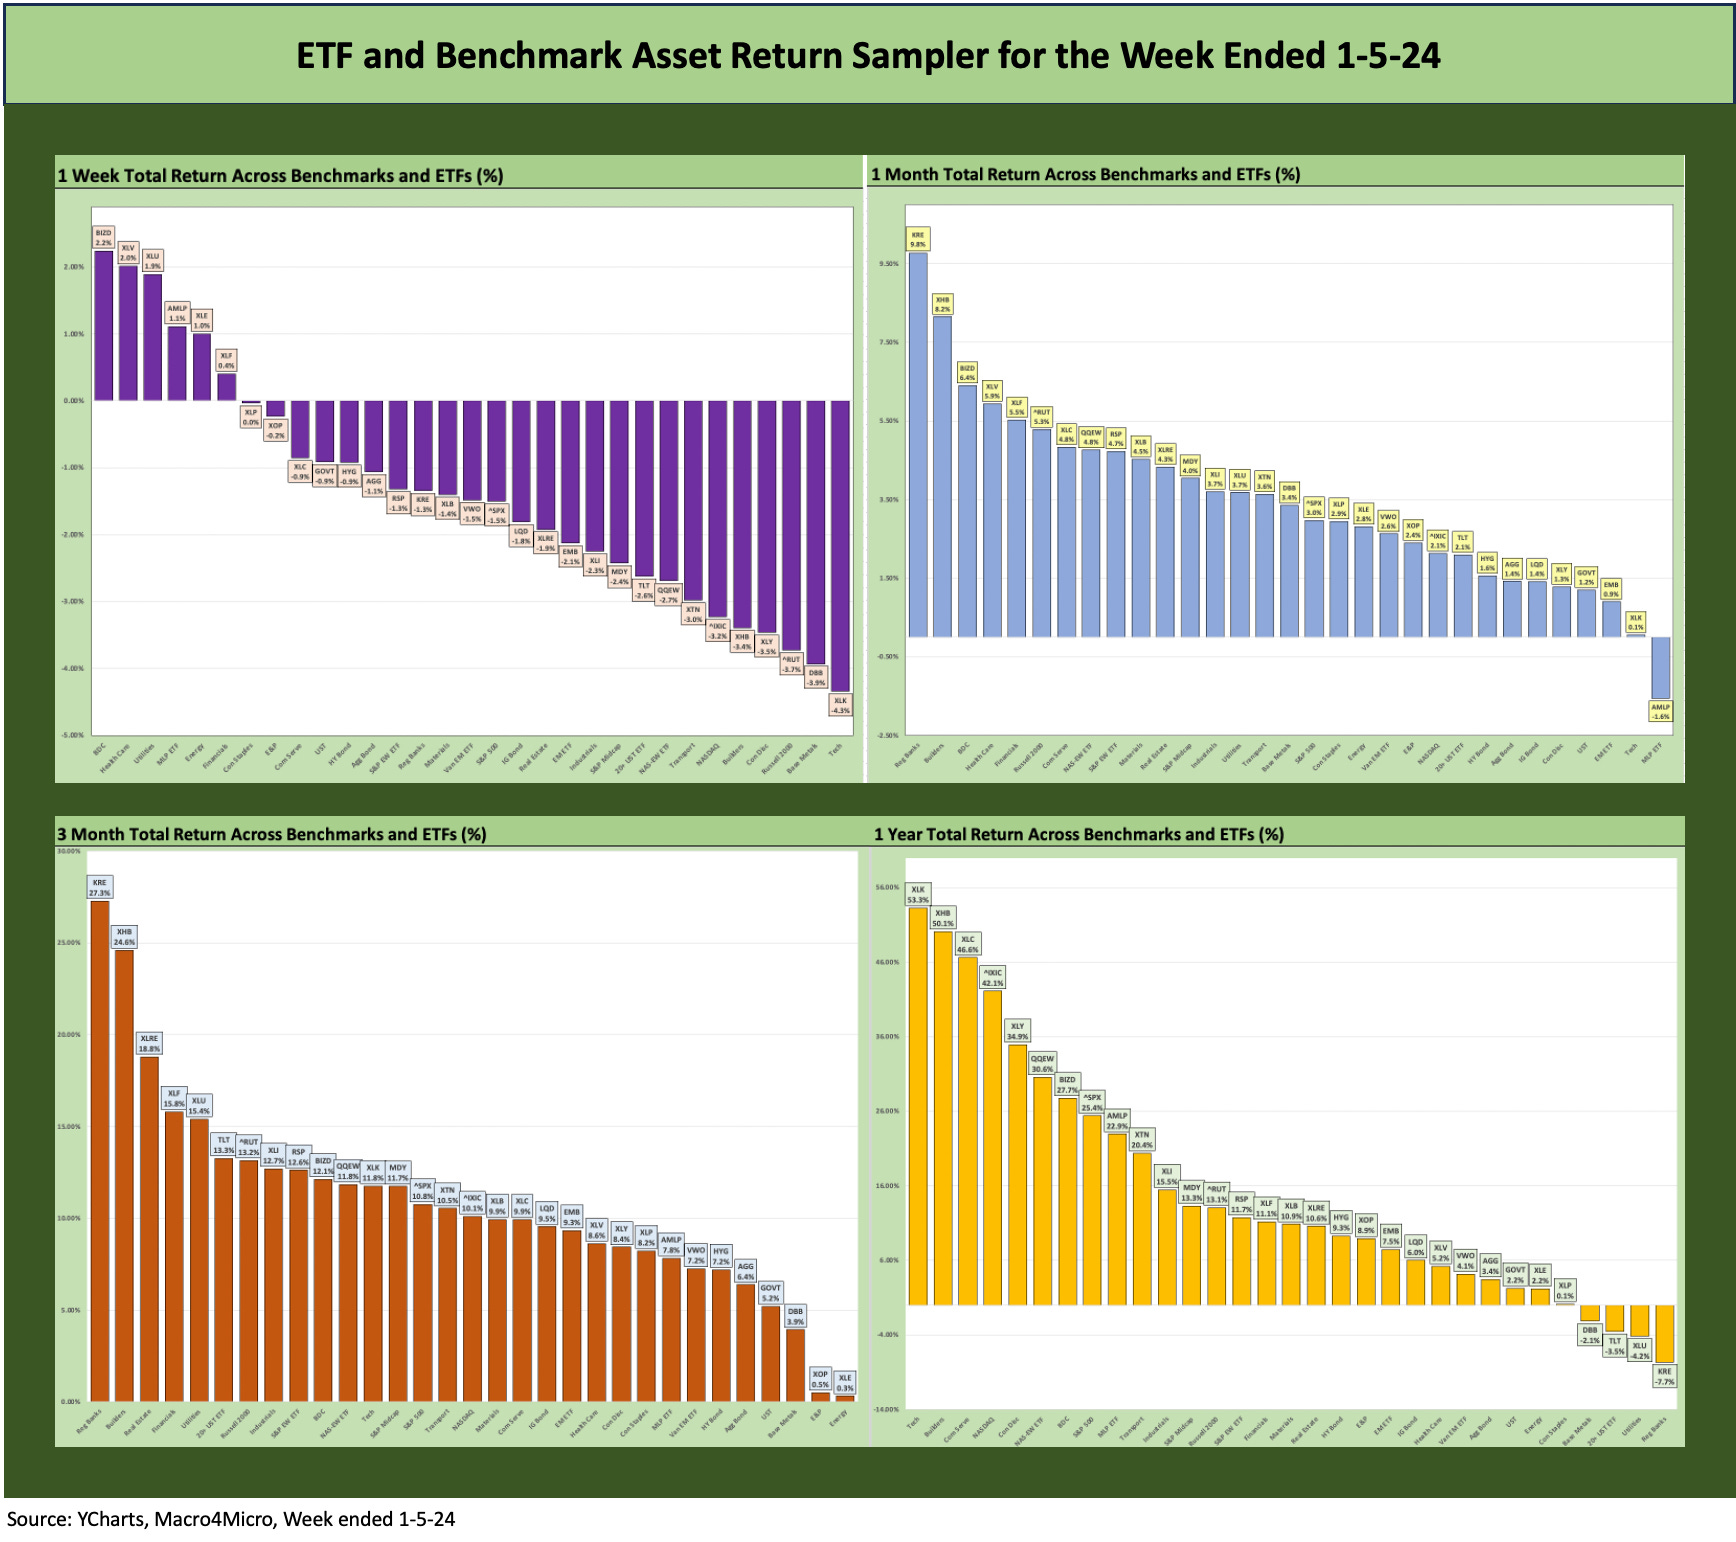
The above chart shows the four trailing time horizons with only this past week deviating from an otherwise overwhelmingly positive scoresheet for 1-month, 3-month and 1 year time horizon in 2023 after the 2022 carnage. We would expect that after such a dazzling rally to wind the year down (see links at the bottom of this piece), it is going to take some bad news (for the bulls) that lasts more than a few weeks for this collection of bar charts to go through any major reshaping.
Time horizon returns for ETFs and benchmarks…
The Magnificent 7 heavy ETFs…
Some benchmarks have a few issuer concentration elements that leave them wagged by a few names. When looking across some of the bellwether industry/subsector ETFs, it is good to keep in mind which narrow ETFs (vs. broad market benchmarks) get wagged more by the “Magnificent 7” including Consumer Discretionary (XLY) with Amazon and Tesla, Tech (XLK) with Microsoft, Apple, and NVIDIA, and Communications Services (XLC) with Alphabet and Meta.
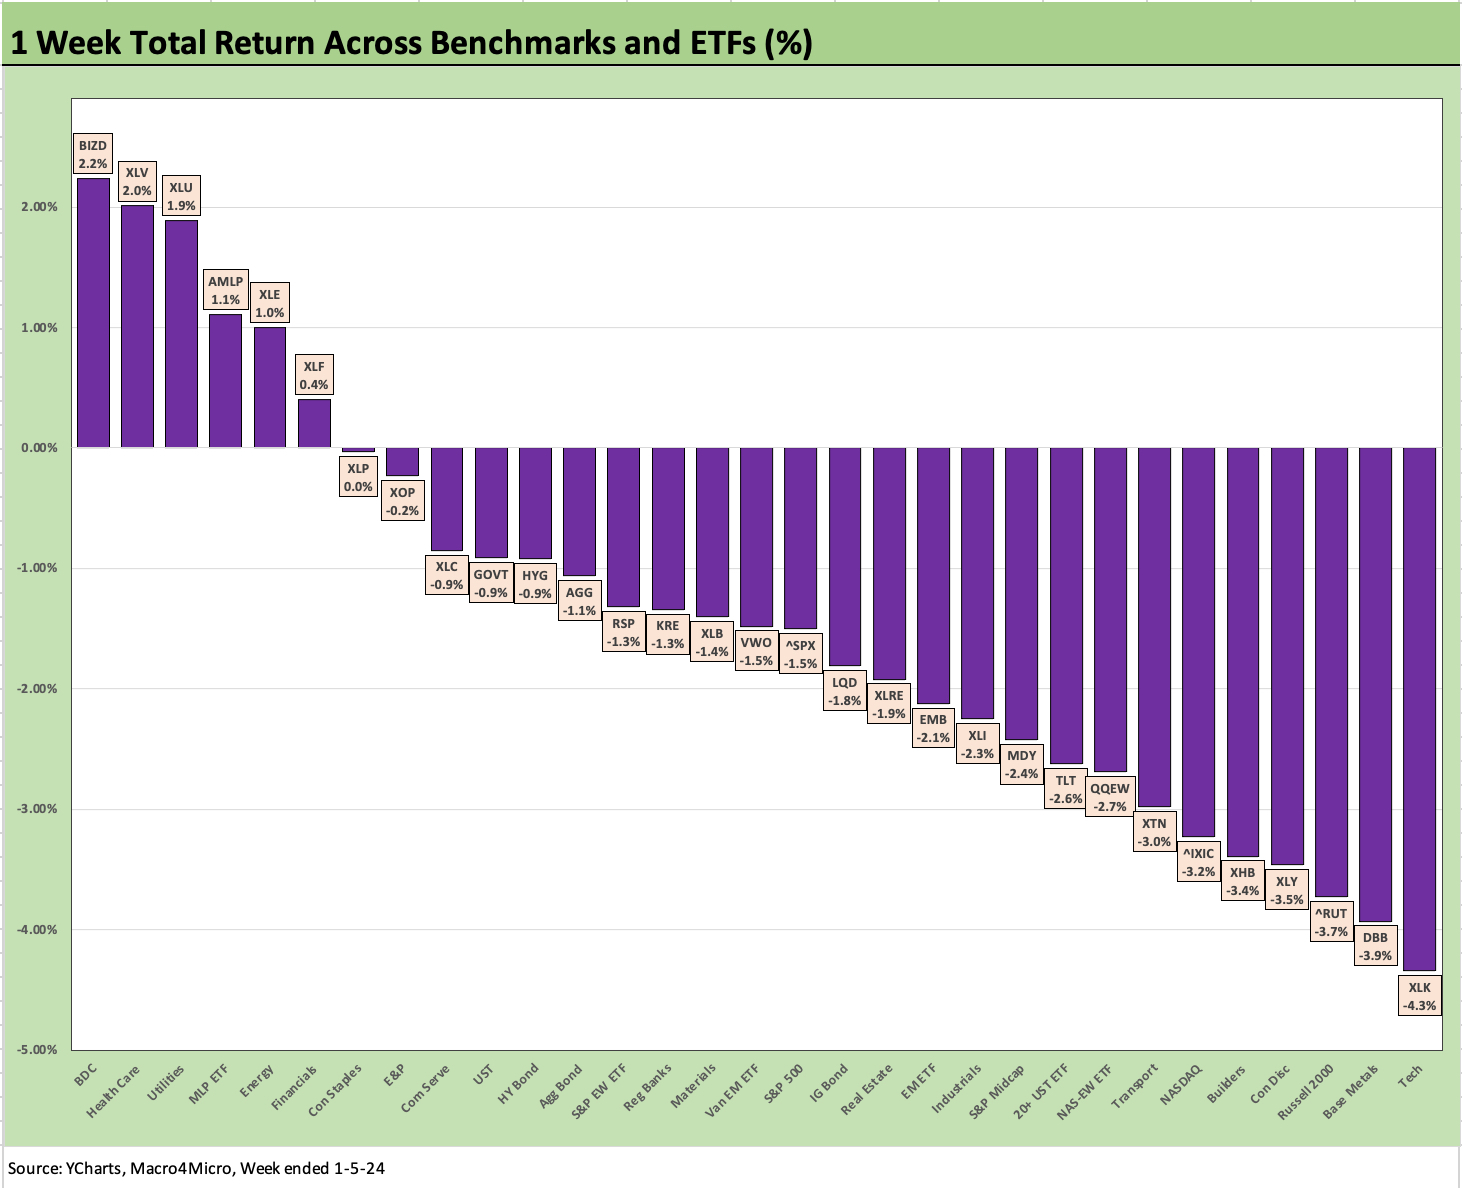
The 1-week returns weighed in with only 6 positive and 25 in negative range with a mix of sectors that tell a partial story with 3 Energy ETFs (AMLP, XLE, and XOP) in the top quartile mix. We see the BDC ETF (BIZD) leading the pack with Financials in the positive range. That mix of BDCs and Financials could be a more optimistic view on what 4Q23 earnings season will bring for results and color on the credit cycle.
We see the Utility ETF (XLU), and Staples (XLP) in the top quartile, and that can be tied to the idea that rates will move lower and dividend stocks will have a better time ahead after an old school beatdown in 2023. Healthcare is a mixed bag but generally viewed as defensive.
The bottom of the rankings for Week #1 has a lot of the big winners from 2023 with the Tech ETF (XLK) on the bottom with Builders ETF (XHB) in the bottom 5 as well. The bottom quartile generally looks a lot like the winners of 2023 (heavy on tech and Magnificent 7 heavy ETFs) or late year bloomers of 2023 such as small caps. We see 6 fixed income ETFs in the red with TLT the weakest of the lot as the most duration sensitive below EM Sovereigns (EMB) and duration sensitive IG Corporates (LQD).
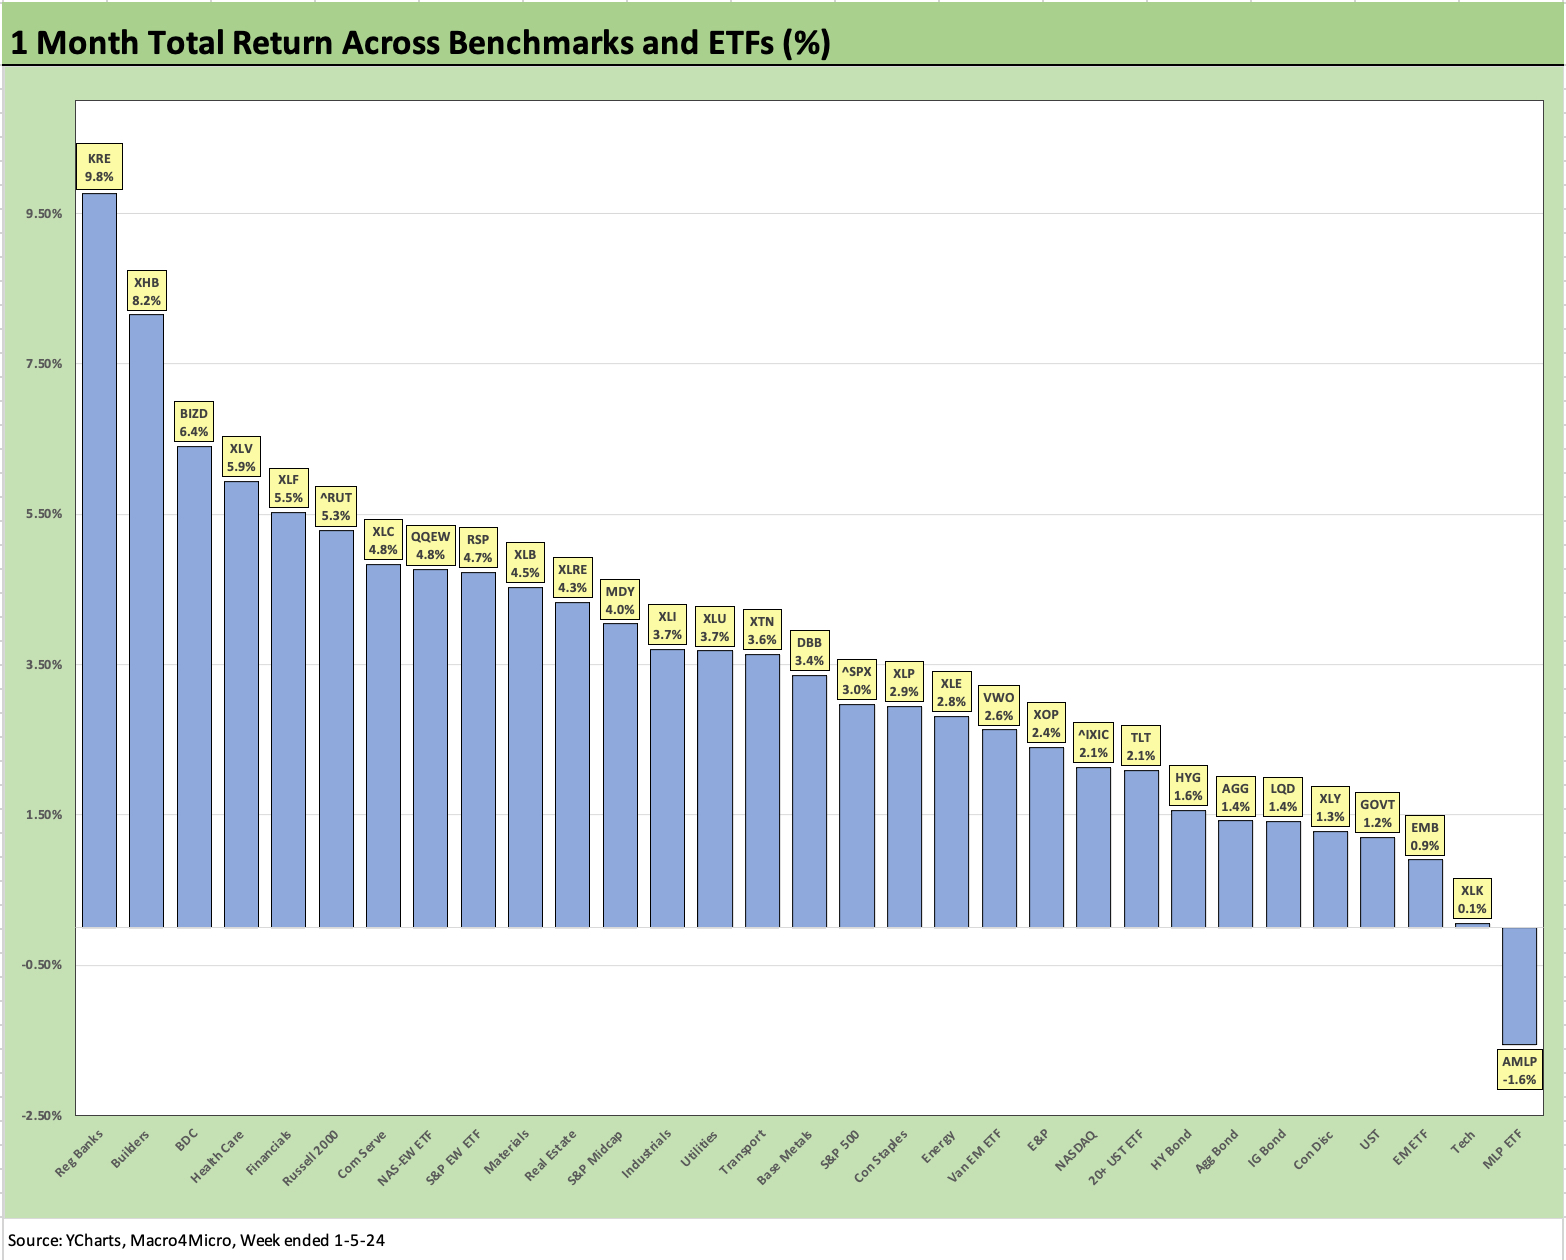
A single underperforming week was not going to ruin the very strong end to 2023, and we still see 30 positive and 1 negative for the month with Regional Banks (KRE) at #1 and Builders (XHB) at #2, but with the BDC ETF (BIZD) stepping into the #3 slot with the defensive Health Care ETF (XLV) and Financials ETF (XLF) rounding out the Top 5.
Fixed income ETFs had a bad week which sent that ETF subgroup down to 6 of the bottom 10 in returns with Energy Midstream on the bottom and the Tech ETF (XLK) in second to last place with NASDAQ on the higher end of the bottom 10.
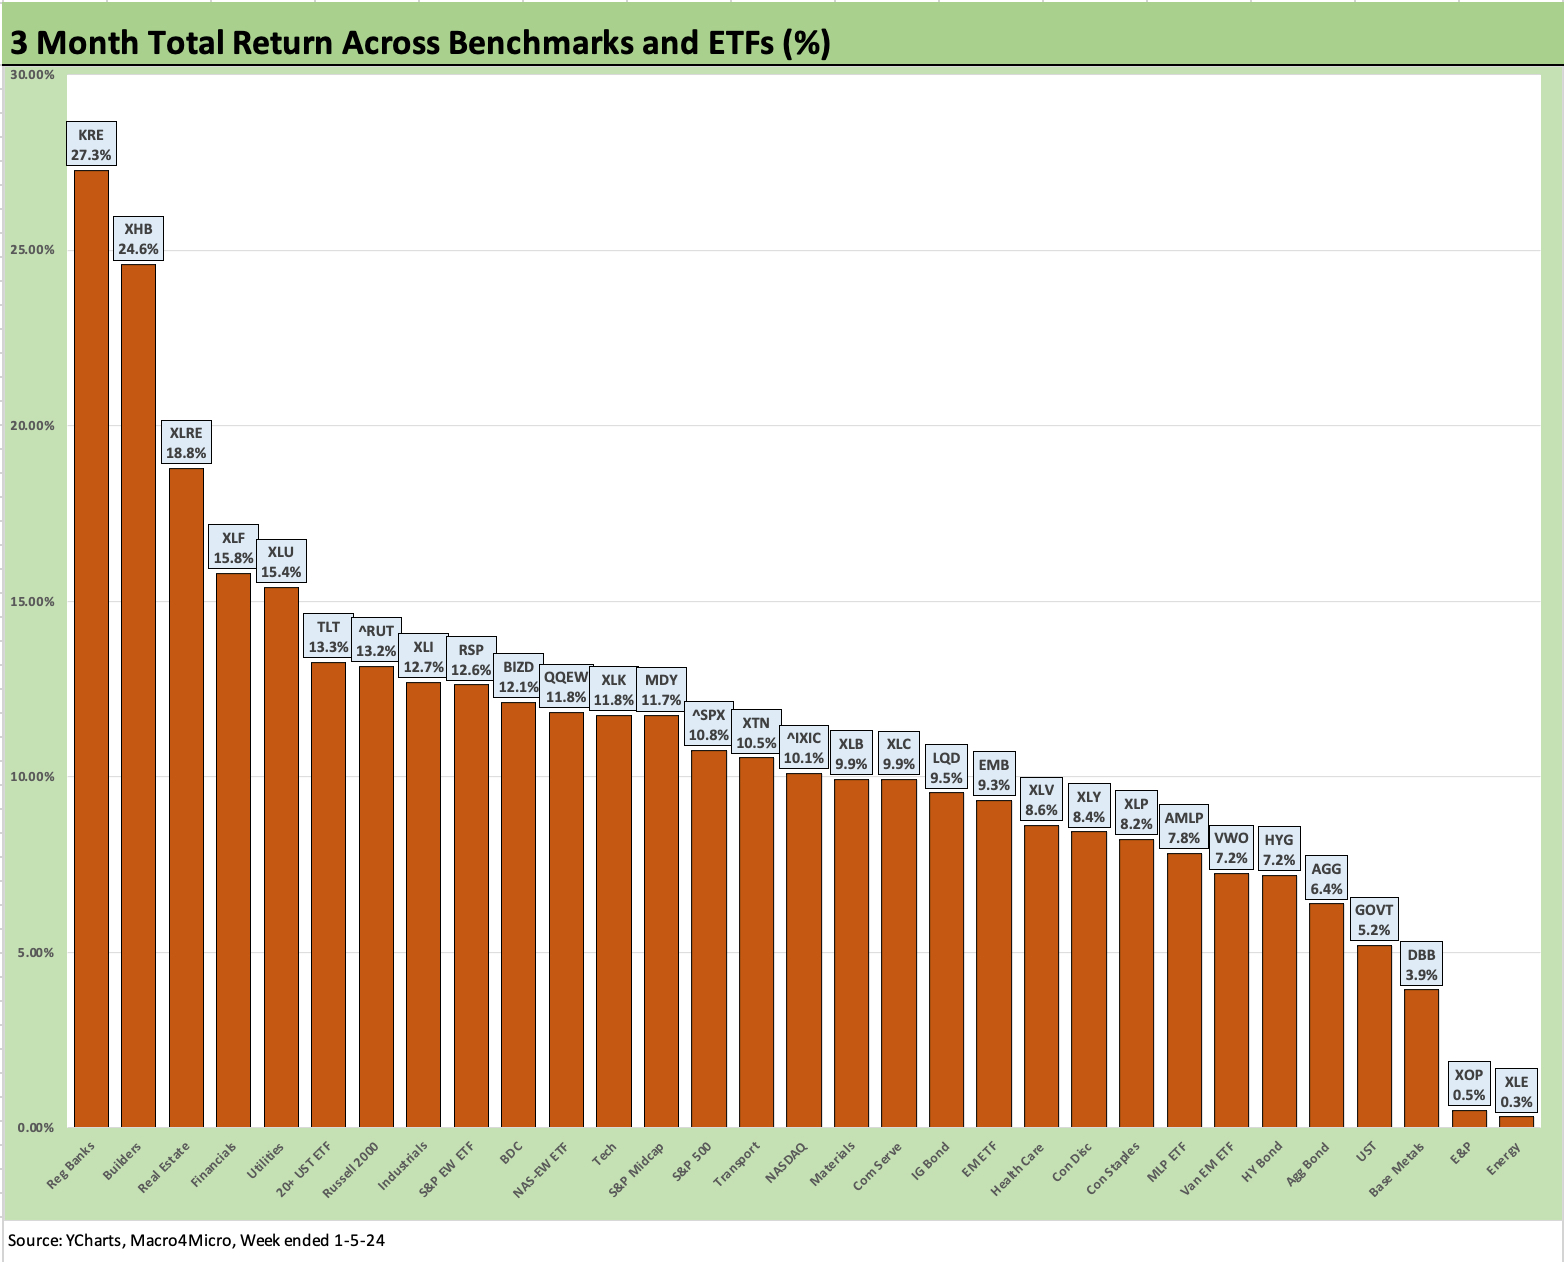
The rolling 3-month time horizon pitched a shutout with all 31 positive. That about covers the theme of the 4Q23 period where all risks – duration, credit, and equities came out with solid returns.
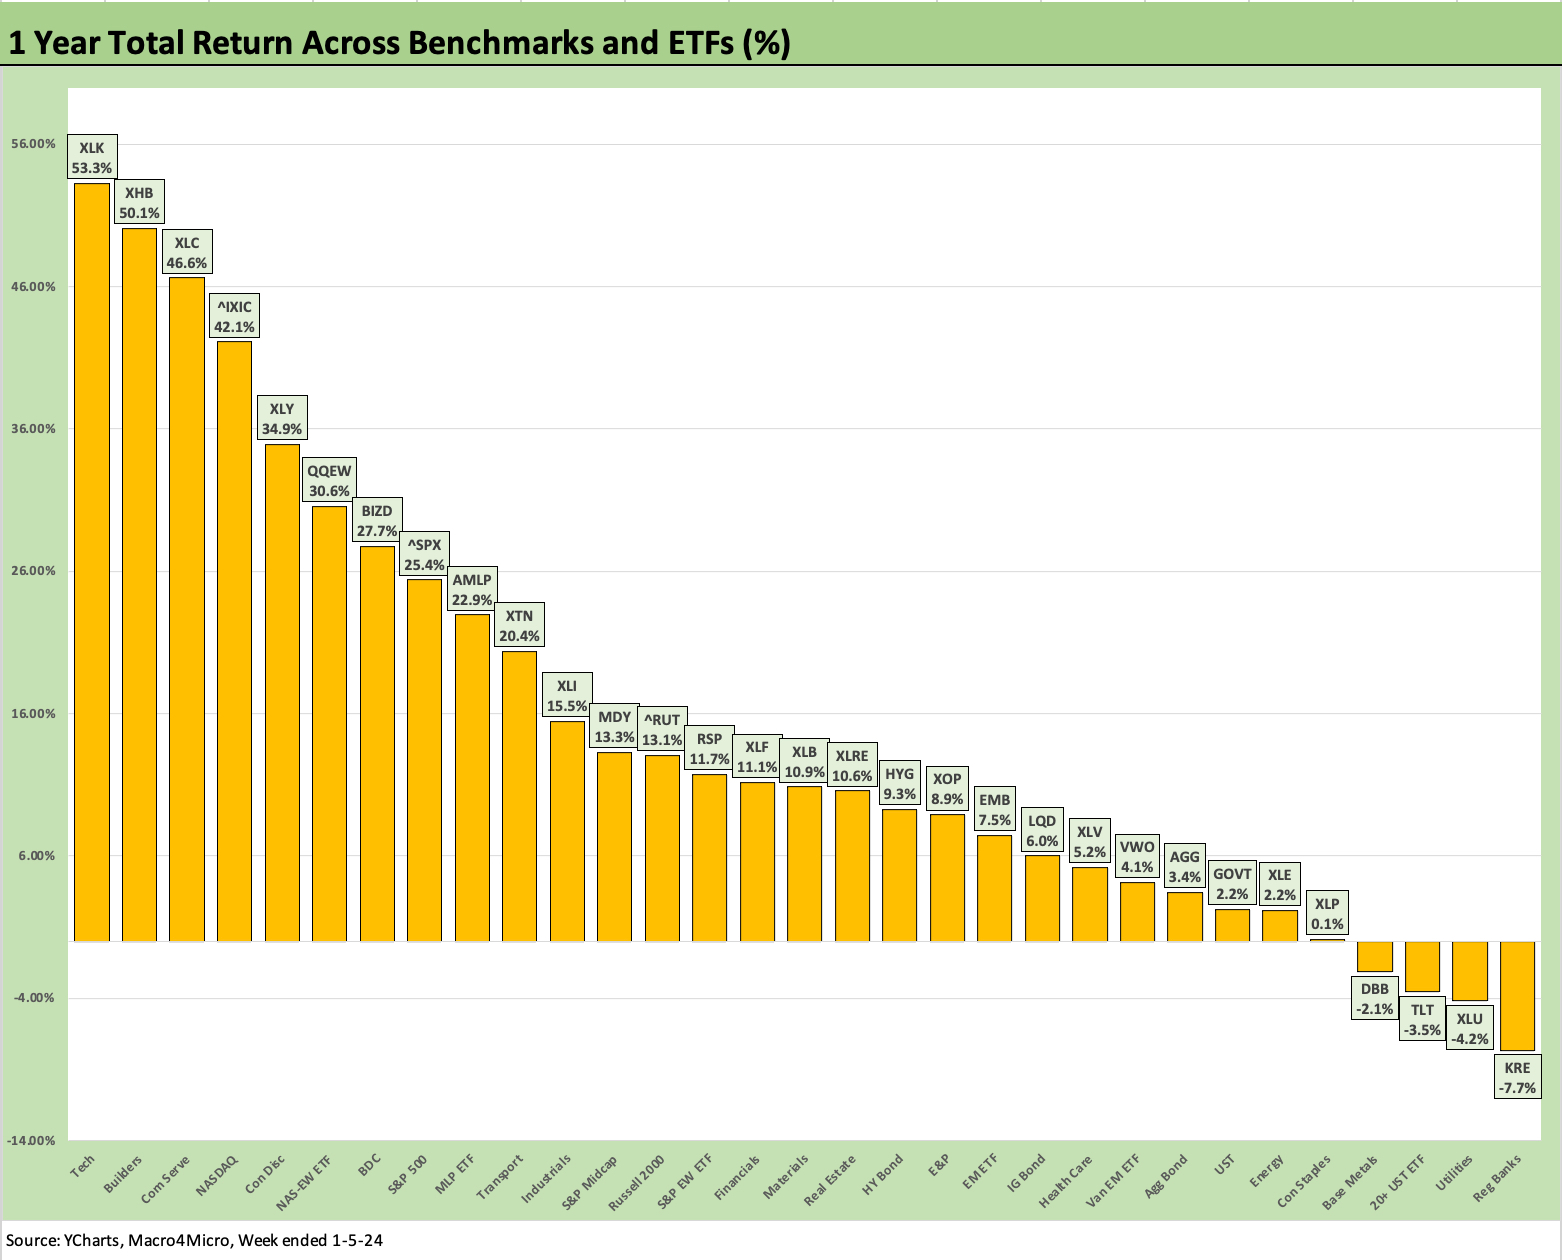
The above chart shows the trailing 1-year total return scorecard at 27-4 again – the same as the annual 2023 count. We see two new names on the negative side with the long duration 20+ year UST ETF (TLT) and Base Metals ETF (DBB) falling into the red with Energy (XLE) and Staples (XLP) graduating from red to black.
The winners in the group were coming off very high returns so the movement was limited with the Tech ETF (XLK) at #1 overtaking Builders (XHB), who dropped to #2. The rest of the top quartile was tech or Magnificent 7 heavy until BDCs (BIZD) and the S&P 500 which appear at the low end of the lead quartile.
Many of these sectors had very big LTM leads coming out of the very strong year, but the interest rate sensitive rallies will leave investors on the edge of their seat more than most. Guidance season is also dead ahead.
See also:
Credit Performance: Excess Return Differentials in 2023 1-1-24
Return Quilts: Resilience from the Bottom Up 12-30-23
Coupon Climb: Phasing into Reality 12-12-23
HY vs. IG Excess and Total Returns Across Cycles: The UST Kicker 12-11-23
HY Multicycle Spreads, Excess Returns, Total Returns 12-5-23
HY Credit Spreads, Migration, Medians, and Misdirection 11-6-23
Quality Spread Trends: Treacherous Path, Watch Your Footing 10-25-23