
Footnotes & Flashbacks: Asset Returns 2-18-24
We look at a fresh batch of mixed asset returns in a week filled with data points during the economic release wave.


The asset return profile across the mix of benchmarks and ETFs we track are shifting in an adverse direction, but positive returns still slightly exceeded negative over the past week.
Most of the fixed income assets we follow were in the red for the week as well as for the trailing 1-month period, but over that same month we see +5% handle returns or better for 12 of the 31 benchmarks and ETFs for a total positive to negative score of 22-9 for the month and 29-2 for the rolling 3-months.
The “UST curve drives equities” link seems to have backed off a bit this past week in the midst of an overall unfavorable mix of releases for the UST curve and FOMC easing story this past week.
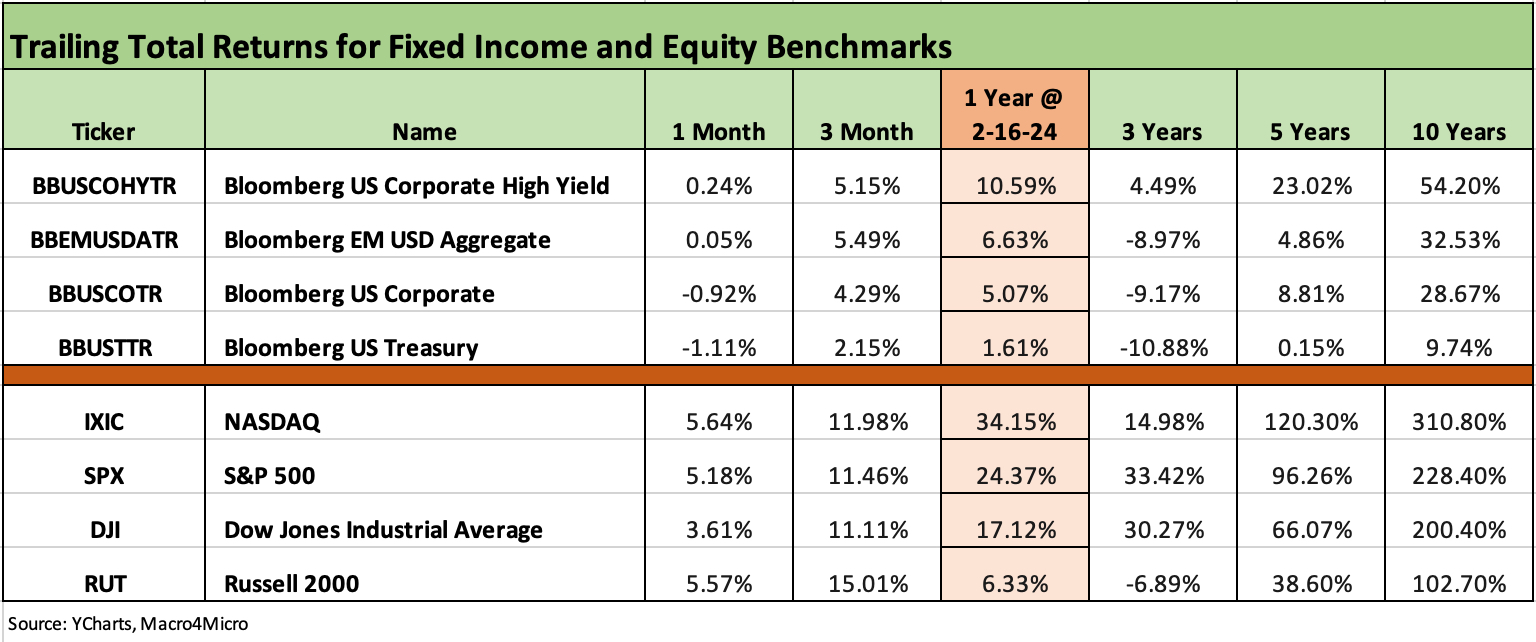
The above chart updates the running returns for the main debt and equity benchmarks that we track each week. As noted in the links at the bottom of this commentary, it was a very busy week for economic releases and how the market reflected its view in the upward move in the UST curve. Shaky CPI and PPI numbers carried the consensus. We get some FOMC minutes this week, but the next big set of numbers will be with PCE inflation the week after.
There continues to be a material upward move in the UST curve YTD and another move this week. We cover that in our separate Footnotes publication on yields that we will publish later today. The +16 bps move in the 2Y UST on the week and +13 bps move higher in the 10Y UST has driven a partial retracing from Oct 2023 but still well inside 4Q23 peak levels.
We see the duration effect clearly over the past month with UST and IG Corporate benchmarks in the red and HY and the AGG barely positive. Looking back across the trailing 1-year, we see HY delivered returns slightly better than the long-term nominal return on equities, and no one can complain about that.
Meanwhile, the IG Corporate index is still sitting with tight historical spreads while posting a return profile that will be heavily wagged by the UST curve from week to week and month to month. The UST has not been a friend of duration YTD.
We also see more balance for the past month across the large cap and small cap benchmarks with the Dow and S&P 500 still dancing around all-time highs across trading days and the Russell 2000 small caps starting to regroup with another good week (not as good as last week) after initially lagging in the midst of new fears around a “lack of breadth” in the equity markets rally.
Small caps posted a dazzling rally to wind down 2023 with a 12% handle month in Dec 2023 as we covered at the time (see Footnotes & Flashbacks: Asset Returns 1-1-24).
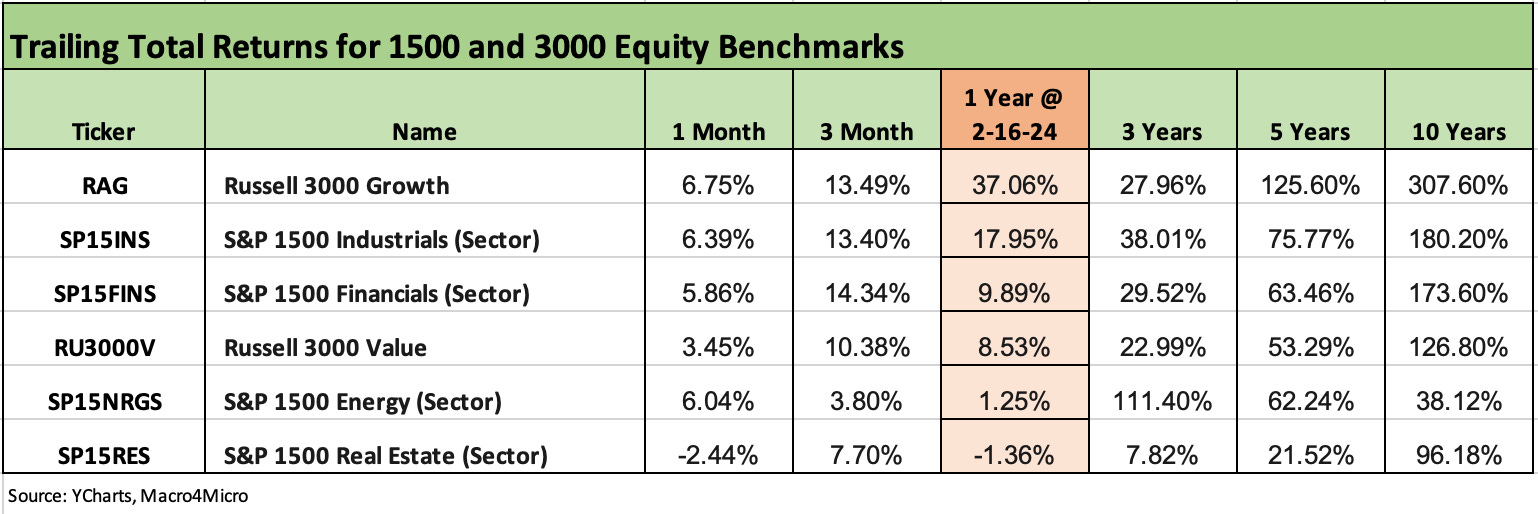
The above chart updates the 1500 and 3000 series with Real Estate back in the tank after a very strong late 2023 rally. Looking back a year, real estate remains in the red zone with Energy barely positive after the Ukraine-Russia War sent the energy sector soaring. That helped drive a heavy base of investment in new projects (notably LNG). Supply and demand for oil and gas still took over with many major setbacks and disruptions at the regional level (notably Europe) that included the need to change sources of supply. In the end, Russia got a lot of its oil to market (just as Iran does) and the US ran oil production and natural gas production to record levels.
There is not much mystery in the numbers as to the winners over the 1-month and 3-month time horizons with Growth and Industrials strong and Financials building in a bullish forecast for the direction of the UST curve. That UST curve question gets addressed in our separate weekly Footnotes publication in the State of Yields. The most bullish forecasts to start the year have hit some serious headwinds so far.
We could argue that the performance in Financials is building in more good news on asset quality and interest margins than might end up playing out through mid-2024. We saw a nice bounce for Regional Banks (KRE) this past week and a positive move by Financials (XLF). KRE had some setbacks for the trailing month as it is back in the red for returns after a very strong finish to 2023 and a respectable earnings season. The NYCB headlines and ghost of Signature Bank got the market refocused on commercial real estate risk again (see Footnotes & Flashbacks: Asset Returns 2-4-24). That has caused some equity market turmoil.
The rolling return visual
In the next section we get into the details of the 31 ETFs and benchmarks for trailing periods. The collection of four charts below looks a lot like some recent Footnotes publications since we still see a bias toward the positive side. This past week evened up the results somewhat with the positive vs. negative score for the week narrowing to 16 positive and 15 negative. That continues the slightly adverse shift from a positive score including 18-13 last week after running up a very favorable score of 21-10 and 26-5 over the prior two weeks before that.
The string of positive weeks feeds into a very favorable 22-9 over the trailing 1-month. The 9 ETFs in the red for the 1-month period are heavily wagged by interest rates as we discuss below in the ETF review section. We see 5 of the 9 from the fixed income ETF subsector as well as some equity-based ETFs highly influenced by the UST curve and real estate asset quality. The Base Metals ETF (DBB) is arguably more about global demand from the industrial production side of the ledger and especially the dark clouds over the economy in China.
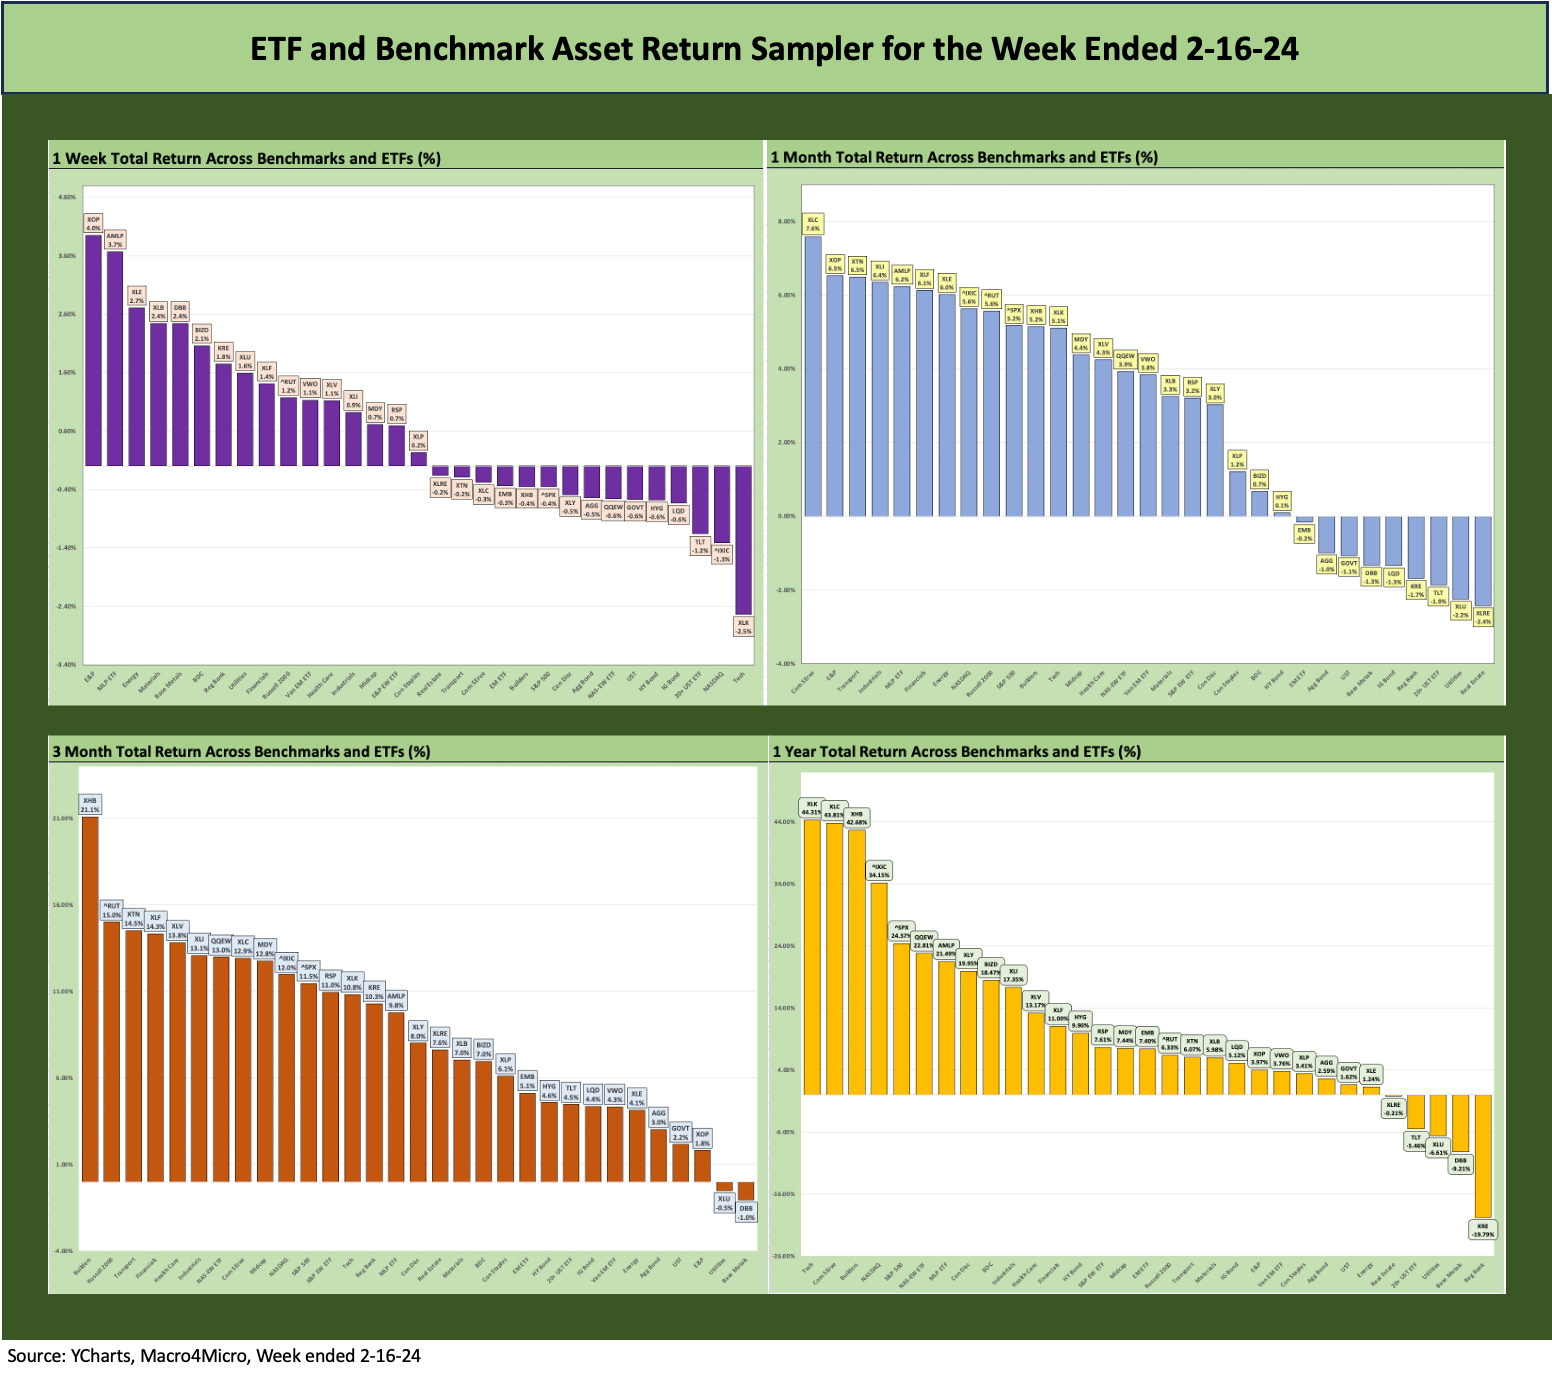
The overall profile of returns across the 4 time periods are captured in the chart. The obvious visual is a positive mix looking back from 1-week to 1-year. The 3-month period is an especially positive visual since it has held steady at 29-2 since the end of 2023 but with a slightly shifting mix in the negative zone. The 3-month return profile is supported by the banner performance of Nov-Dec 2023 when so many ETFs and a few benchmarks put up a year’s worth of positive returns in just 2 months.
The aggressive Fed tightening year and inflation and curve shock of 2022 did a lot of damage, but the trailing 1-year numbers reflect the strength of declining inflation and a consumer sector that just would not pull back and certainly would not lie down and resist the desire to spend (and for many borrow to do so). The consumer sector answered the bell during the rate spike and hiring and payroll count numbers got the job done (even if structural unemployment is a recurring problem).
It is hard to see how that consumer strength is sustainable, but it has to do more than pause to shake the market faith at this point. PCE would need to contract, and jobs would need to decline. More jobs means more paychecks, even if the paychecks are too low.
In addition, many industries demonstrated their resilience in 2023 even after all the supplier chain stress and cyclical uncertainty in decision-making around investment and hiring. The 4Q23 earnings season has been adequate to tamp down recession worries even if the new rate environment has slowed progress.
The Magnificent 7 heavy ETFs…
Some benchmarks face issuer concentration elements that leave them wagged by a few names. When looking across some of the bellwether industry/subsector ETFs, it is good to keep in mind which narrow ETFs (vs. broad market benchmarks) get wagged more by the “Magnificent 7” including Consumer Discretionary (XLY) with Amazon and Tesla, Tech (XLK) with Microsoft, Apple, and NVIDIA, and Communications Services (XLC) with Alphabet and Meta.
For this past week, we saw the Tech ETF (XLK) take a beating and hold down last place in the group of 31 ETFs and benchmarks as Microsoft (MSFT) and Apple (AAPL) turned up negative. NVIDIA reports this week, so the market gets a fresh read on the MAG 7 performance. The NASDAQ also came up negative on the week just ahead of XLK on the bottom of the 1-week rankings as detailed below. We also saw the Consumer Discretionary ETF (XLY) and Communications Services (XLC) slightly in the red this past week.
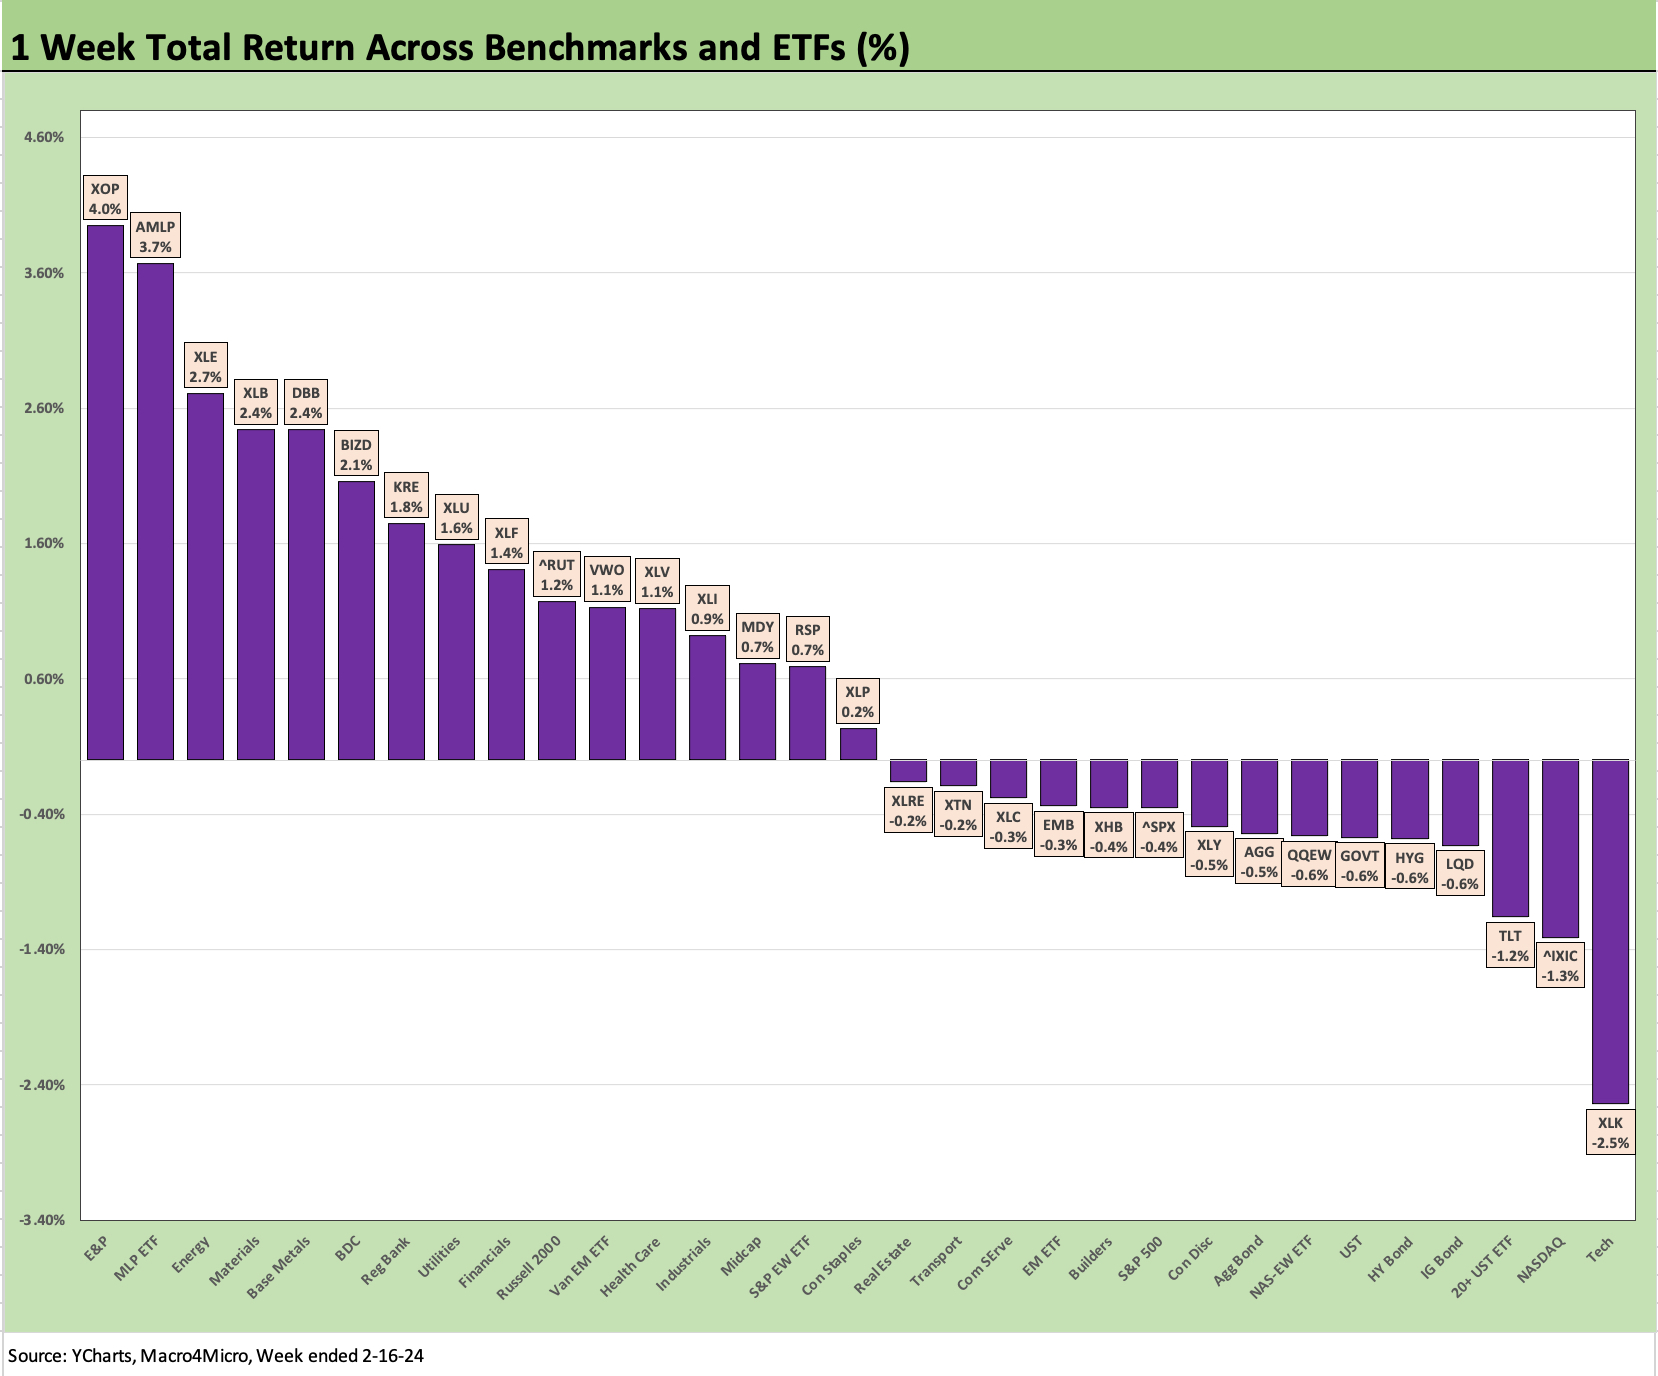
As noted earlier, the 1-week ETF and benchmark return mix was 16-15 the past week, which is at least still positive and better than two ugly weeks experienced in the first and third week of Jan 2024. As noted earlier, the Tech ETF (XLK) and NASDAQ weighed in negative with the long duration UST 20+ Year ETF (TLT) 3rd from the bottom on the duration hit.
All 6 fixed income ETFs were in the red with the longer duration IG index (LQD) and HY index (HYG) clustered in a tight group with GOVT and AGG on the negative side of the divide with EM Sovereign (EMB) a couple of ticks higher in the red zone.
Energy ETFs turned up as the winners with E&P (XOP), Midstream (AMLP), and Energy (XLE) holding down the top 3 slots. On a positive note, we see small caps (RUT), Midcaps (MDY) and the Equal Weighted S&P 500 (RSP) in positive range even though Tech centric ETFs had a tough week.
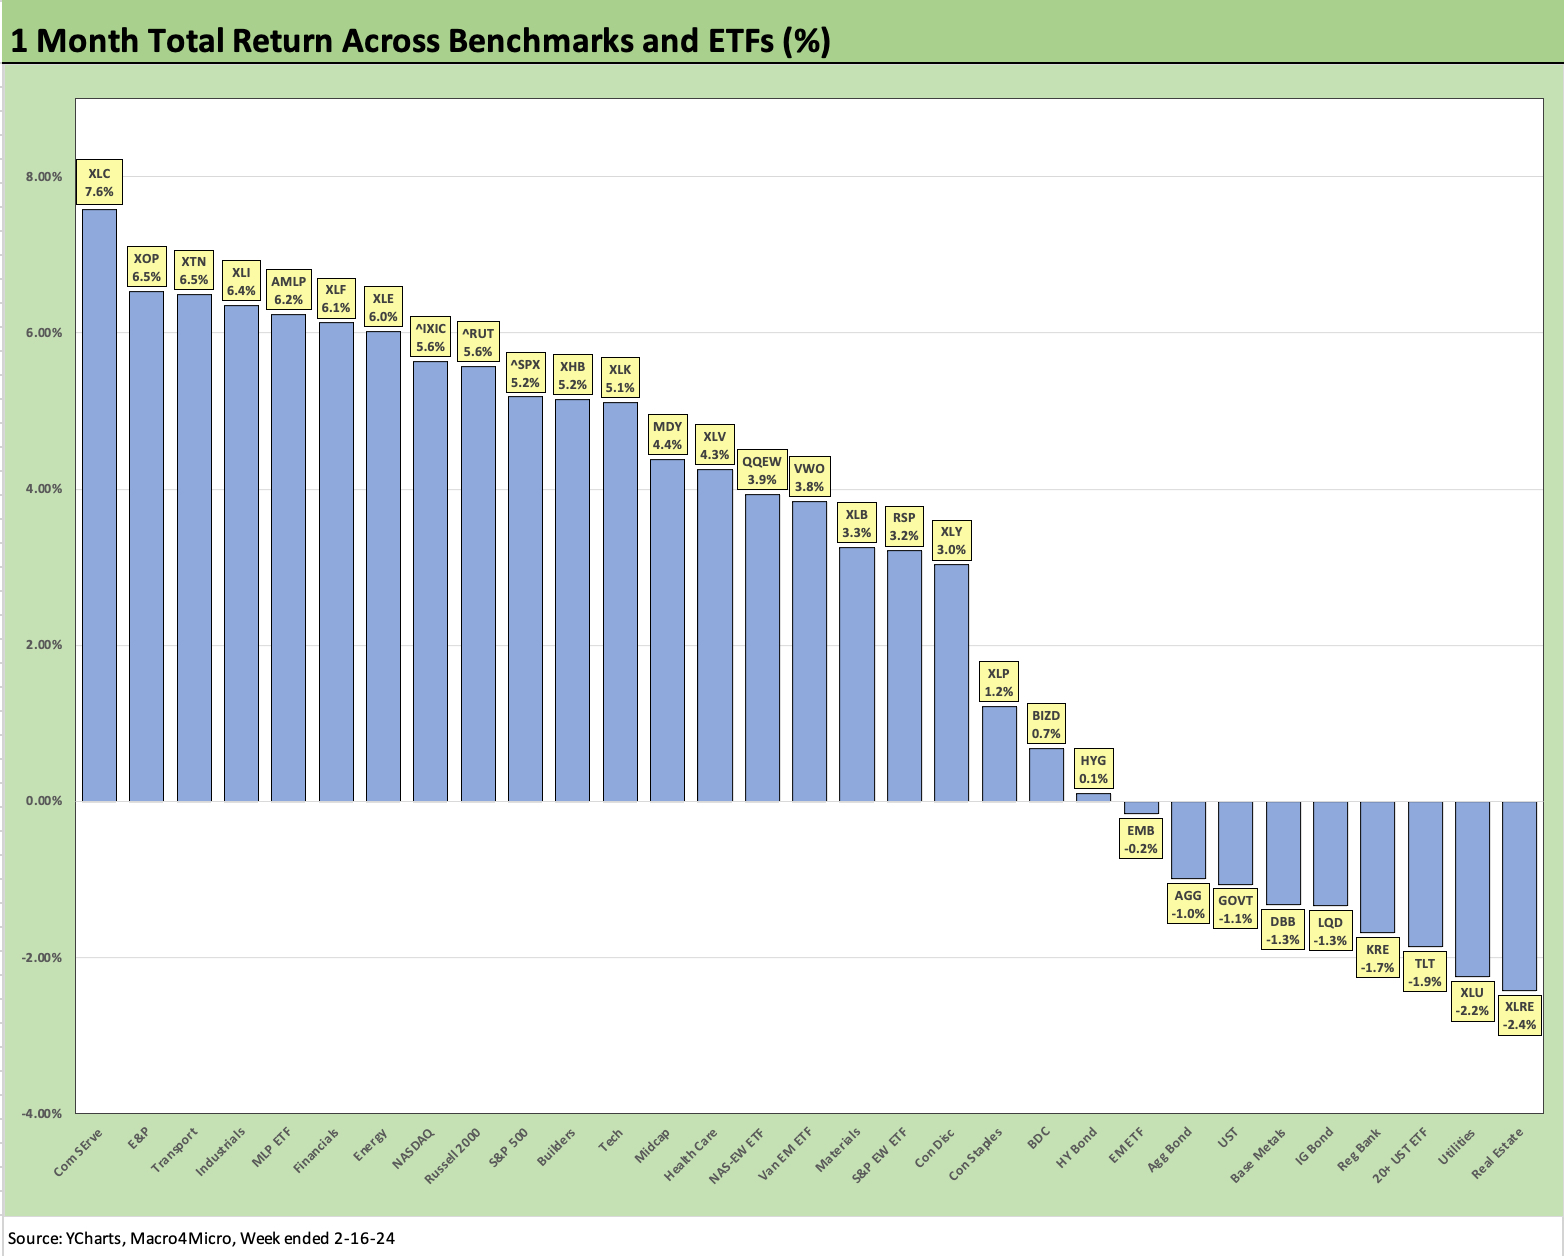
The above chart shows the running 1-month returns at 19-12 positive with interest rates and the UST curve as the main drag in the negative mix. We see 5 of 6 fixed income ETFs in the red with HYG just edging across the line into positive range. As usual, Utilities (XLU) felt the UST curve while Regional Banks (KRE) stumbled in recent weeks on the NYCB noise and a brief Signature Bank and regional crisis memory wave that flowed into the Real Estate ETF (XLRE). XLRE dropped to last place again.
In the upper tier for the month, earnings season was on average balanced for the Tech and Mag 7 exposures despite some setbacks with Communications Services (XLC) at the top of the 1-month leaderboard. We see XLC and NASDAQ in the top quartile for the month, the Tech ETF (XLK) in the second quartile, and the Consumer Discretionary ETF (XLY) residing in the third quartile.
The always-volatile E&P ETF is back on the upswing as Oil (WTI) wrapped Friday above $79 per bbl after being in the $72 area two weeks ago. Midstream (AMLP) and Energy (XLE) both moved into the top quartile for the 1-month period. The month shows some balance across the winners with Transport (XTN) and Industrials (XLI) in the top quartile and the small caps (RUT) just below the top quartile line. We see 12 of the lines over +5% and 19 above +3% for the month. That is a solid run.
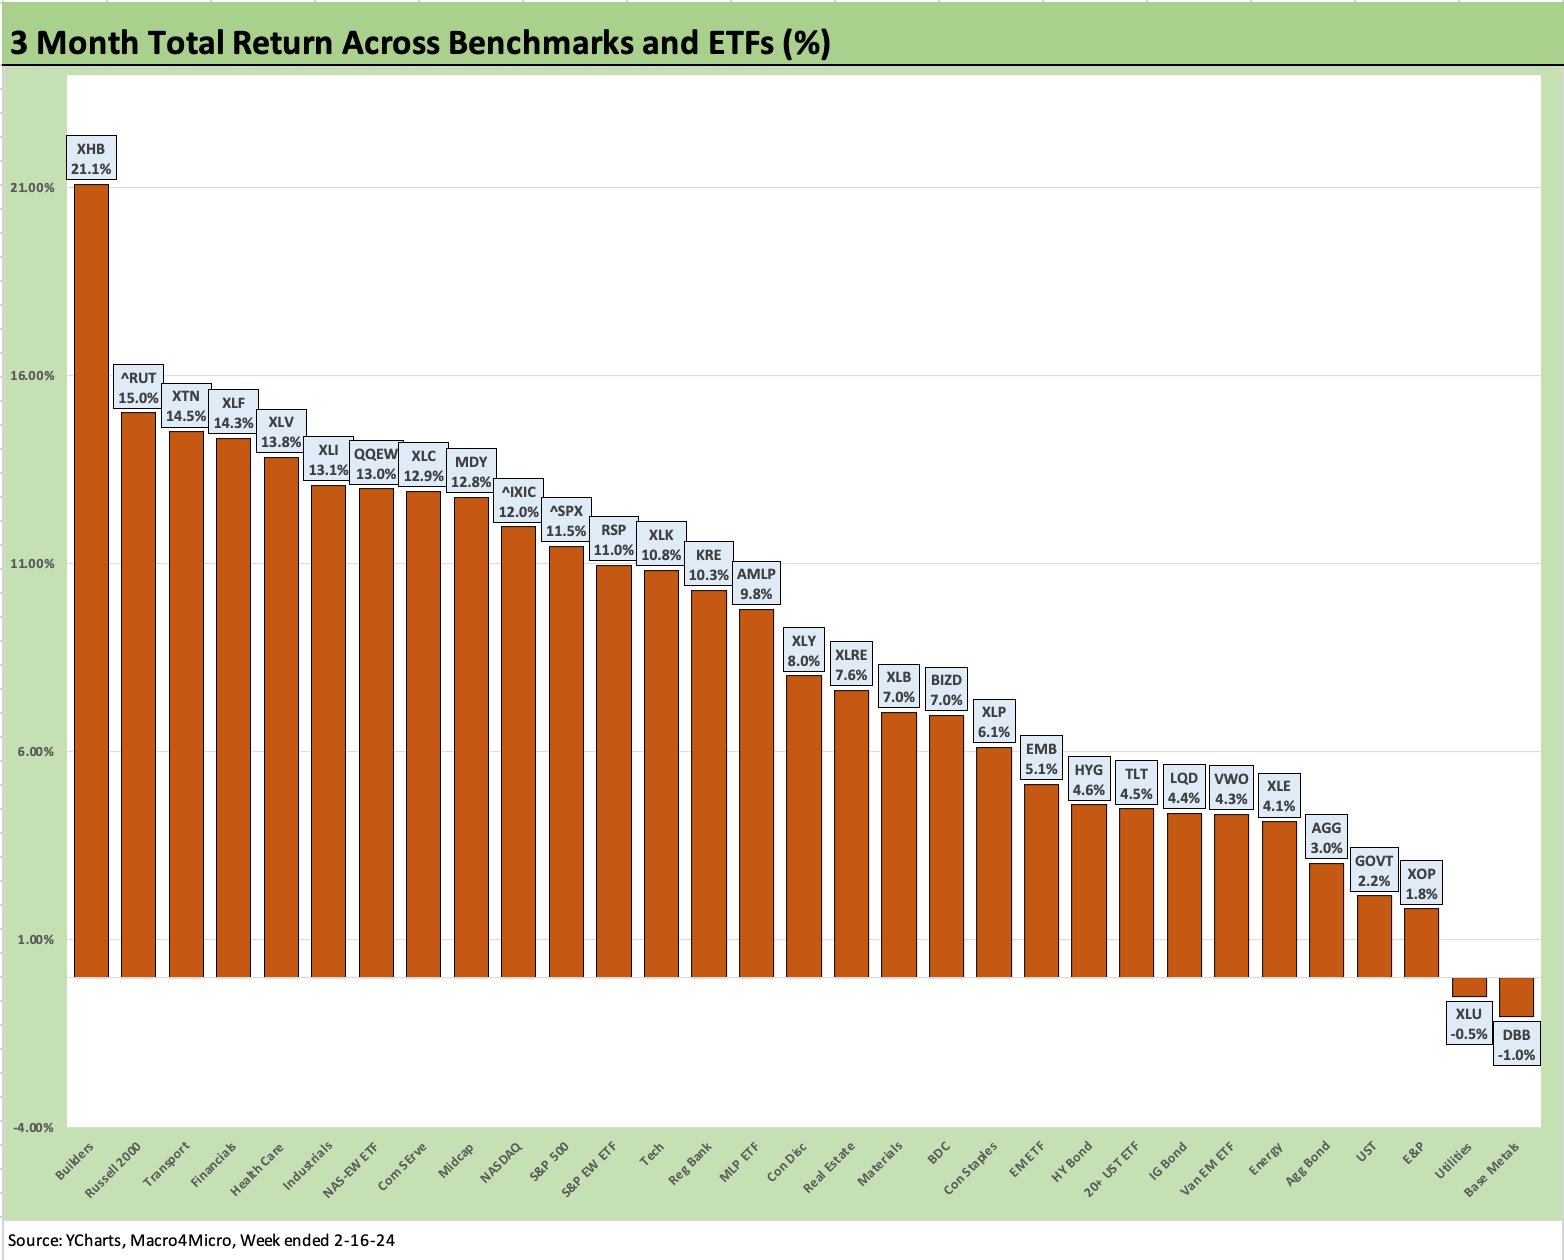
The 3-month time horizon continues to hold down the best weighting of positive total returns at 29-2 and only the Utilities ETF (XLU) and Base Metals (DBB) with slightly negative returns. We see 14 line items in double-digit returns running from +10.3% to +21.1% with the Homebuilder ETF (XHB) leading the way. We see 21 of the 31 at +5% or better for 3 months.
More than half the bottom 11 names are fixed income with all 6 fixed income ETFs in that underperforming group on the curve move. Another 2 are tied to energy on the oil weakness across that period with XOP and XLE in the bottom of the mix. Base Metals (DBB) is at the bottom with Utilities (XLU) just above it. There is little in the bottom ranks that lacks an easy explanation.
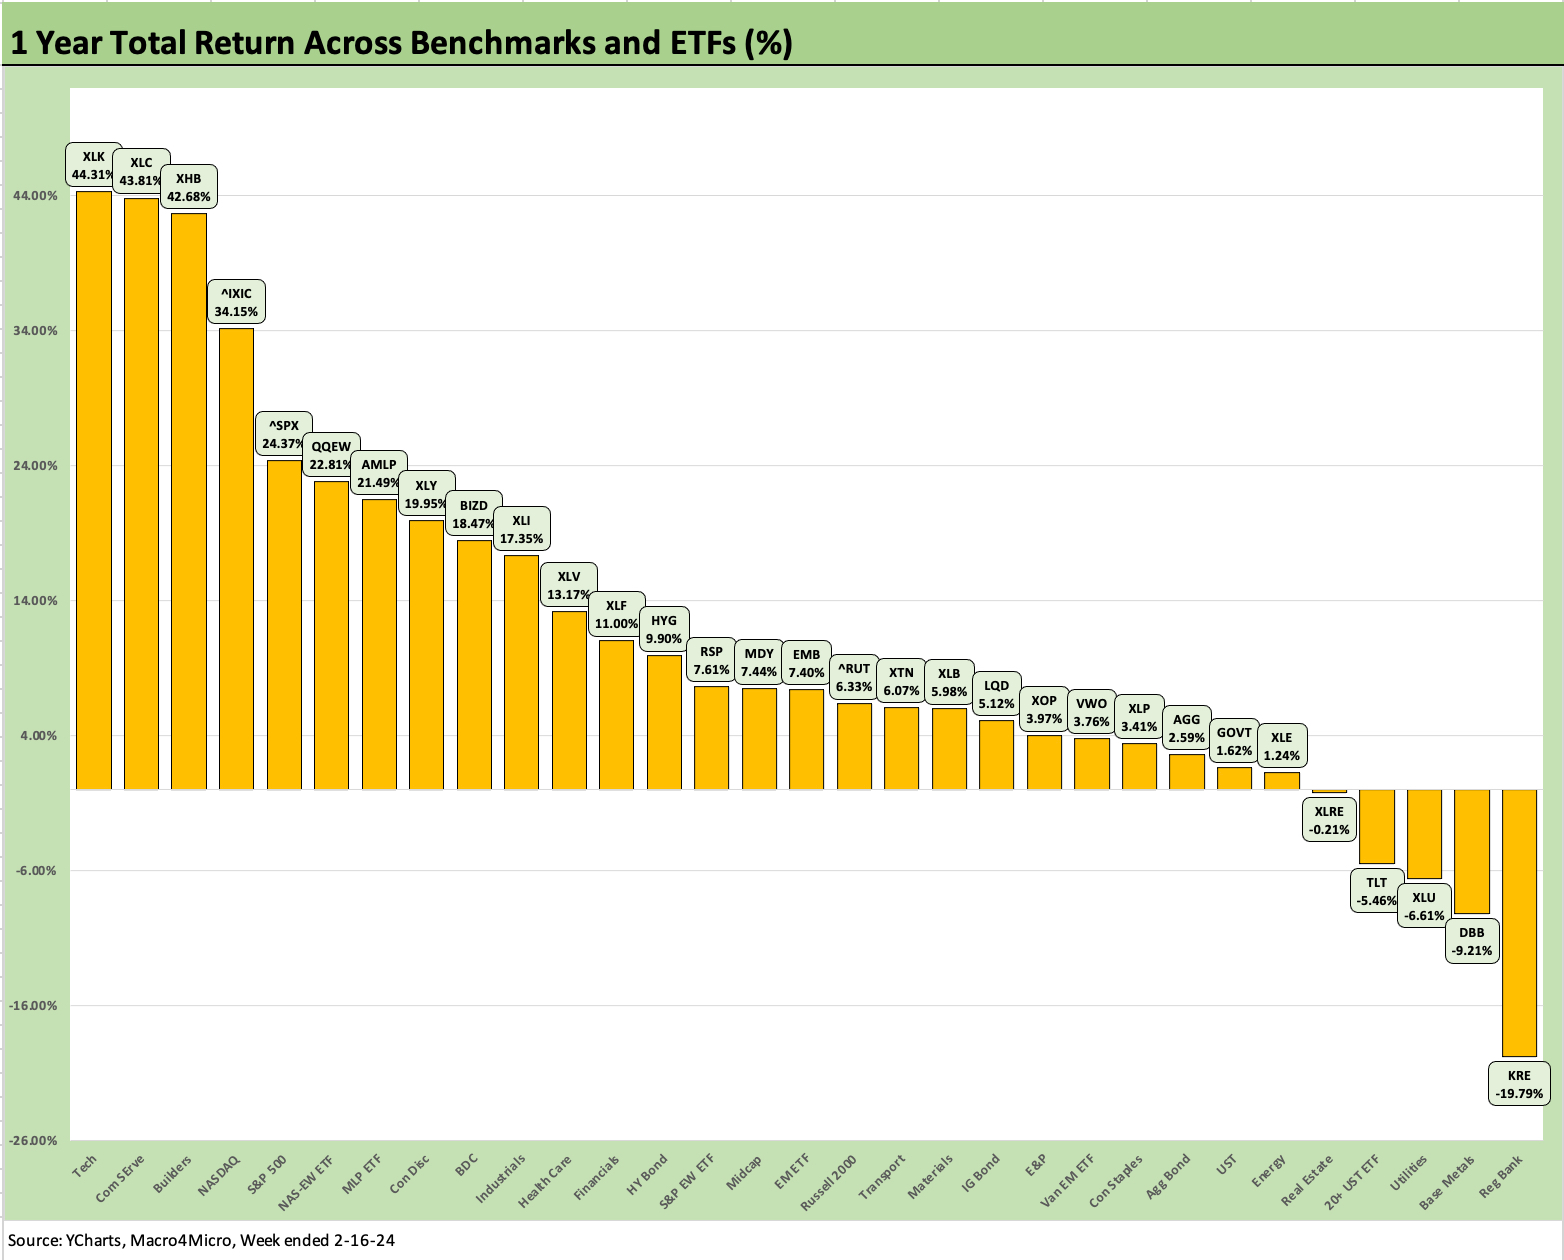
The 1-year time horizon stands at 26-5 at this point. The mix will take some time to realign, but Regional Banks (KRE) is still mired in the bottom since the March 2023 crisis is still a stain on the sector. Real estate concerns are not going away any time soon even if they ebb and flow in the headlines. Deposit funding costs and the interest margin squeeze is linked to the fed funds pressure along with expectations for risk premiums for those tagged with high real estate exposure (and especially office properties and rent-controlled multifamily).
The return mix overall for this past week and running periods still tells a good story overall for the economy and is backstopped by the sentiment support coming out of the main earnings reporting bellwethers and related guidance. There are shortfalls in manufacturing but also a heavy dose of constructive reports and capex planning as well. The barrage of consumer-oriented news the past few weeks has been mixed and some signs of PCE outlays are showing up. We get a fresh look at PCE by month end and the batch of inflation data points that come with it.
See also:
Housing Starts Jan 2024; Slow…Curve Ahead? 2-16-24
Industrial Production: Capacity Utilization Limps Along 2-15-24
Retail Sales Jan 2024: Balancing Act Continues 2-15-24
Jan 2024 CPI: The Big 5, Add-ons, and Favorite “CPI-ex” Indexes 2-13-24
Trade Flows 2023: Trade Partners, Imports/Exports, and Deficits in a Troubled World 2-10-24
Fed Funds vs. PCE Inflation: Peaks and Valleys Across Time 2-7-23
Payroll Jan 2024: Big Swing 2-2-24
Productivity: Takes the Edge off the 4% Handle YoY ECI 2-1-24