
Footnotes & Flashbacks: Credit Markets 5-27-25
UST and tariff nerves sent HY spreads wider as IG spreads remained unchanged this week. EU tariff de-escalation on Sunday offers another round of reprieve in a self-inflicted trade war.


Tariff them, tariff them not…
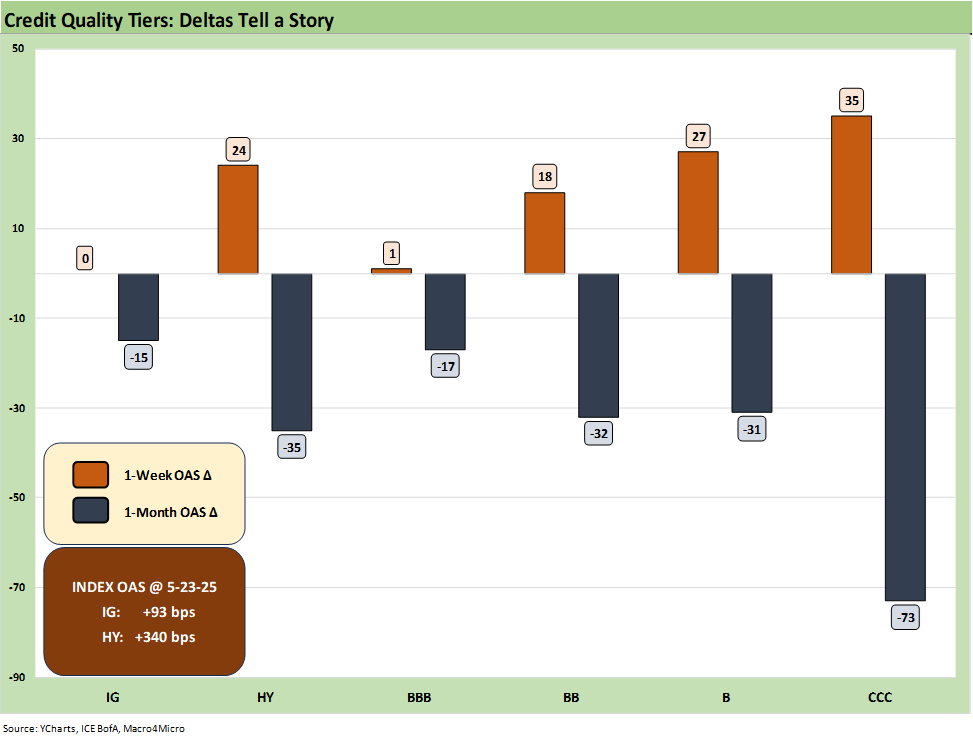
HY and IG spreads diverged the past week, with HY widening +24 bps with quality spread widening down the quality curve, but IG remained flat.
Another Trump mega-tariff pause on the weekend postpones the proposed 50% EU tariff to July 9th in what is becoming the typical flow of threatening over-the-top tariffs followed by “something else.” So far, the pause has not finished “something else” with any major trade partners other than one semi-framework with the UK, where the US has a trade surplus.
The pause did lead to a relief rally today that drove the S&P 500 over 2% higher in what is becoming a habit. Barrons has even given it a name - the “TACO trade” (Trump Always Chickens Out). He is not going to like that and it might backfire!
A potential trade war with the EU as the #1 US trade partner still lurks for the summer with multiple major trade partner deals still stalled (Japan, South Korea), the USMCA in turmoil, and the China truce still a risk factor that needs to be addressed.
IG spreads did not move much and remain comfortably in double digits. For the UST, the bear steepener this week included the 30Y moving north of 5.0%, driving IG total returns in the same ball park as US HY for the week. The 30Y UST opens the holiday-shortened week back inside the 5% line with PCE inflation due this week along with the 2nd estimate of 1Q25 GDP.
This morning’s Durables report was weak, but it is too early for a clear read on the tariff capex influence as the inventory “destocking and restocking” distortions and pre-tariff activity across various industries will make the summer a cleaner read on the tariff fallout.
The spread rally took a pause this week with a reminder that trade tensions and budget deficit uncertainty are still on the table. US HY widened by +24 bps and US IG remained flat after the week. Spreads were on the path to retrace much of the post-Liberation Day widening with May a positive month after so much trade chaos.
The 1-month trailing results still show much of the retracement from those wides, but this week was a reminder that trade policy is still not sorted out by any stretch with many major unresolved deals and temporary pauses still in play. The Sunday news that EU tariffs will be paused until July 9th is cause for another “will he or won’t he” celebration today. That is based on the avoidance of immediate economic damage and renewed trade tensions with our #1 trade partner. The path is still facing
The fact that risky asset markets are supposed to be forward-looking creates problems with such erratic policy approaches. One man’s game theory is another man’s inability to handicap economics. That will plague decision making in the corporate sector for pricing products, capacity planning, hiring/firing, supplier chain decisions, contractual terms, and a wide range of self-inflicted growth damage. As Trump pauses, so can consumers and the corporate sector. Importantly for markets, the FOMC can also pause.
The cause-and-effect will be clear to most, but deflection and distraction has become a cornerstone modus operandi in the Trump tariff strategy pitch (that includes the infamous “seller pays” lies). This past week had demands to not raise prices and for companies to “eat tariffs” (why “eat” if the seller pays?), but then in a live press conference Trump claimed he collected $600billion from selling countries in Trump 1.0. That is ok in politics but bad in capital budgeting and household decision-making. It does not inspire confidence in the coherence of economic policy quality.
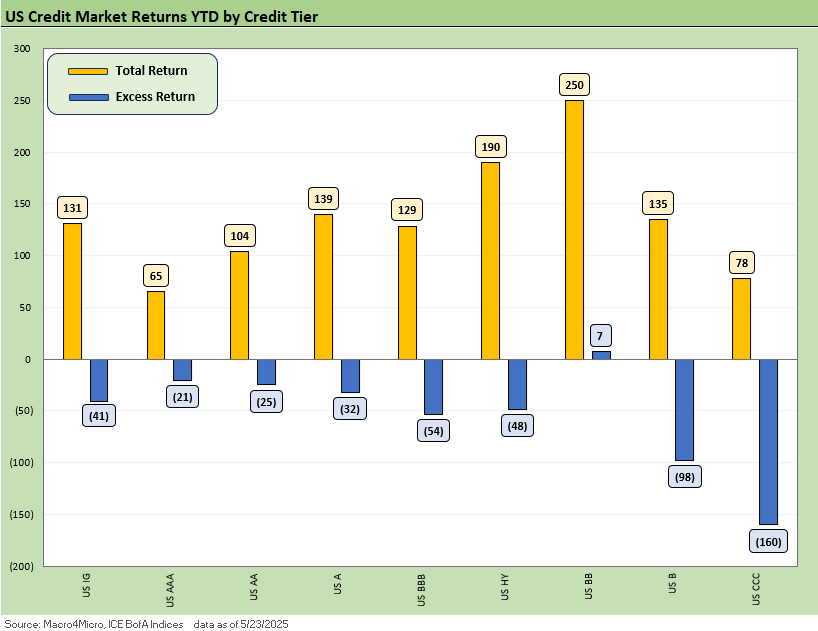
The above chart shows total and excess returns for the year across IG, HY, and the ratings tiers. Excess returns are hovering in the negative with the exception of BBs after a volatile start to the year but the total return picture is still positive given the UST rally from 2Y to 10Y in 2025. Annualizing those returns is depressing even for the positive total returns. There is “a lot of year left” along with no shortages of tariff and US budget uncertainty. Global turmoil can also rear up as we got a taste of this week with Japan long bonds.
This week saw US HY spread widening lead returns down across excess and total returns while the UST move saw US IG total returns decrease as excess returns stayed in place. After such a high volatility period in the past two months, BBs have been a brighter spot across credit so far given the high-quality names vs. HY and lower duration risk vs. BBB Industrials across the credit tier. The crossover BBB and BB buyers have had their hands full with the combination of duration swings in BBBs and OAS swings in BBs.
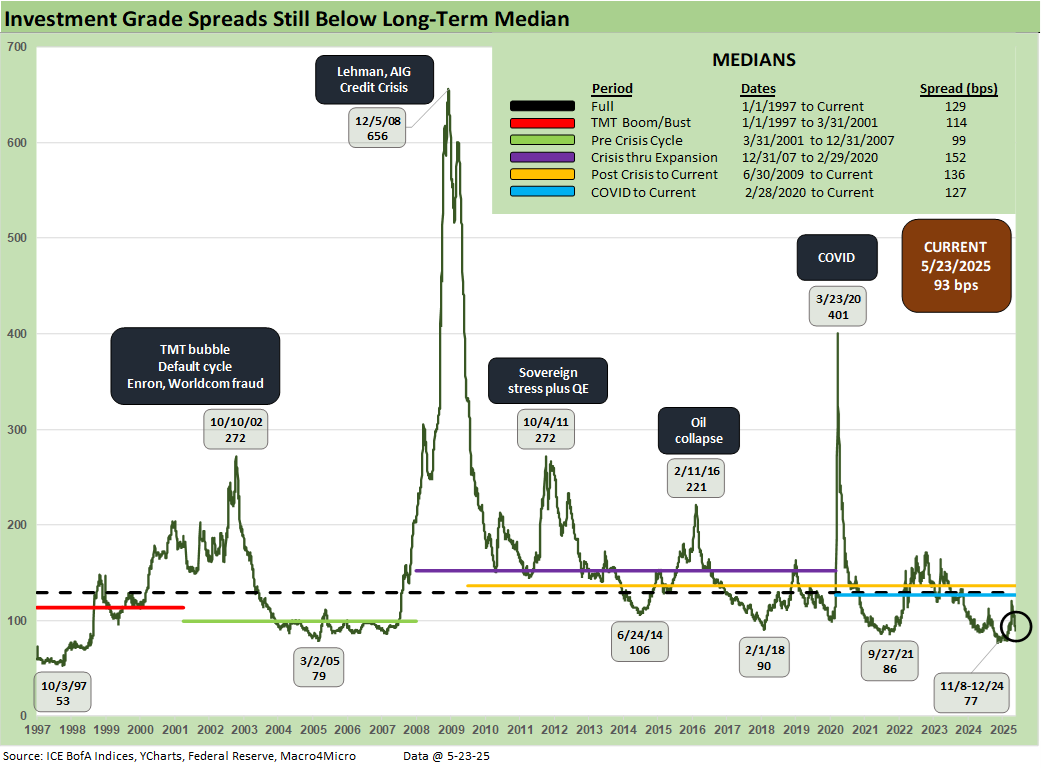
IG spreads ended the week flat and still in double-digit territory at +93 bps, remaining near prior cycle lows as the US IG market has reacted less to the erratic trade policy news flow. Spreads overall remain comfortably below the longer-term medians, but this is an IG OAS level that will be a challenge to sustain as we look back across time with stagflation risk heightened.
After rallying the last month, the risk symmetry skews again towards widening with outstanding deals to be made with all our top trade partners. An EU tariff pause this weekend is another sigh of relief on the self-inflicted trade tensions but a lot must continue to go right in trade given how much retracement there has been since Liberation Day.
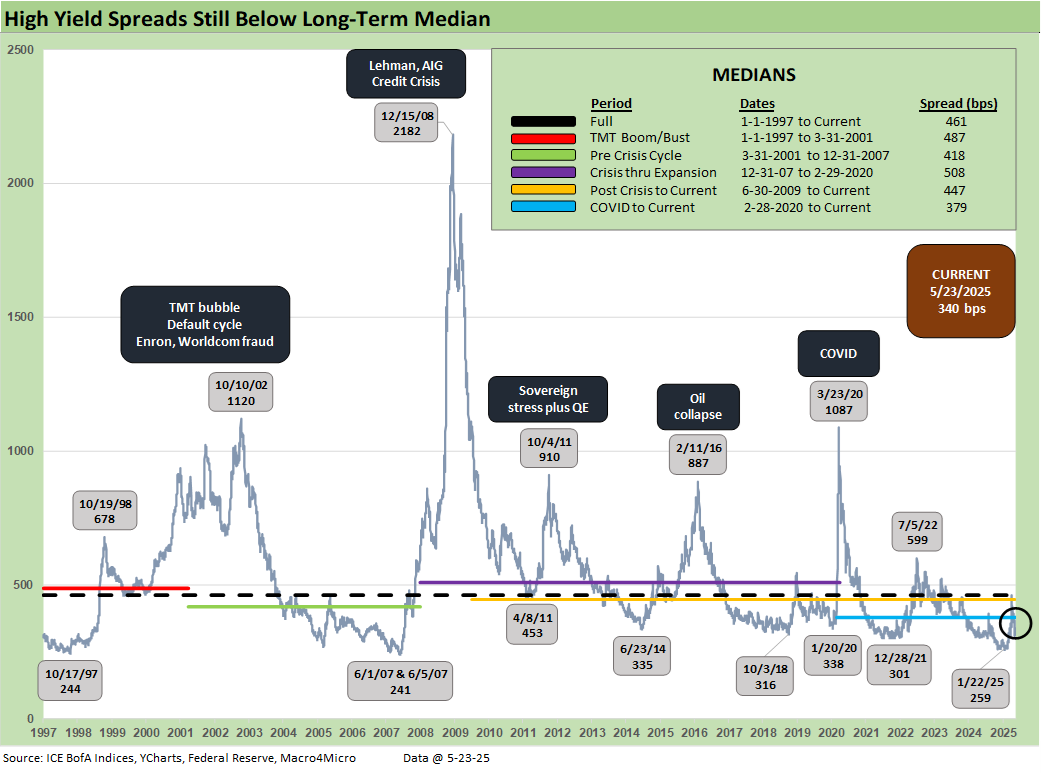
The week saw +24 bps in spread widening in HY to +340 bps as trade nerves were reignited. This pause comes after consecutive rally weeks that brought HY spreads back towards 2018 cyclical lows and with renewed vulnerability given the outstanding trade issues.
With a higher-quality index now vs. past cycles, the recent history includes a stretch below the 300 bps mark with the recent January low of +259 bps very close to the June 2007 lows. Like US IG spreads, we struggle to see the resolution of trade issues without further hiccups and US HY spreads remain vulnerable to more volatility even if they continue to grind tighter until the headlines come. An EU pause was necessary to ease pain before the retaliatory headlines restarted the scenario spinning machine, but we still await details on deals with key partners (Mexico, Canada, Japan, S. Korea) before the pause timer is up.
At its core, the Trump trade policy is not about reciprocal tariffs even if Team Trump will not admit as much. It is about trying to eliminate a trade deficit on dubious economic “theories” (backed up by a few B and C team economists) while also maximizing a tariff border tax revenue stream on domestic importers. Again, those descriptions will be disavowed by Team Trump (a rose if still a rose, thorn is still a thorn, and BS is still BS etc.). The GOP called a variation of such a plan a “border tax” back in 2017 (they wanted to eliminate corporate taxes), but the facts remain: buyer/importer pays customs.
From that border transaction fact on who pays the tax at the border, it then becomes an economic analysis good fight in gauging who in the end bears the cost. Trump’s threats against companies such as Mattel and Walmart would create accusations of state seizure of domestic property and radical leftist Marxism if a Democrat was engaged in such coercion. The terms “MAGA Maoism” has been making the rounds lately. Anyone who was force-fed Mao’s Little Red Book” in a history class might agree (same for that bearded guy’s Manifesto).
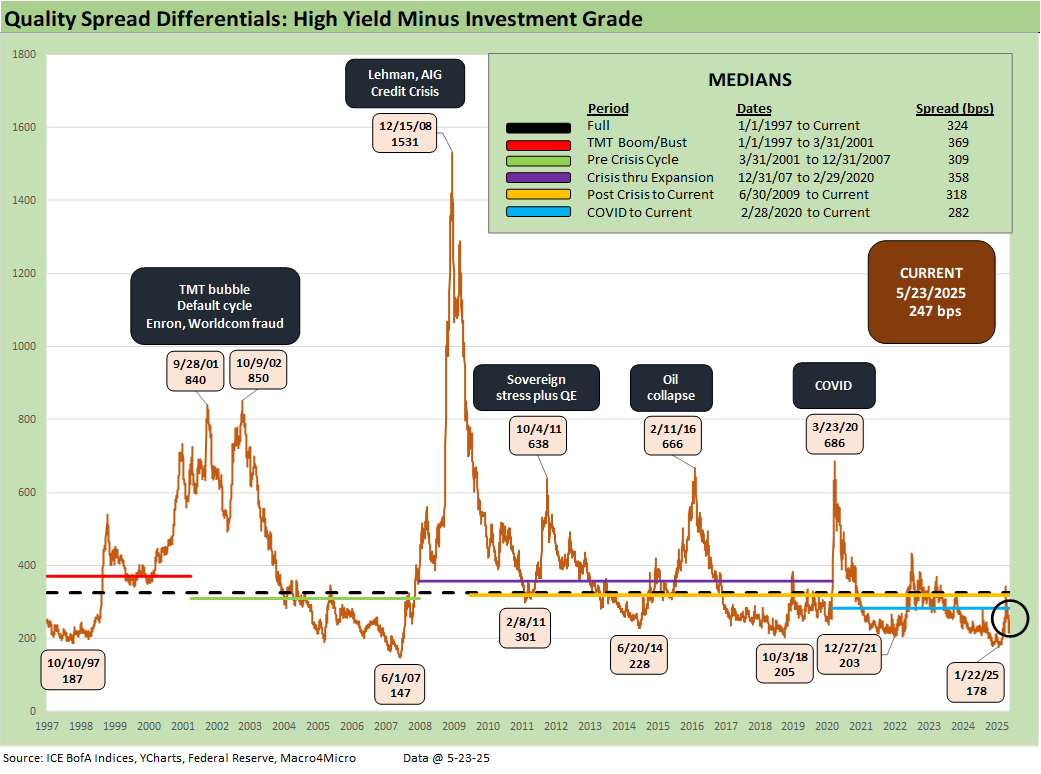
The differential between HY OAS and IG OAS (quality spreads) widened out +24 bps this week on the divergence between HY and IG. This level remains tight in historical context but the recent period sees these sharing a closer relationship given the IG quality shift towards BBB and HY quality skew towards BB. The increase this week remains inside the post-COVID median and is modestly above the 2014 low of +228 bps.
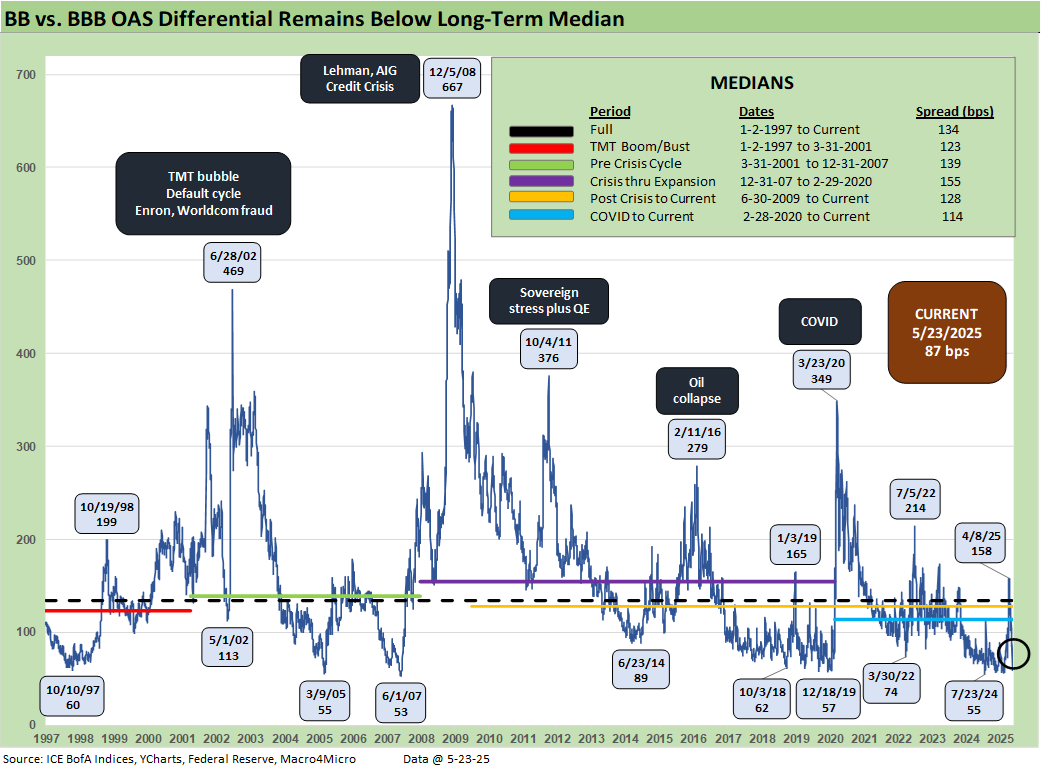
The “BB OAS minus BBB OAS” quality spread differential widened +17 bps this week as trade fears were reignited. The most recent move remains in double digits, but moving away from all-time low territory saw late last year. This metric has stayed lower in recent history given the convergence in credit quality of the tiers and the core investor base, but this week signaled a divergence between IG and HY investor bases.
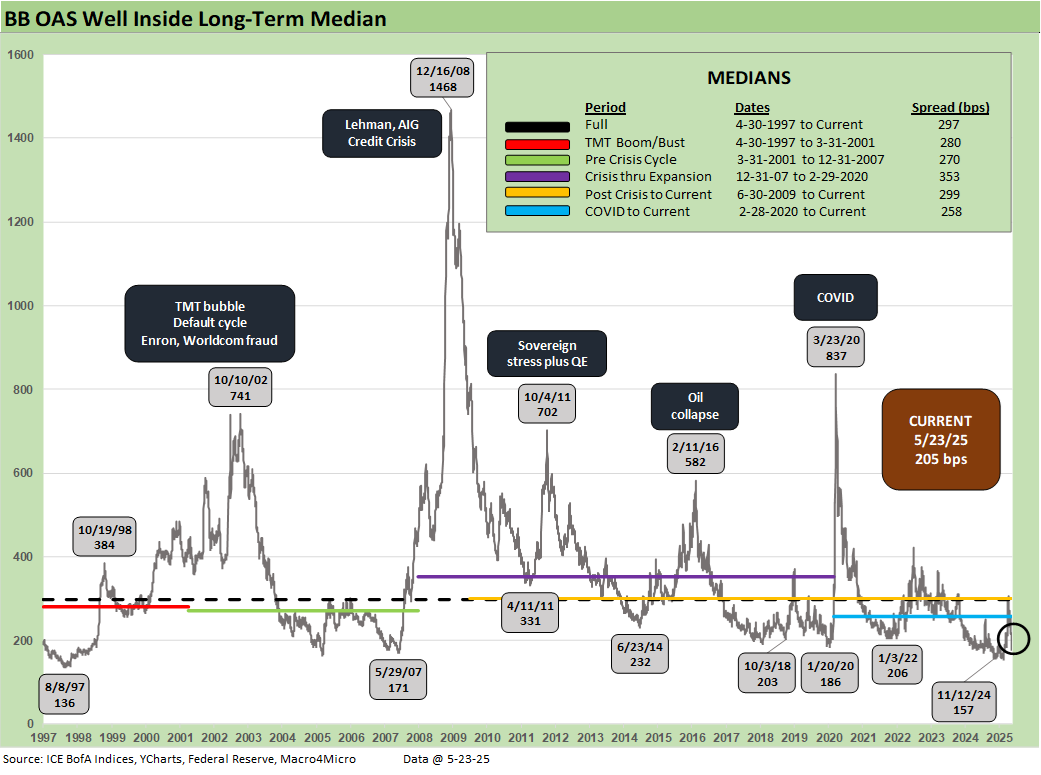
The BB tier widened +18 bps since last week to +205 bps and remains near the 2018 cyclical low and inside the 2014 cyclical low. Trade fears continue to see immediate reaction in tandem with the equity market and that remained this week. However, the BB tier is still the best performing tier this year on total and excess returns as far as the combination of higher quality and lower duration risk has paid off.
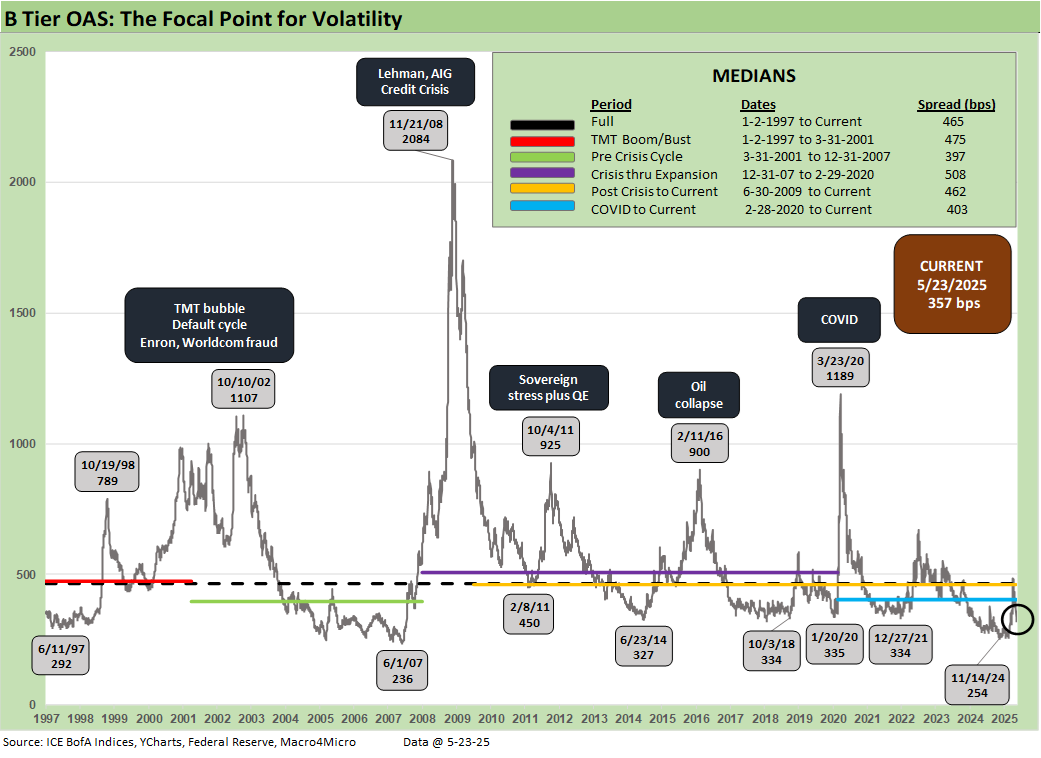
The B tier widened +27 bps this week out to +357 bps. The whipsaw this month saw spreads briefly above the long-term median at +486 bps, and even with a poor week spreads are still -127 bps tighter since. The renewed widening this week on EU news brought spreads away from the lows in 2014 and 2018 but remain well below the longer-term medians.
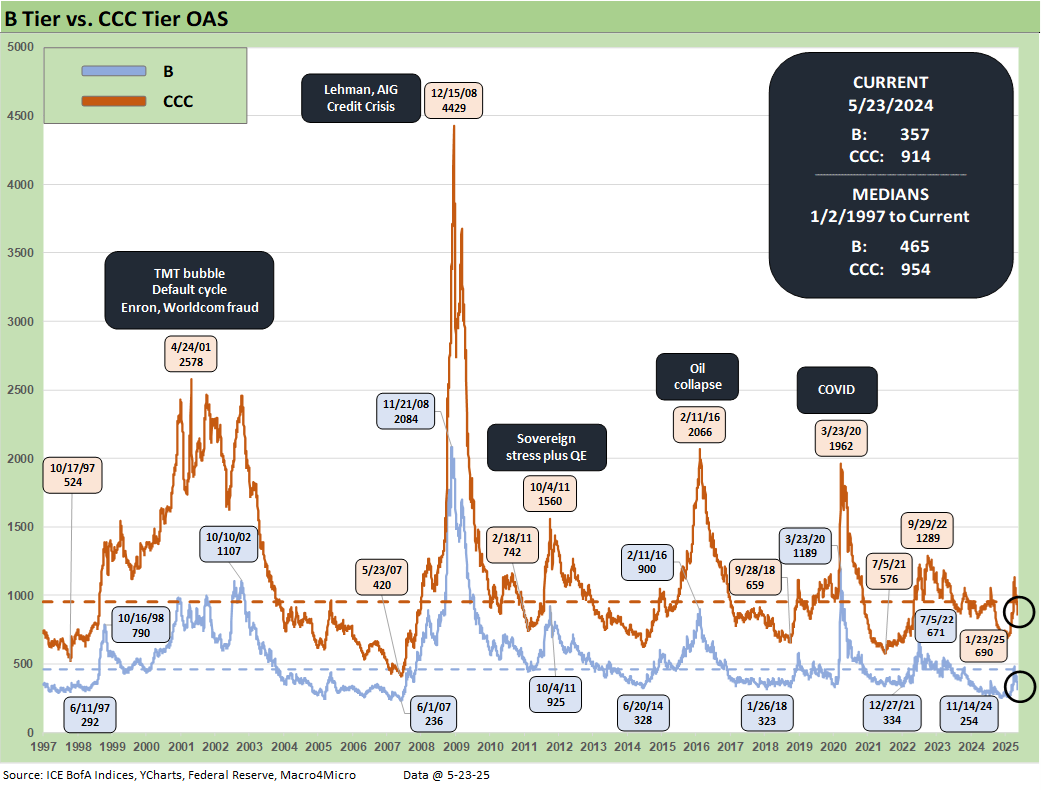
The B vs. CCC tier OAS time series is plotted above. The timeline for B and CCC spreads highlights the points of major divergence along the way (see The B vs. CCC Battle: Tough Neighborhood, Rough Players 7-7-24).
The current CCC tier OAS at +914 bps widened by +35 bps the past week though remained under the long-term median of +954 bps. The recent volatility was a brief reminder of the kind of B vs. CCC divergence that can happen in a hurry as markets reprice. Further tariff chaos still has the potential to repeat that volatility with recent US-China truce and EU tariffs flashpoints that are avoided for now.
The potential economic damage that could come in late 2Q25 or 3Q25 is still coming with the wide array of tariffs, but the scale of the China shutdown was more immediate and far more serious. A 50% EU tariff could have seen similar chaos for many industries but at least that is tabled for now and those hits to prices and expense lines are mitigated (for now).
We would argue that there is nothing quite like the China risk that was in evidence before the truce even if China is the #4 trade partner and EU #1. China problems like what we saw unfolding would bring devastation to many retailers and small businesses. That threat still lurks until a deal is struck and, even then, the problems for goods prices and company margins will be severe. The often-heard refrain that “we imported low inflation from China” as usual begs the question “What are you importing if you remove that?”
The CCC YTW is above the 13% line to 13.25% after being above 14% just last month, but the underlying constituents are widely dispersed across an 81.13 composite dollar price. The CCC tier is still in the pricing zone of equity risk-returns with such yields.
CCC investing at this point demands careful capital structure analysis and rigorous issuer-level relative value research. Subject to how the tariff policies play out and how the stagflation wildcard unfolds, the distressed players are warming up. Costs will still be rising even as pauses and deals start to roll in at some point.
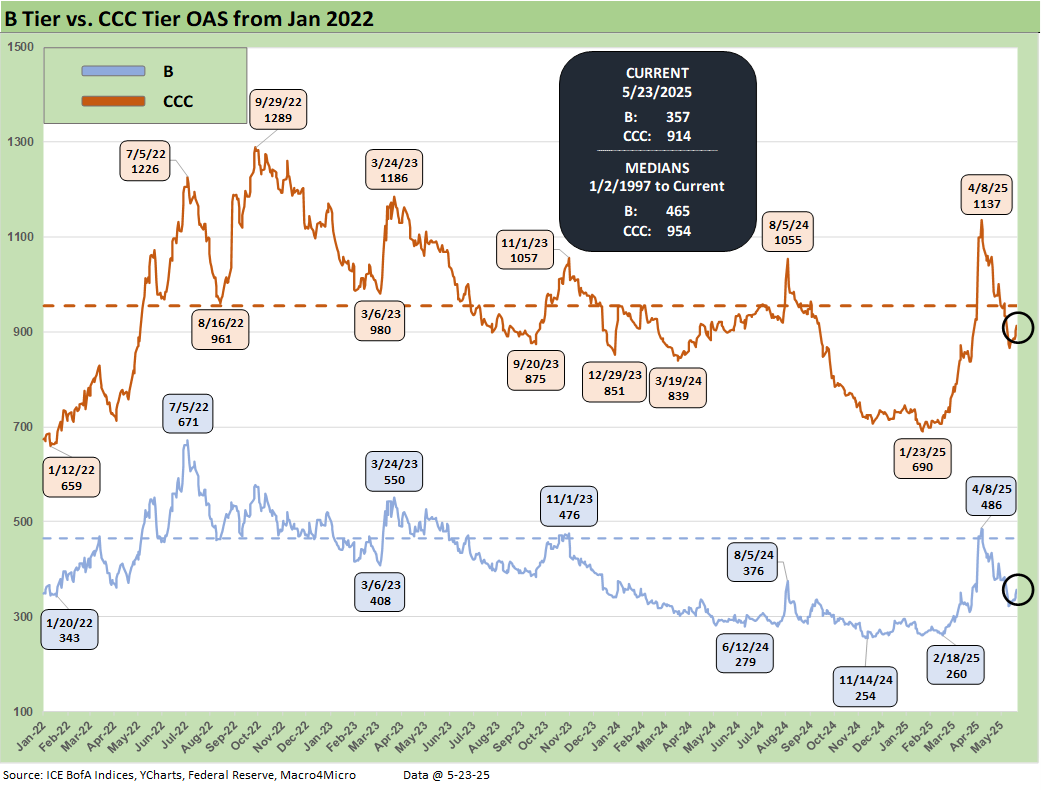
The shorter timeline from Jan 2022 just ahead of the end of ZIRP and start of the tightening cycle gives better granularity on the movements from a low for CCCs of +659 bps in Jan 2022 to a peak of +1226 bps in July 2022 and +1289 bps to end Sept 2022. Then spreads came down to the Jan 2025 tights of +690 bps ahead of the recent spike and whipsaw to current levels.
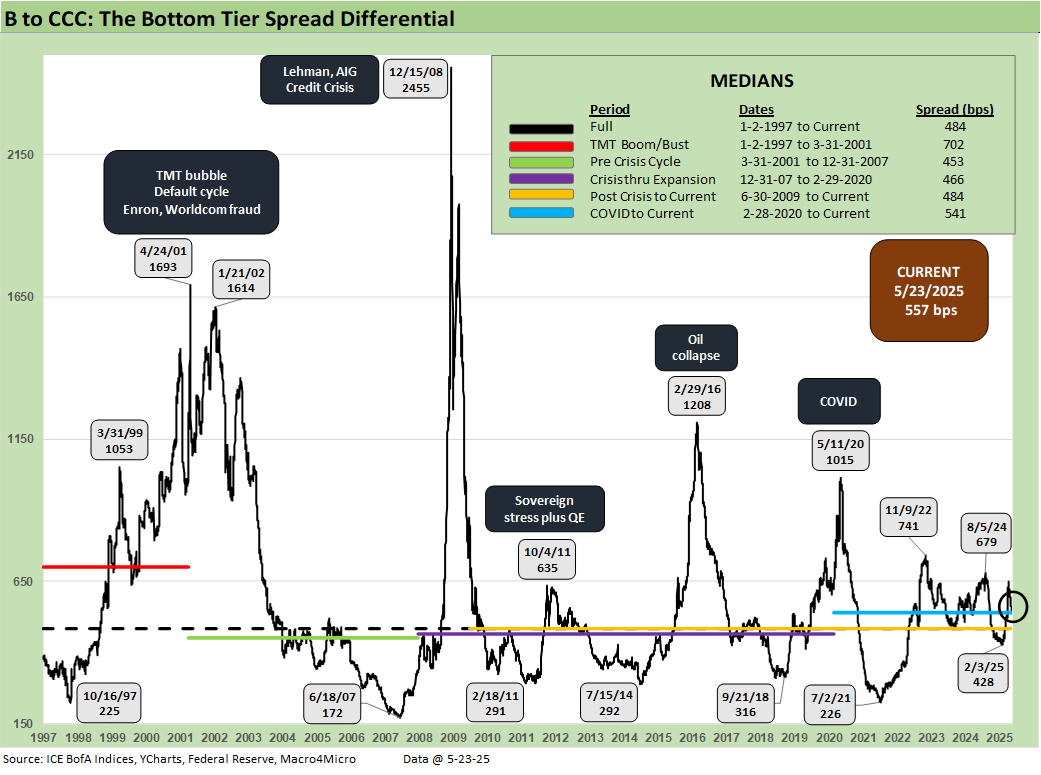
The B vs. CCC tier differential is broken out with the current +557 bps still higher than the long-term median and above the distinct market time horizons with the exception of the TMT HY credit cycle with its +702 bps median.
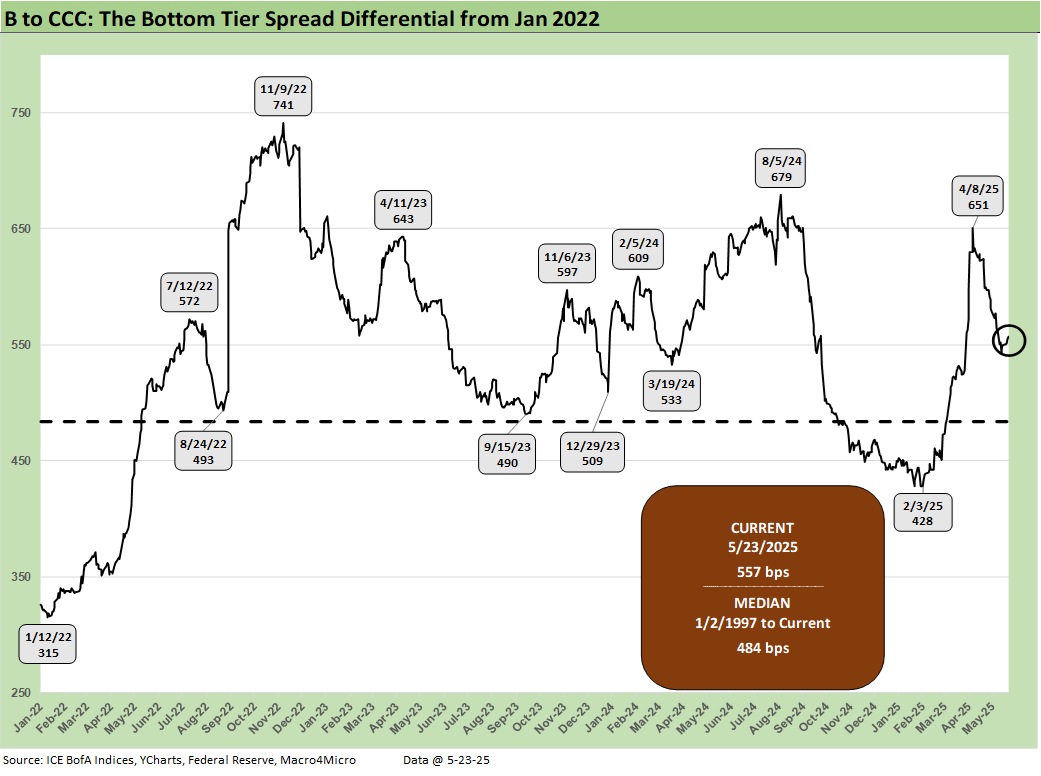
The above chart frames the “B vs. CCC tier” quality spread differential across the short timeline for better granularity. Spreads widened with a vengeance since the low of Feb 2025 at +428 bps even if quality spreads recovered from the early April spike to +651 bps on April 8.
A look at yields…
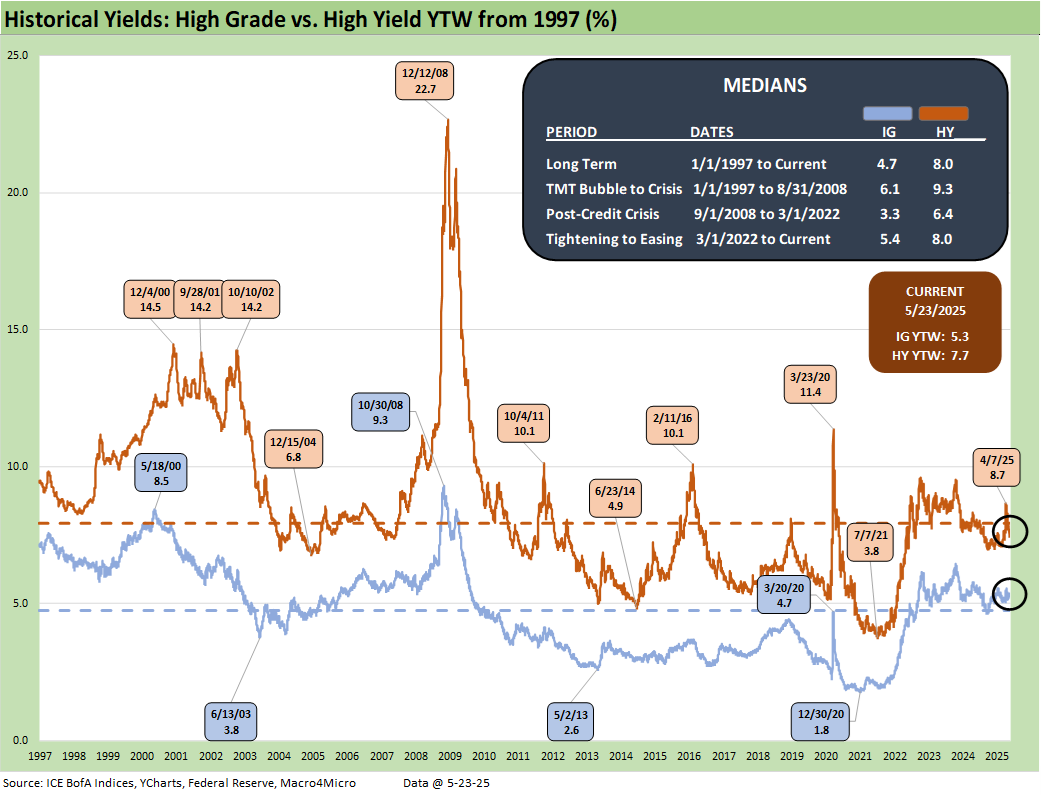
Moving away from spreads, which are well below long-term medians this week, yields for both IG and HY have a more complex story in historical context given the post-crisis distortions of ZIRP and “normalization.” The normalization period of Dec 2015 to Dec 2018 never really got on track with the economic weakness and Fed easing of 2019 followed by a COVID crisis and return to ZIRP in Mar 2020 (ZIRP ended March 2022).
The current IG YTW at 5.33% (vs. 5.29% last week) rose amidst budget deficit and Japan headlines and remains below the 6.1% pre-ZIRP median on YTD UST curve moves.
The HY YTW increased to 7.68% (from 7.48%) vs. a pre-ZIRP 9.3% median. We consider the pre-ZIRP years the most rational frame of reference in light of the post-crisis ZIRP and QE as well as the COVID Fed reactions.
Spreads will remain a key swing factor for reaching those yield medians of pre-ZIRP years, and we just saw material volatility in credit risk pricing in HY the past five weeks. UST yields are a tougher call with the tariff backdrop that still threatens stagflation as well as the potential for further technically driven upward shift on the supply-demand fears. A pause on EU tariffs avoids more immediate self-inflicted pain this week but still leaves the trade picture unresolved with many large trade partners to address. Stagflation risk is still on the table.
In theory, old fashioned recession risk would pressure UST rates lower and credit spreads higher, but this is no ordinary cyclical turn. We cover the UST shapeshifting in our separate Footnotes publication on yields as the UST curve saw another minor selloff this week.
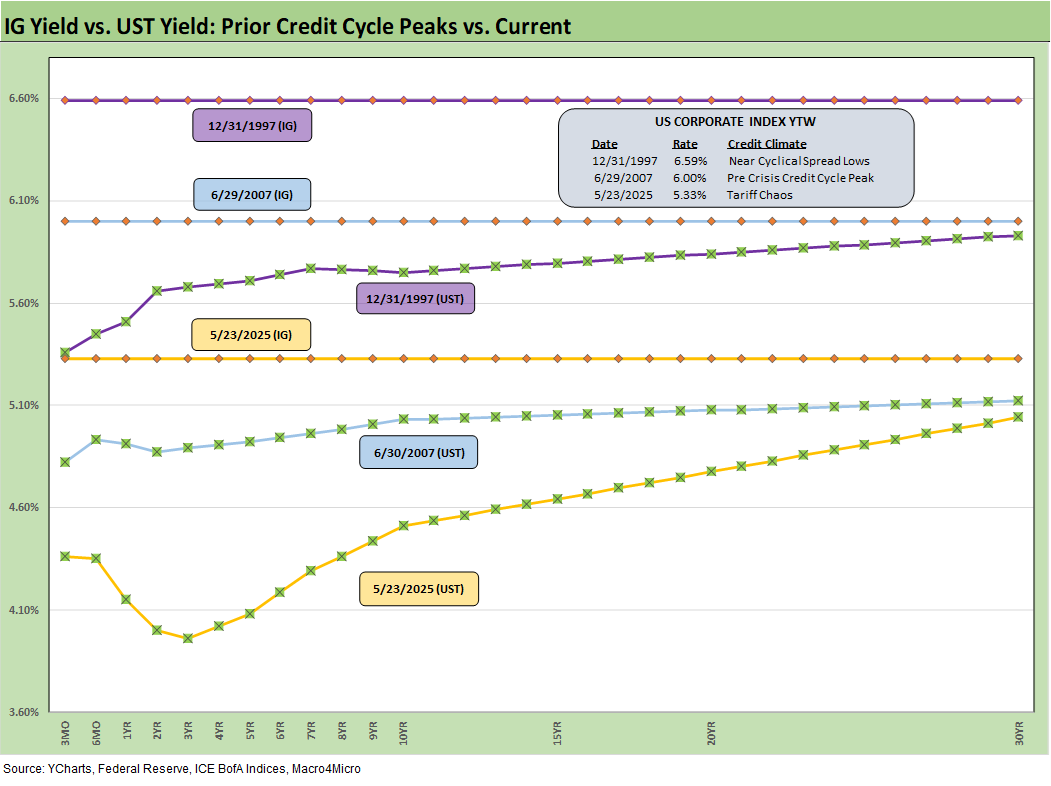
The above frames current IG index yields vs. previous credit peaks along with their respective UST curves. We include both prior credit peaks in June 2007 and Dec 1997 for context as prior peak credit cycles when high risk appetites saw investors chasing yields. Those 1997 and 2000 markets saw poor risk symmetry and low spreads.
Today’s UST curve is still low in those historical credit peak contexts. We just saw a glimpse this week of rising long yields and the return pain that comes with it. As stagflation risks stay in the mix and the current market beyond the credit cycle peak after the tariffs, long yields still could go higher with spreads widening again for another round of return pain.
The short to intermediate IG market is still the safest bond game for now. The funds that are asset class constrained to HY can take refuge in the higher quality layers, but overall corporate default risks in HY bonds remain in check.
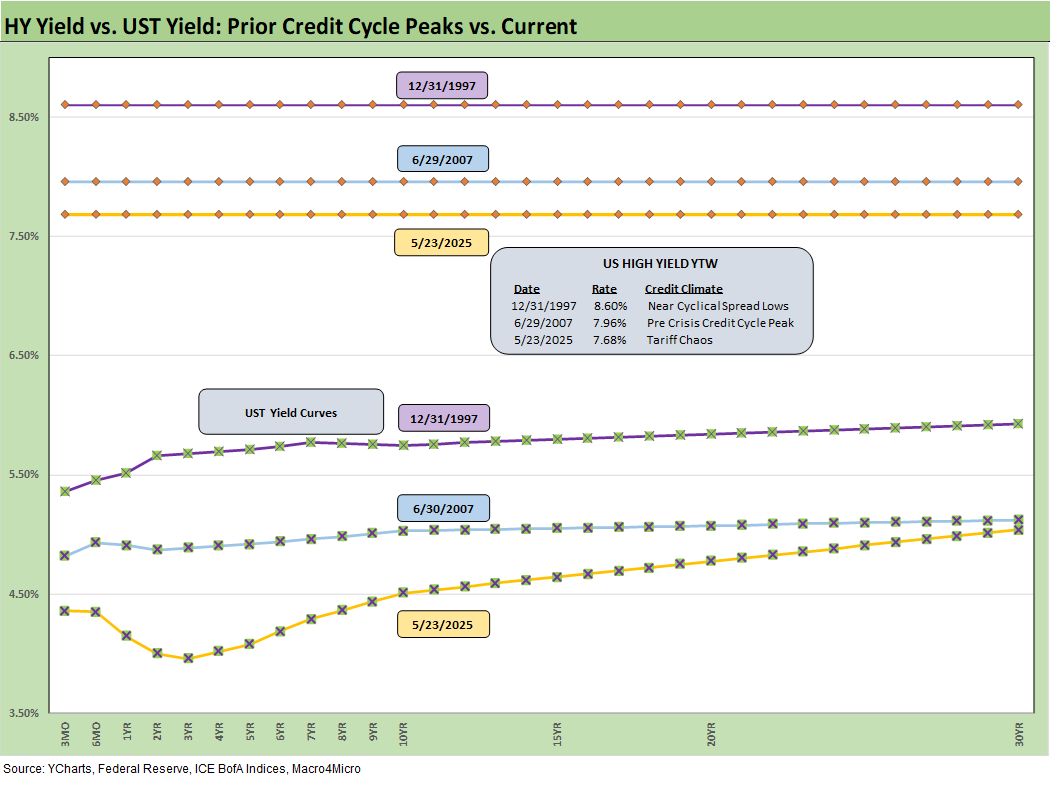
The final chart does the same 1997 and 2007 drill but for HY index yields. This week’s UST move leaves current HY index yields now below prior peak credit cycles at 7.68% vs. 7.96% in June 2007 and 8.60% in Dec 1997. The recent spread widening had moved HY index yields higher, but the recent reversal and rolling UST moves leave the current HY index YTW below both the 2007 peak and 1997 HY index levels.
The widening early this month gave flashbacks to the volatility and major spread moves of the 1997-98 and 2007-08 periods that also posted triple-digit widening months. The sheer speed of risk repricing has happened in earlier cycles even if those moves were for very different reasons.
The challenge is identifying a fundamental transmission mechanism to more trouble for financial metrics and relative risks of default. Identifying a catalyst for pain now is easy with tariffs hitting the macro drivers (the consumer) and micro drivers (“buyer pays” hits margins or requires higher prices).
The recent tariff shock is unprecedented in modern capital markets, but at least the banks are much healthier. The China truce alleviated the immediate risks and now this week brought a fresh round of EU risks that are already in “pause mode” for the time being. The overall uncertainty in getting trade deals over the line remains a threat but at least the urgency has waned for a handful of weeks before July.
We also see higher quality levels in the HY bond index as a starting point vs. 2007 and the late 1990s TMT bubble years. The reality is the tariff impacts and supply-side disruptions are only now just beginning in substance. It is hard to reflect forward-looking risks when so few know (including the White House) what those risks will be as “pauses” start and could get better or worse. China was a rough lesson for the markets.
EU now joins China on the 90-day clock that can be terminated or extended with ease, but Mexico and Canada have outstanding trade war risk as the effects of the tariff roll in and domestic political pressure picks up for leaders. It is useful for Trump to play his hand as the mood moves him in his own murky game theory plan, but corporate investment, big ticket purchase decisions by consumers, and FOMC policy setting can also take a protracted break beyond the pause.
The bad old days…
Looking back even more, the turn in the credit cycle always comes at some point and often with an external trigger or “assist” that can set it off. During 1990, securities firms started to collapse including Drexel’s Chapter 11 in Feb 1990 and bridge loan related bailouts of Shearson Lehman, First Boston, and Kidder Peabody. We do not face that type of financial intermediary meltdown risk here (at least not yet!). In a protracted stagflation bout, eyes will return to the regional banks.
The summer of 2007 was the start of major problems in the credit markets with asset risk and leveraged counterparty exposure and bank/broker interconnectedness risk soaring. Despite that backdrop that worsened in August 2007, the equity markets and S&P 500 and NASDAQ kept on rallying into Oct 2007. Later in the turmoil and well after the fact, the start of the recession was tagged as Dec 2007 (see Business Cycles: The Recession Dating Game 10-10-22).
The 2007 experience reminded the market that credit leads the cycle and equity lags. The same was true in 1999 with the HY default cycle underway and NASDAQ at +86% that year. This time around, the credit markets did not expect the tariff insanity and is still making up its mind. The real economic effects are more geared to the periods ahead in late 2Q25 and 3Q25 when tariffs will be rolling in at the transaction level. That will be the reality point. We expect HY to stay unhappy and spreads to average wider as the tariffs roll into actual corporate fundamentals.
There are no frictionless wheels in high tariffs. The buyer pays the tariff at customs. How that gets spread around the seller to buyer to customer chain has a lot of moving parts. The “seller pays” and “selling country pays” has been a clear lie from the Trump camp and he admitted as much when he demanded that Walmart “eat” the tariff cost. Why would there be anything to eat if the seller pays? Shady and misleading discourse is never new to Washington.
The problem this past week is that Trump also highlighted the hundreds of billions e collected from selling countries yet again this past week. We cannot tell what Trump remembers as a fact and what he made up. So, until the tariff deals are put to bed, outsized “surprise risk” in tariffs remains high on the list. Since he breached the USMCA, even a deal not a reliable deal. Congress has allowed him to declare an emergency at will.
See also:
Footnotes & Flashbacks: State of Yields 5-25-25
Footnotes & Flashbacks: Asset Returns 5-25-25
Mini Market Lookback: Tariff Excess N+1 5-24-25
New Home Sales April 2025: Waiting Game Does Not Help 5-23-25
Existing Home Sales April 2025: Soft but Steady 5-22-25
Credit Snapshot: Lithia Motors (LAD) 5-20-25
Home Starts April 2025: Metrics Show Wear and Tear 5-19-25
Footnotes & Flashbacks: Credit Markets 5-19-25
Industrial Production April 2025: CapUte Mixed but Time Will Tell 5-15-25
Retail Sales April 25: Shopping Spree Hangover 5-15-25
Credit Spreads: The Bounce is Back 5-13-25
Recent Tariff Commentaries:
CPI April 2025: 1st Inning for Tariffs and CPI 5-13-25
US-UK Trade: Small Progress, Big Extrapolation 5-8-25
Tariffs: A Painful Bessent Moment on “Buyer Pays” 5-7-25
Trade: Uphill Battle for Facts and Concepts 5-6-25
Tariffs: Amazon and Canada Add to the Drama 4-29-25
Ships, Fees, Freight & Logistics Pain: More Inflation? 4-18-25
Tariffs, Pauses, and Piling On: Helter Skelter 4-11-25
Tariffs: Some Asian Bystanders Hit in the Crossfire 4-8-25
Tariffs: Diminished Capacity…for Trade Volume that is…4-3-25
Reciprocal Tariff Math: Hocus Pocus 4-3-25
Reciprocal Tariffs: Weird Science Blows up the Lab 4-2-25