
Nov 2023 New Homes Sales: Feeling the Volume Fade
We look at the most recent moves in new home sales and the relative share held by builders vs. existing homes.


After some material revisions of prior months, new home sales for Nov 2023 were down by 12.2% sequentially on a SAAR basis but were up by a minor 1.4% YoY vs. Nov 2022.
At a 15.4% share of total home sales, the builders saw new homes sales lose % share of total home sales to existing home sales, but the builders’ share remains well above the long-term median of 12.4%.
Nov 2023 saw some significant price revisions higher for prior months, but a median price of $434.7K was down substantially YoY from $462.3K in Nov 2022, even if higher from Oct 2023, which was $414.9K.
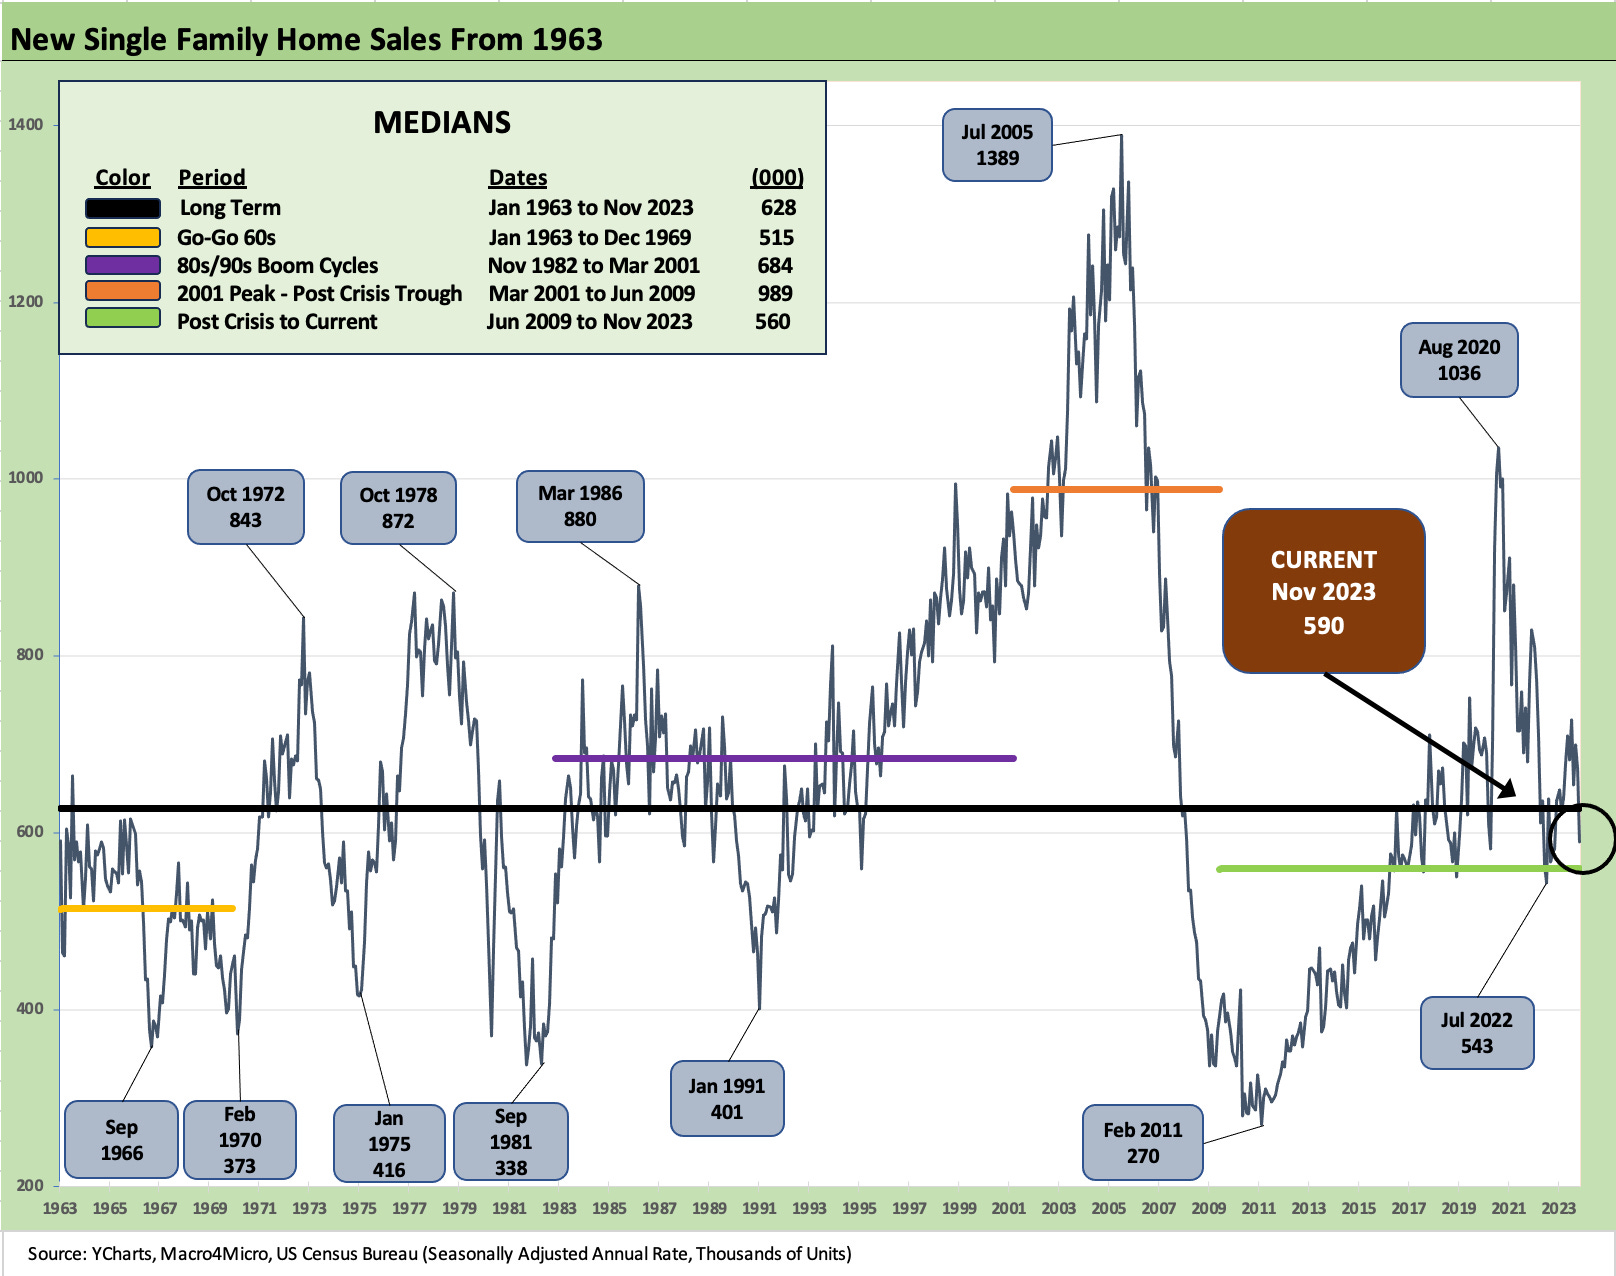
The above chart updates the long-term path of new home sales with Nov 2023 at 590K or modestly below the long-term median of 628K. Nov 2023 was still materially higher than the post-crisis, post housing bubble median level of 560K. The pre-crisis median (March 2001 to June 2009) of +989K is still one for the ages.
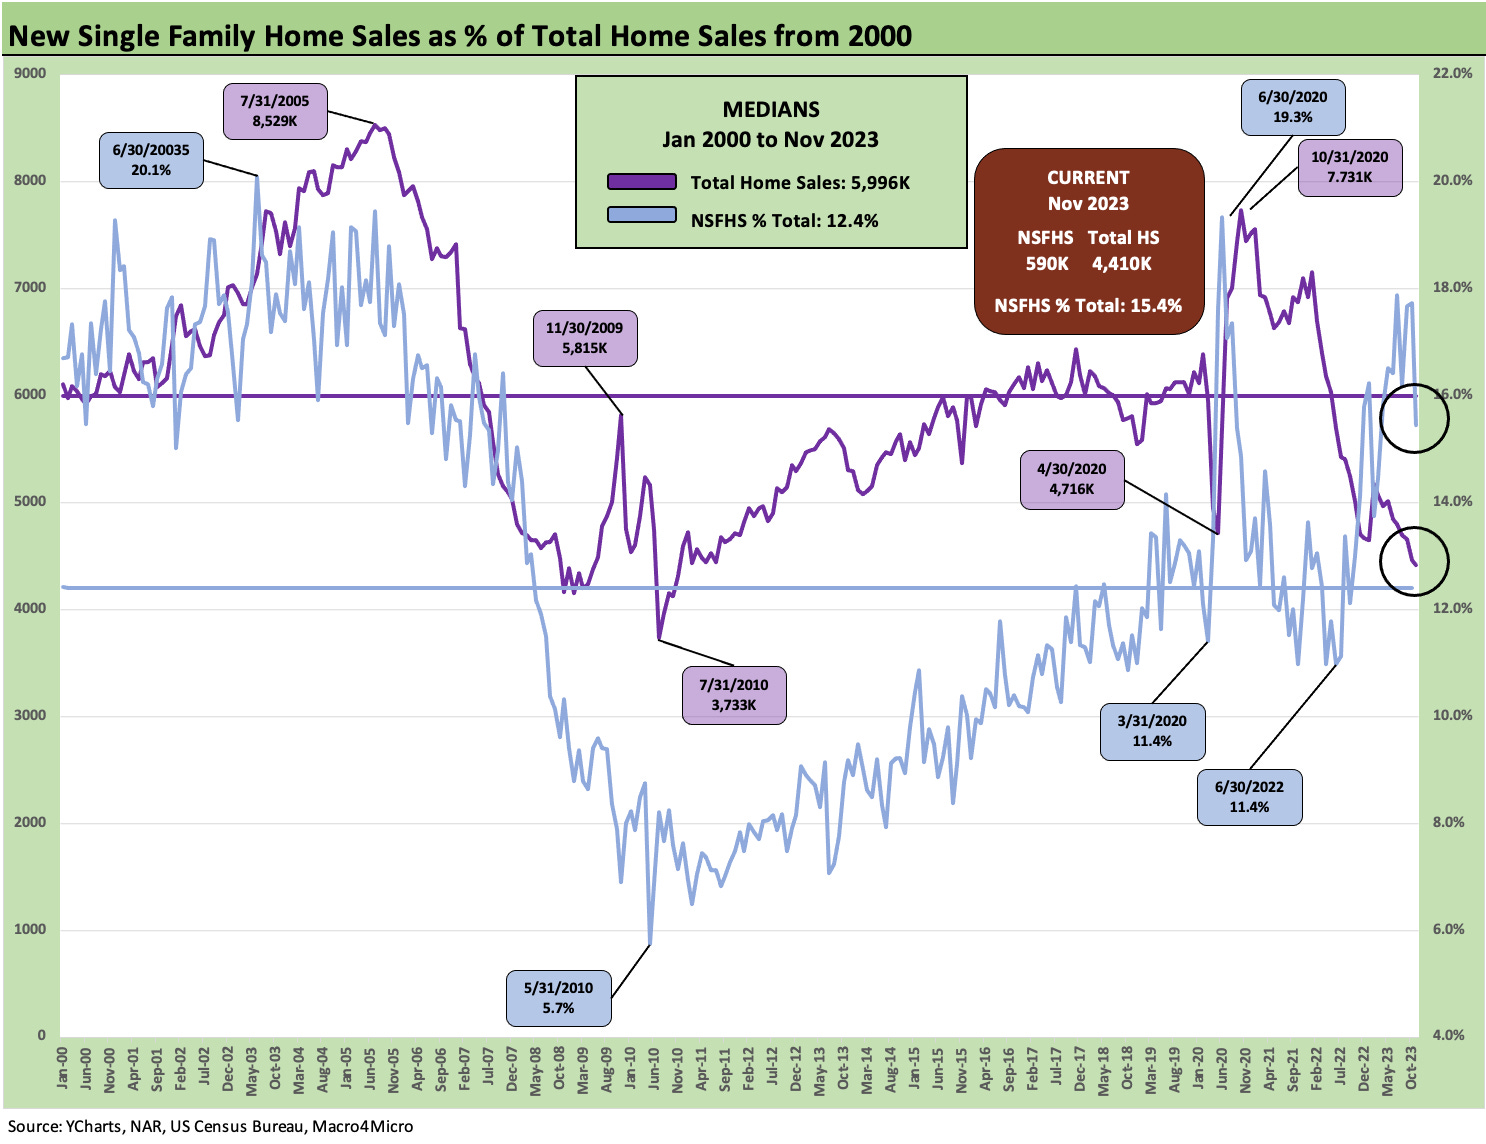
The above chart plots total home sales vs. the market share held by new home sales. As we cover routinely each month (see links at bottom), the strains on existing home sales inventory in the face of strong demographic demand has yielded benefits for the builders in gaining share on the ability to deliver inventory in line with price tiers and regional needs. The builders are also able to be creative in the use of fee-based incentives and mortgage buydowns to serve as a catalyst for transactions in a tough mortgage market (see Footnotes & Flashbacks: State of Yields 12-16-23).
The volume and price support has helped builders generate a very strong performance in the equity markets on the back of strong earnings and high free cash flow. The Homebuilder ETF (XHB) was running at #1 YTD in the peer group of 31 benchmarks and ETFs we monitor each week in our weekly “Footnotes” publications (see Footnotes & Flashbacks: Asset Returns 12-16-23).
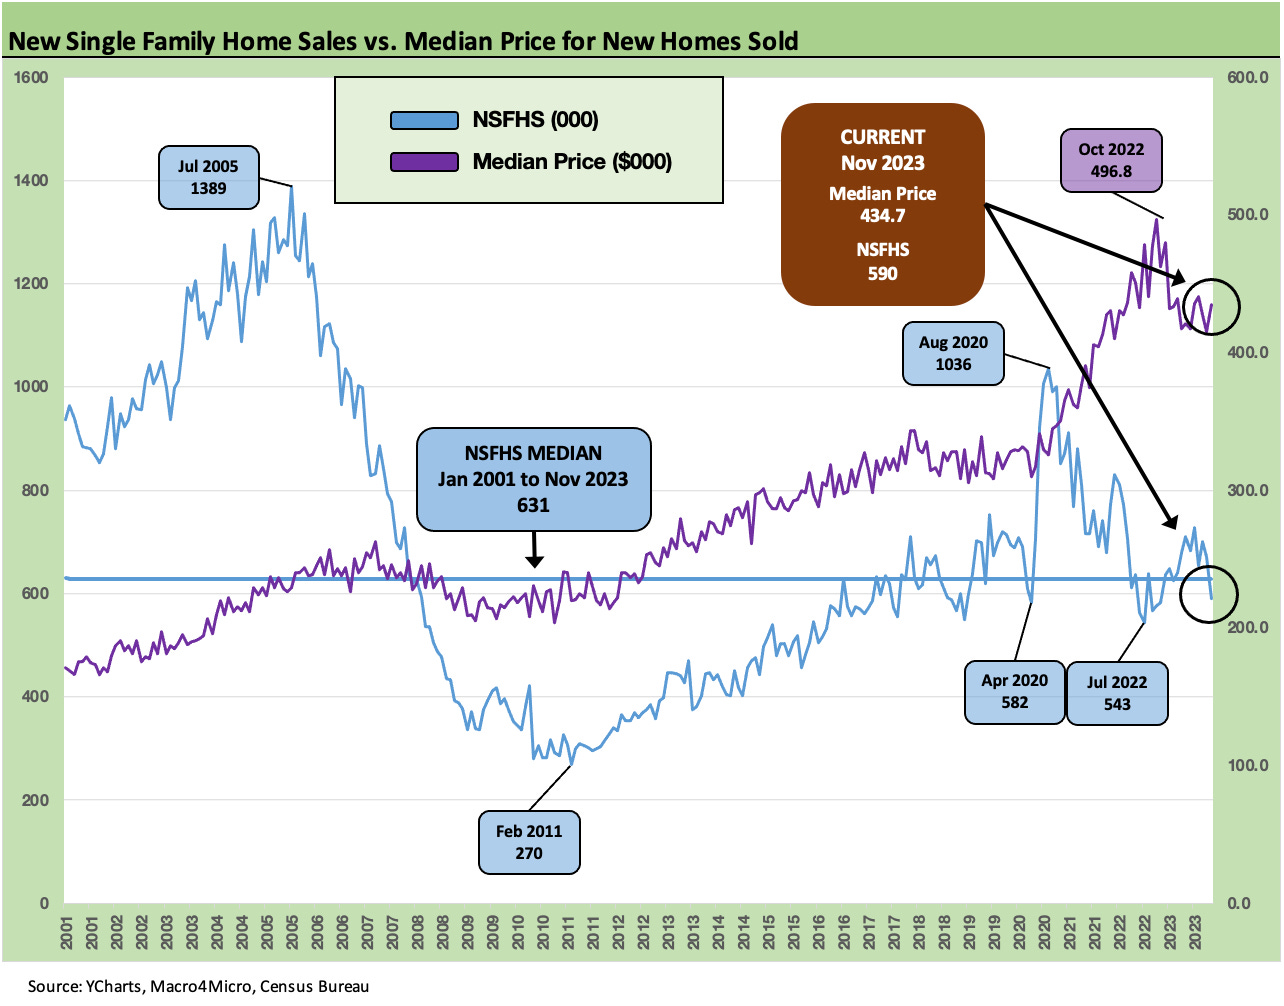
The above chart plots the median price for new homes vs. the volume of new home sales. The fact remains that prices have generally remained strong (subject to regional and product tier mix) despite weak volumes from the 2020-2021 selling peaks. That trend had initially surprised some in the market, but the builders demonstrated how and why they could pull off such a feat. Record need for housing and record high payroll counts have helped, combined with “barriers to selling” to anchor median home prices well above pre-COVID levels.
The “golden handcuffs” and record low average mortgage rates in the existing homeowner base were heavily influenced by the refi wave of the ZIRP and COVID years. We have addressed these trends in prior publications.
The question from here will be how quickly the market will see mortgage rates move in 2024. The 30Y has a long way to go to derisk the low monthly mortgage payments held by potential sellers who might need a mortgage on the other side of a transaction for their next home, including potential move-up trades.
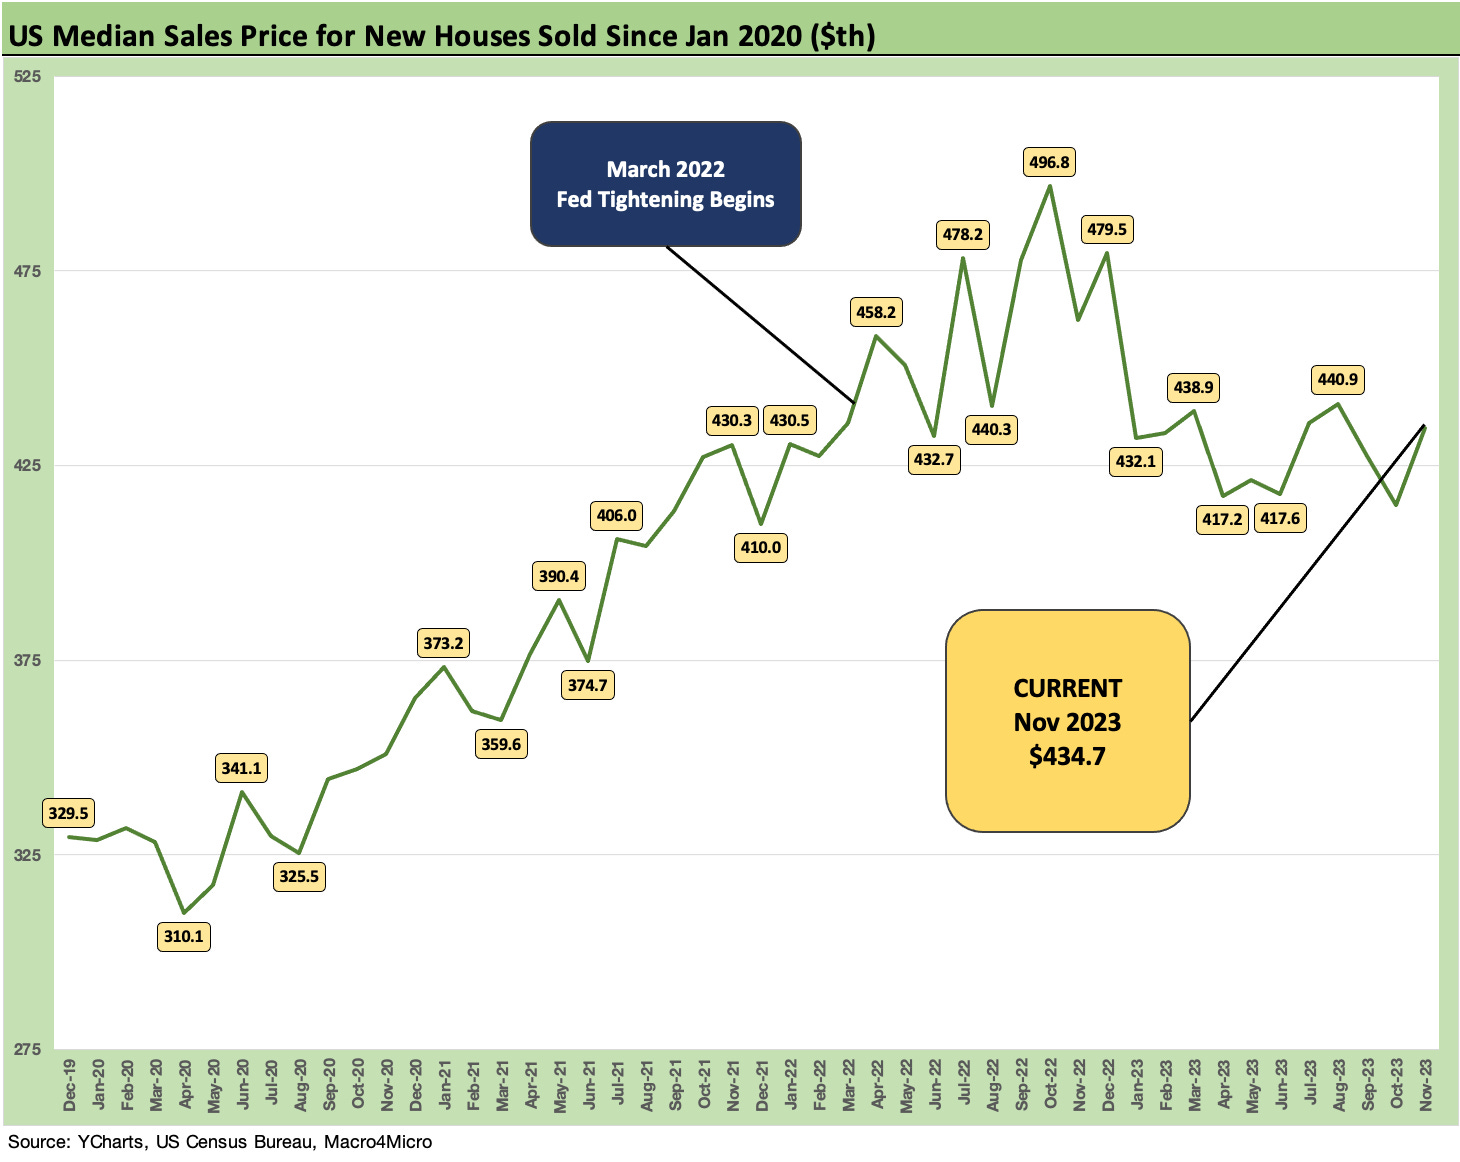
The above chart plots the median new home sales prices back from the end of 2019 just ahead of the COVID crisis. It then follows the path across ZIRP and the record mortgage refinancing volumes. The strength of home prices and the resilient home equity base of mortgaged homes provide comfort alongside the low mortgage rates and lower monthly payments. The downside is the ability to sell and relocate have been impaired.
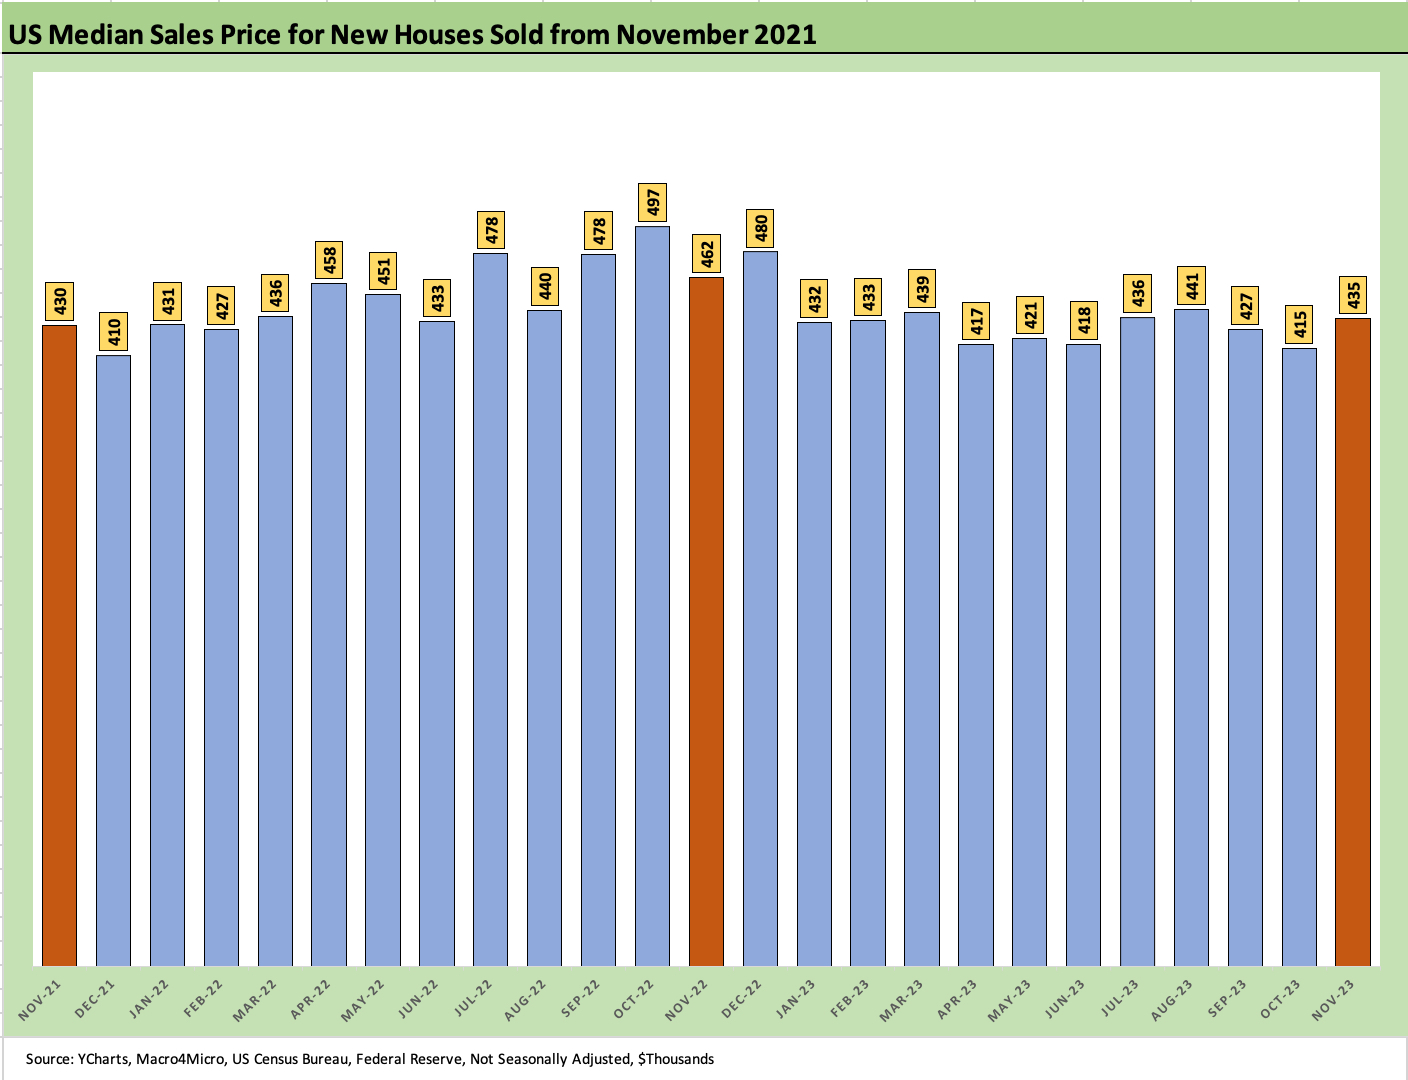
The above chart updates the monthly median prices with more data points from a different visual perspective. The comfort for the homeowner is stability in his asset values. The frustration for the potential buyer is a lack of existing inventory that plays to the builders.
See also: