
Nov 2023 Existing Home Sales: Avoids New Lows
Existing home sales are bumping along the multicycle lows waiting for mortgage rate relief to break the logjam.


The latest existing home sales numbers keep the themes the same but with inventory down and a sequential uptick by 0.8% in total existing home volumes that are still hovering near the lows seen during the housing bubble aftermath and financial crisis years.
The market saw a minor decline in median prices sequentially to $387.6K vs. a revised $391.6K for Oct, but median prices remain higher YoY by +4.0% from $372.7K in Nov 2022.
By region, sequential volumes were up in the critical South and in the Midwest and down in the West and Northeast, but on a YoY basis all four regions were down in volume.
The forward expectation on existing home sales inventory into 2024 and breaking the logjam will get tested by the downdraft in mortgage rates rolling into the market.
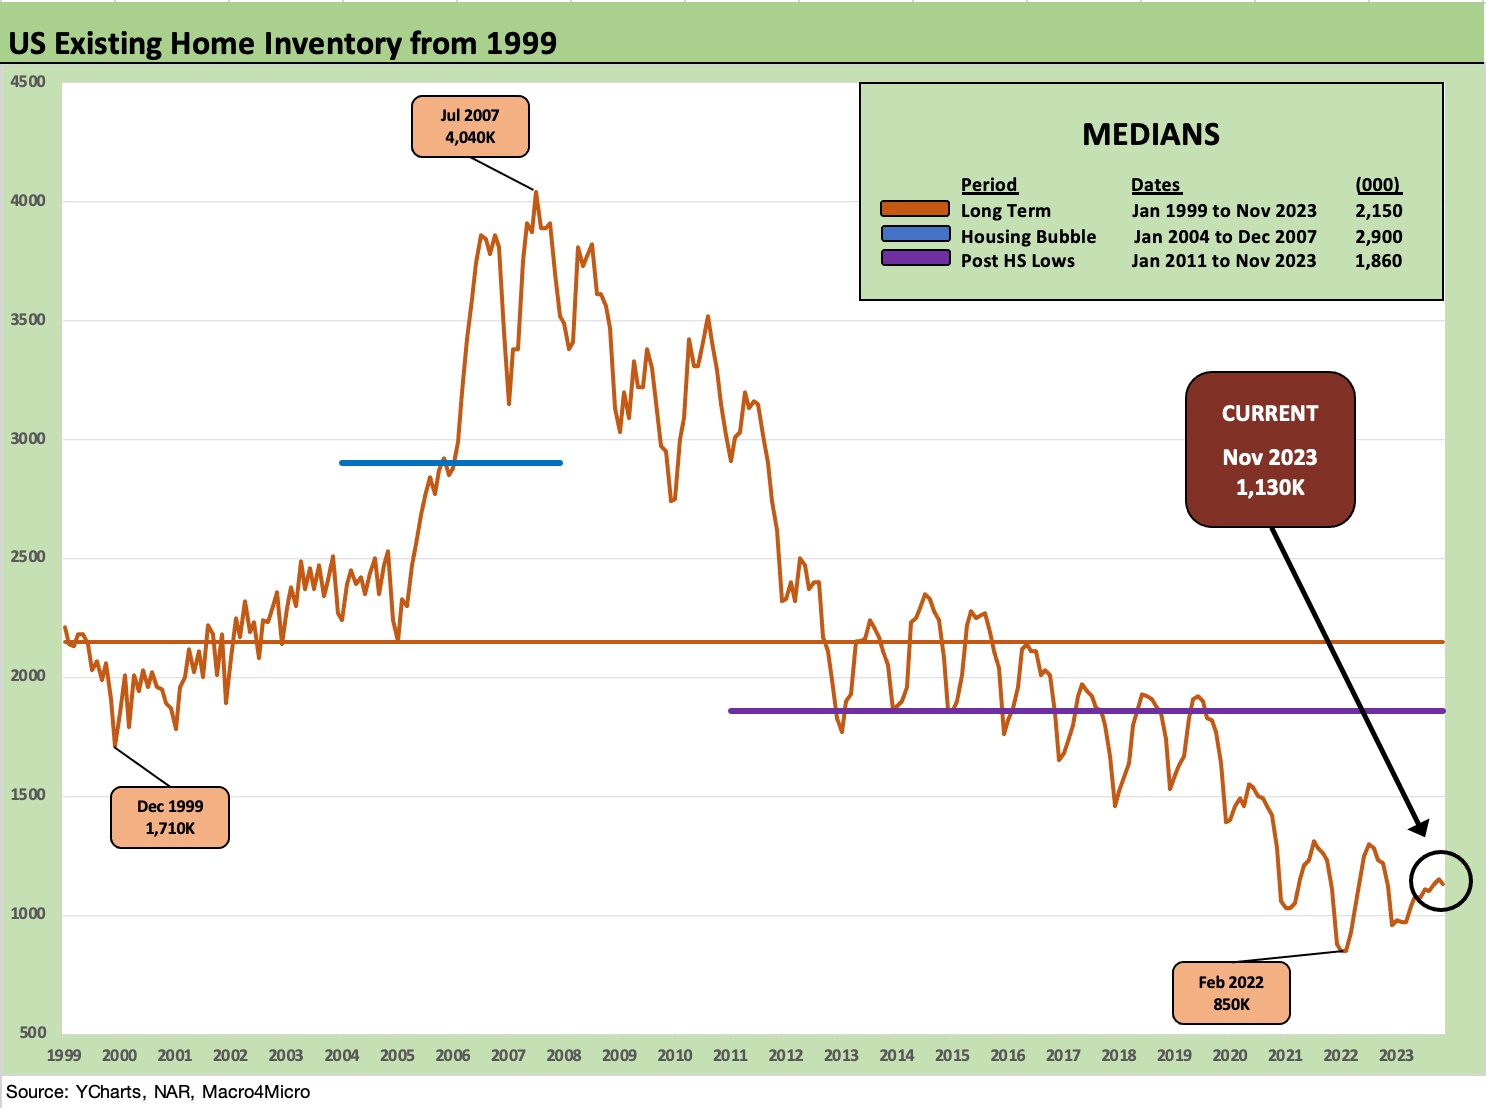
The core of the housing sector story line since the massive UST moves across the inflation spike, Fed tightening cycle, and dramatic UST shift has been the supply-demand imbalances. The price resilience has been rooted in low existing home sales inventory and plenty of need in the market. That basic theme has not changed across the later months of 2023 including Nov 2023 with inventory down sequentially to 1.13 million or -1.5% from Oct inventory of 1.15 million but up YOY from 1.12 million.

The chart above revisits the pattern of median price trends across COVID and the following refi boom that saw record low mortgage rates go along with the monetary and economic volatility. In a topic that has been covered nonstop, the rise in mortgages to 7% and eventually 8% levels created imposing monthly payment obstacles for many potential buyers as well as barriers to potential sellers.
Turning home equity into cash for a move-up trade or, alternatively, for downsizing or for saving and/or spending will be part of the story that plays out in 2024-2025. The outcomes will be tied to how the curve predictions unfold in reality. We see some very bullish forecasts out there for the Fed from 75 bps to 250 bps lower from blue chip fixed income operations. Now all the UST will need is unlimited demand along the curve at those levels to fund record deficits.
With the mortgage market now reversing course and moving quickly into the 6% handle range, there is still only going to be so much movement in existing home activity near term with the golden handcuffs still very much a factor for potential sellers.
The difference between 6% and 3% handle mortgage rates is still daunting. The good news is that the market saw a housing boom set against 6% mortgage rates back in 2005-2006 (with lower ASPs). We looked back at those periods vs. today in our yield curve weekly (see Footnotes & Flashbacks: State of Yields 12-16-23).
The sticker shock in mortgages will get worked through, but the broader market may need a 5% handle to get there based on builder feedback on how their mortgage buydowns have performed. The existing home inventory strains and supply-demand dynamic has kept prices firm as a record payroll count and demographics have helped push existing home sales prices higher in all four regions YoY.
As we typically cover in the monthly new home sales release (which will be out this Friday), the above chart shows how the builders have picked up market share of total home sales. The ability of the builder to tailor product tiers and mortgage/fee incentives by region and by community have driven the builders’ superior financial performance.
Some major builders have masterfully managed their working capital with a healthy balance of deliveries vs. starts and a creative approach to adjusting their spec inventory strategy in such an unusual backdrop not seen in four decades.
That builder execution has in turn flowed into the equity markets as the homebuilder ETF (XHB) was able to take the #1 spot YTD in return rankings as we covered in our weekly Footnotes publication (see Footnotes & Flashbacks: Asset Returns 12-16-23). We regularly look at builder operations, and the financial performance has been especially strong for the largest of the peer group across all price tiers.
Housing starts were very strong as posted in this week’s release (see Housing Starts Nov 2023: Foot by Foot, Row by Row 12-19-23), and that is going to be supported even more by lower mortgage rates into 2024. Last week saw a very strong financial performance from the #2 builder Lennar (see Lennar 4Q23: Buyer Buzz, Curve Support 12-15-23). Even if the ASPs were declining across the regions for Lennar, the builder had pursued a higher inventory turnover strategy at lower prices. The result was LEN generated massive cash flow which was used in part for debt reduction and shareholder enhancement across the fiscal year.

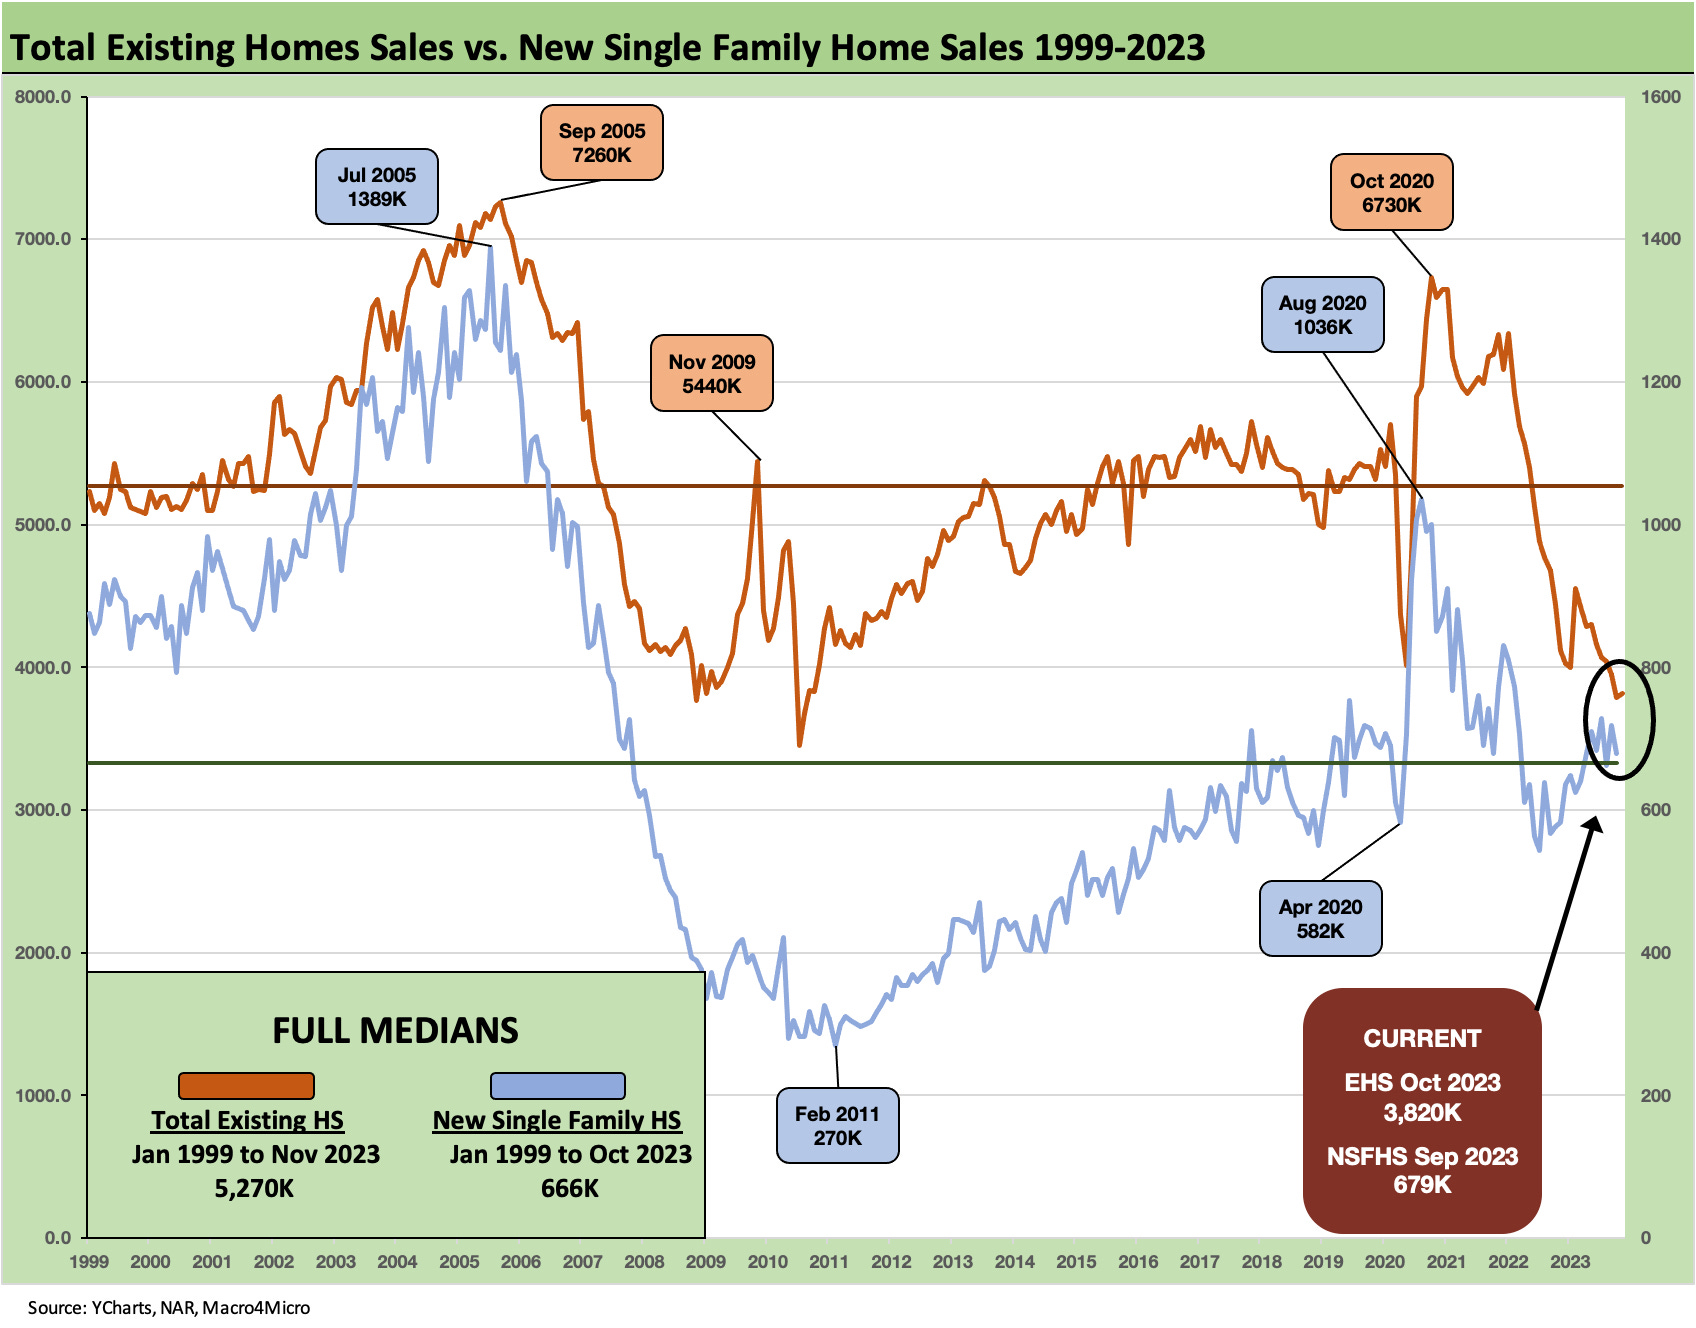
The above chart frames the time series for total existing home sales (including single family, townhouses, condos, and co-ops) vs. just the existing single family category of homes. The two lines offer some nuance on the same broad trend – as in low supply and low activity in historical context.
For condos and co-op data, volumes are well below the 2021 peak run rate volumes of 707K for that year. During Nov 2023, single family was up +0.9% sequentially but down -7.3% YoY. Condos and co-ops were flat sequentially and down -6.8% YoY. Existing condo and co-op median prices stood at $350.1K for Nov 2023. Condo and Co-op prices range widely by region from $241K in the Midwest to $496K in the West with prices higher in all regions YoY.
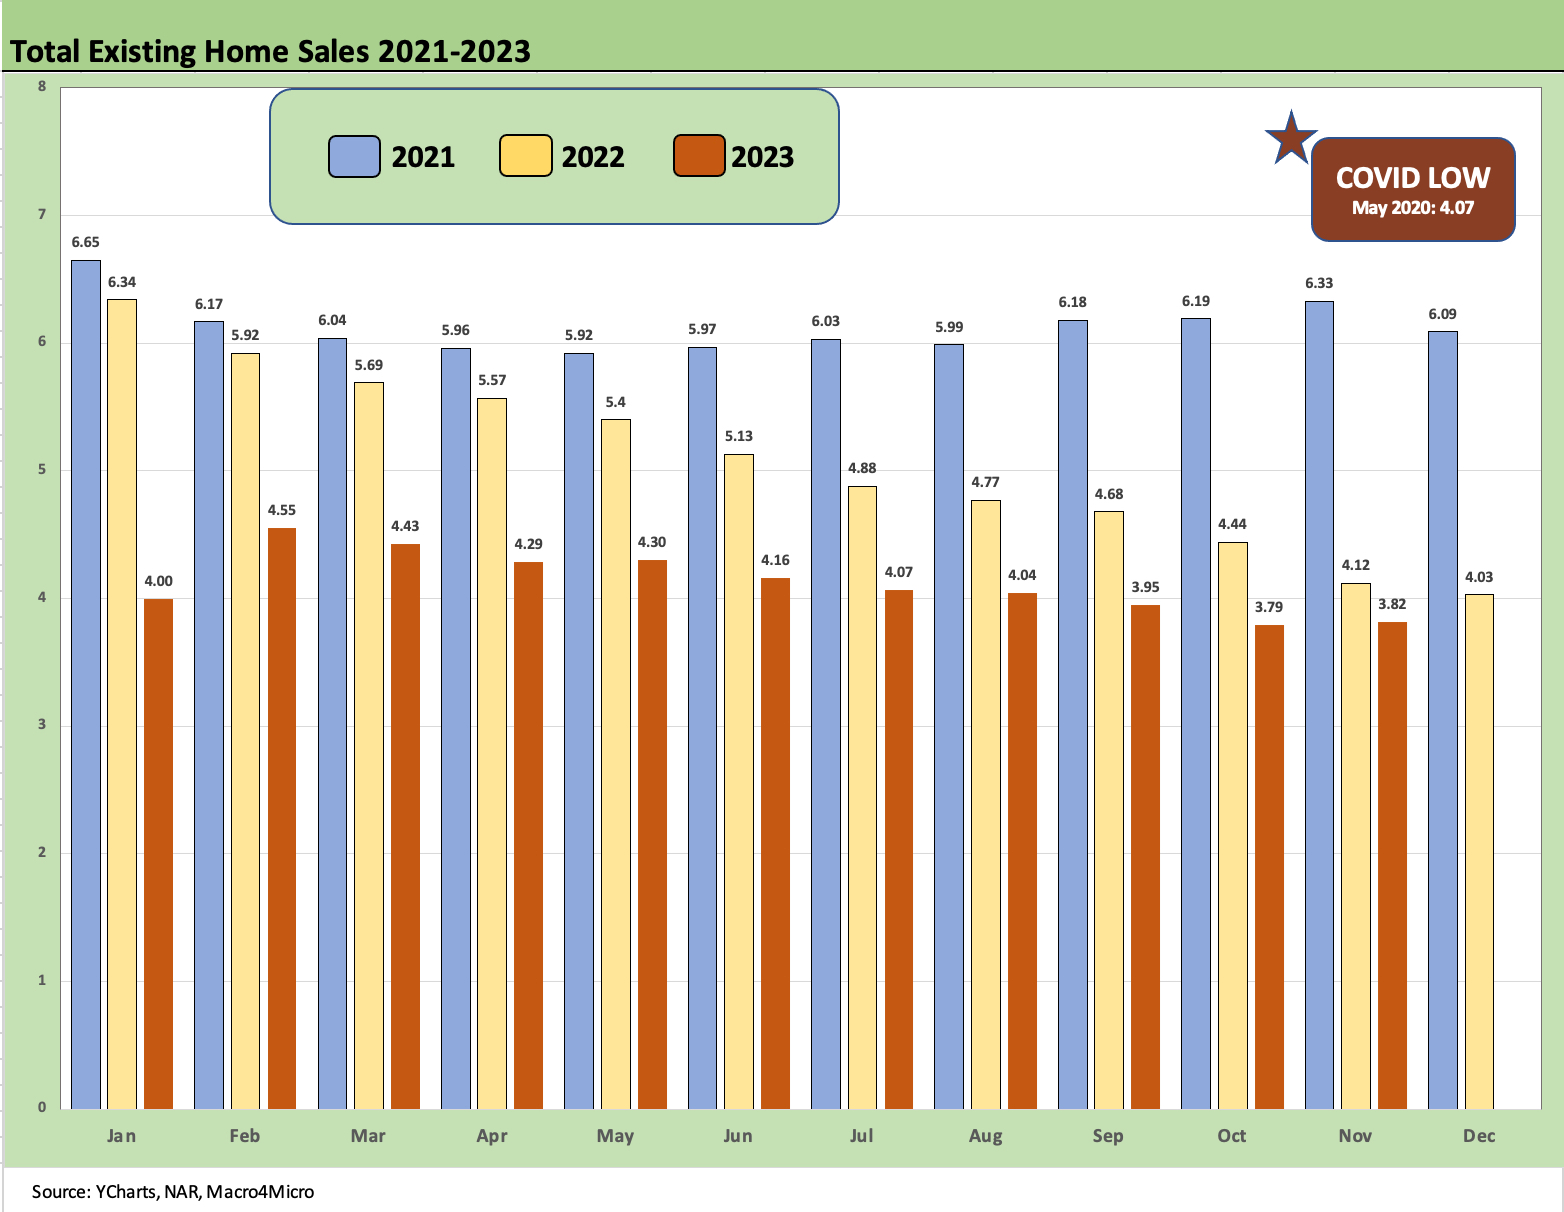
The above chart plots the total existing home sales volumes for each month from 2021 through Nov 2023. There is not much mystery to where the market stands now at levels below the COVID low month of 4.07 million units in May 2020, when many brokerage operations and related services were not functioning. The bottom tick was last month at 3.79 million.
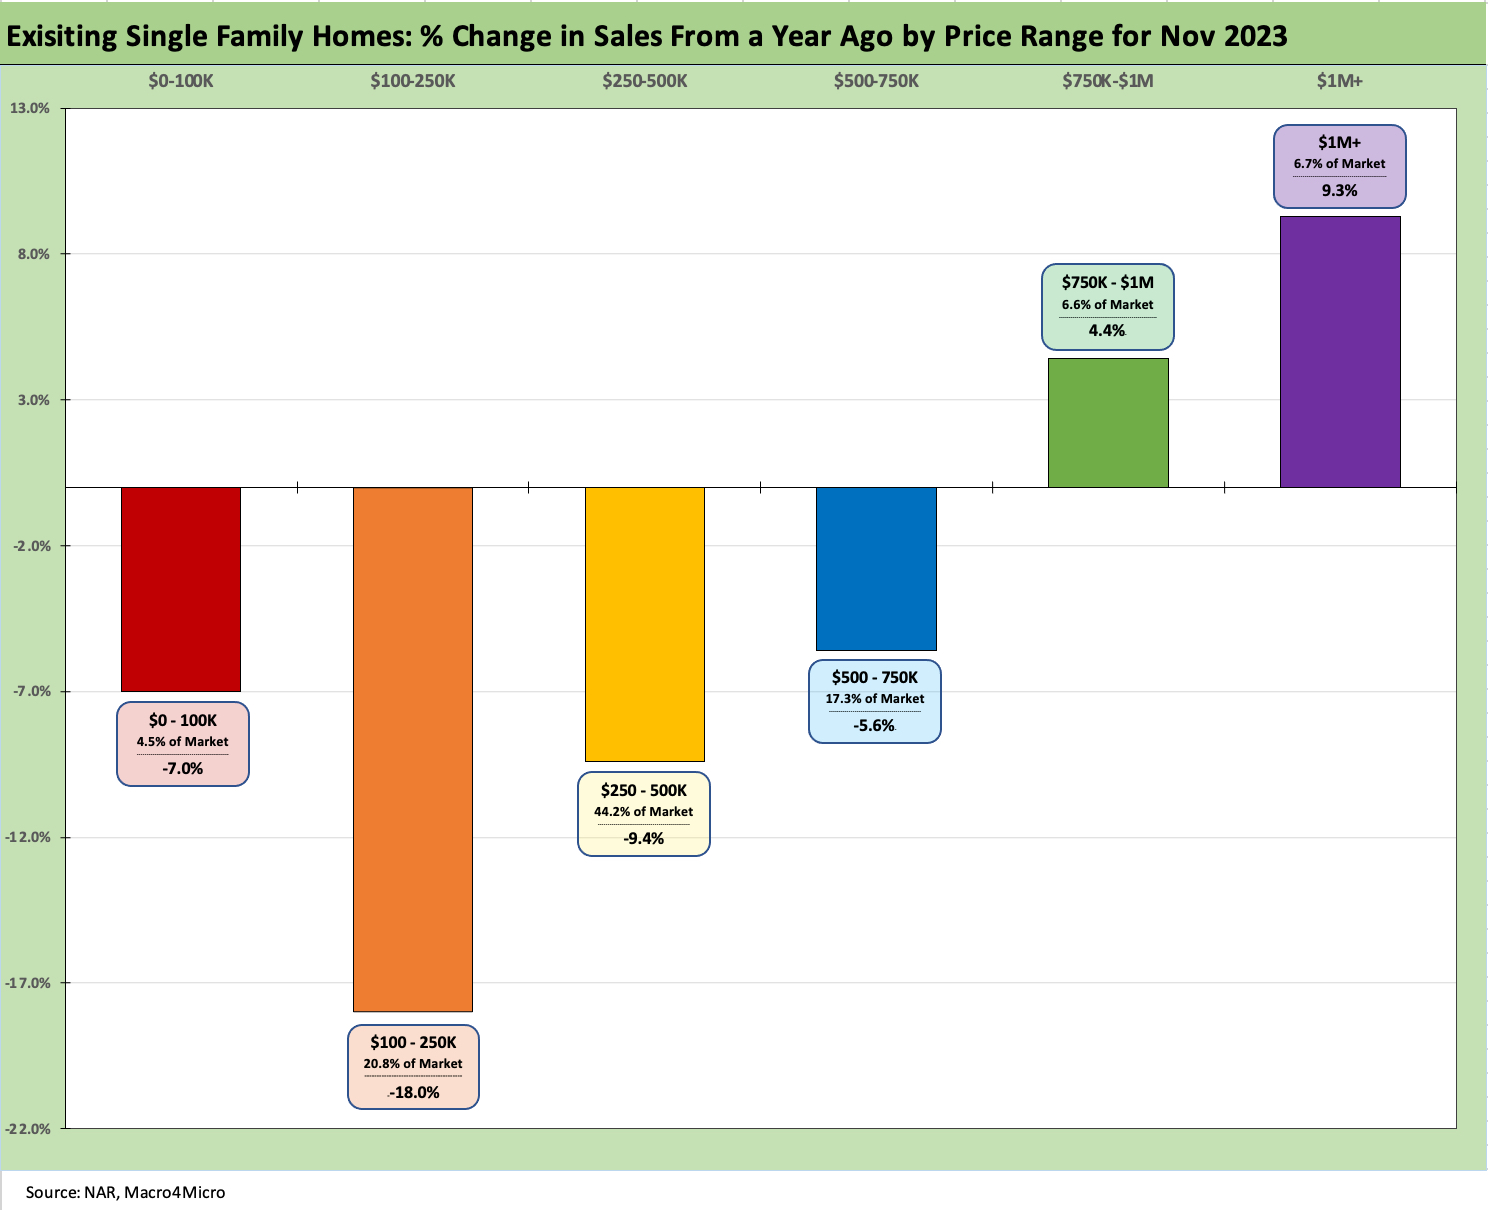
The final chart looks at the volume changes by price tiers with the high end putting up better numbers YoY as highlighted. The sweet spot of the market is in the $250K to $500K bucket, which is 44% of total and down by -5.6% YoY. The high price crowd at over $1 million is only 6.7% of total while $750K to $1 million is 6.4%. Both rose in Nov 2023.
Overall, the existing home sales backdrop is much like the prior month but with the recent FOMC buzz and UST shift lower offering some hope for inventory trends in 2024.