
Housing Starts Nov 2023: Foot by Foot, Row by Row
New residential construction just cranked it up a notch even before the FOMC meeting.


The Garden Song sets an optimistic feel, but housing is ramping up again in more than inches as Nov 2023 saw total starts at a +9.3% YoY increase across the US despite a -33.7% YoY decline for multifamily 5+ units as single family carried the day at +42.2%
In single family, the market was driven by a +35.7% increase in the critical #1 South market, the West as the #2 market posting a +40.5% rise followed by the #3 Midwest at +83.2% and the small Northeast piece at +33.9%
Permits are more measured in deltas at +4.1% for the US YoY and -2.5% sequentially from Oct 2023 for total permits while single family continues to grow at +22.8% for total US permits tempered by the multifamily 5+ units decline of -21.3% YoY.
As a reminder, these are starts and permits from before the FOMC meeting, so the UST curve dynamics are more favorable as of now for the builders given the additional tools at their disposal to manage homebuyer demand with incentives such as buydowns and using their financial services operations.
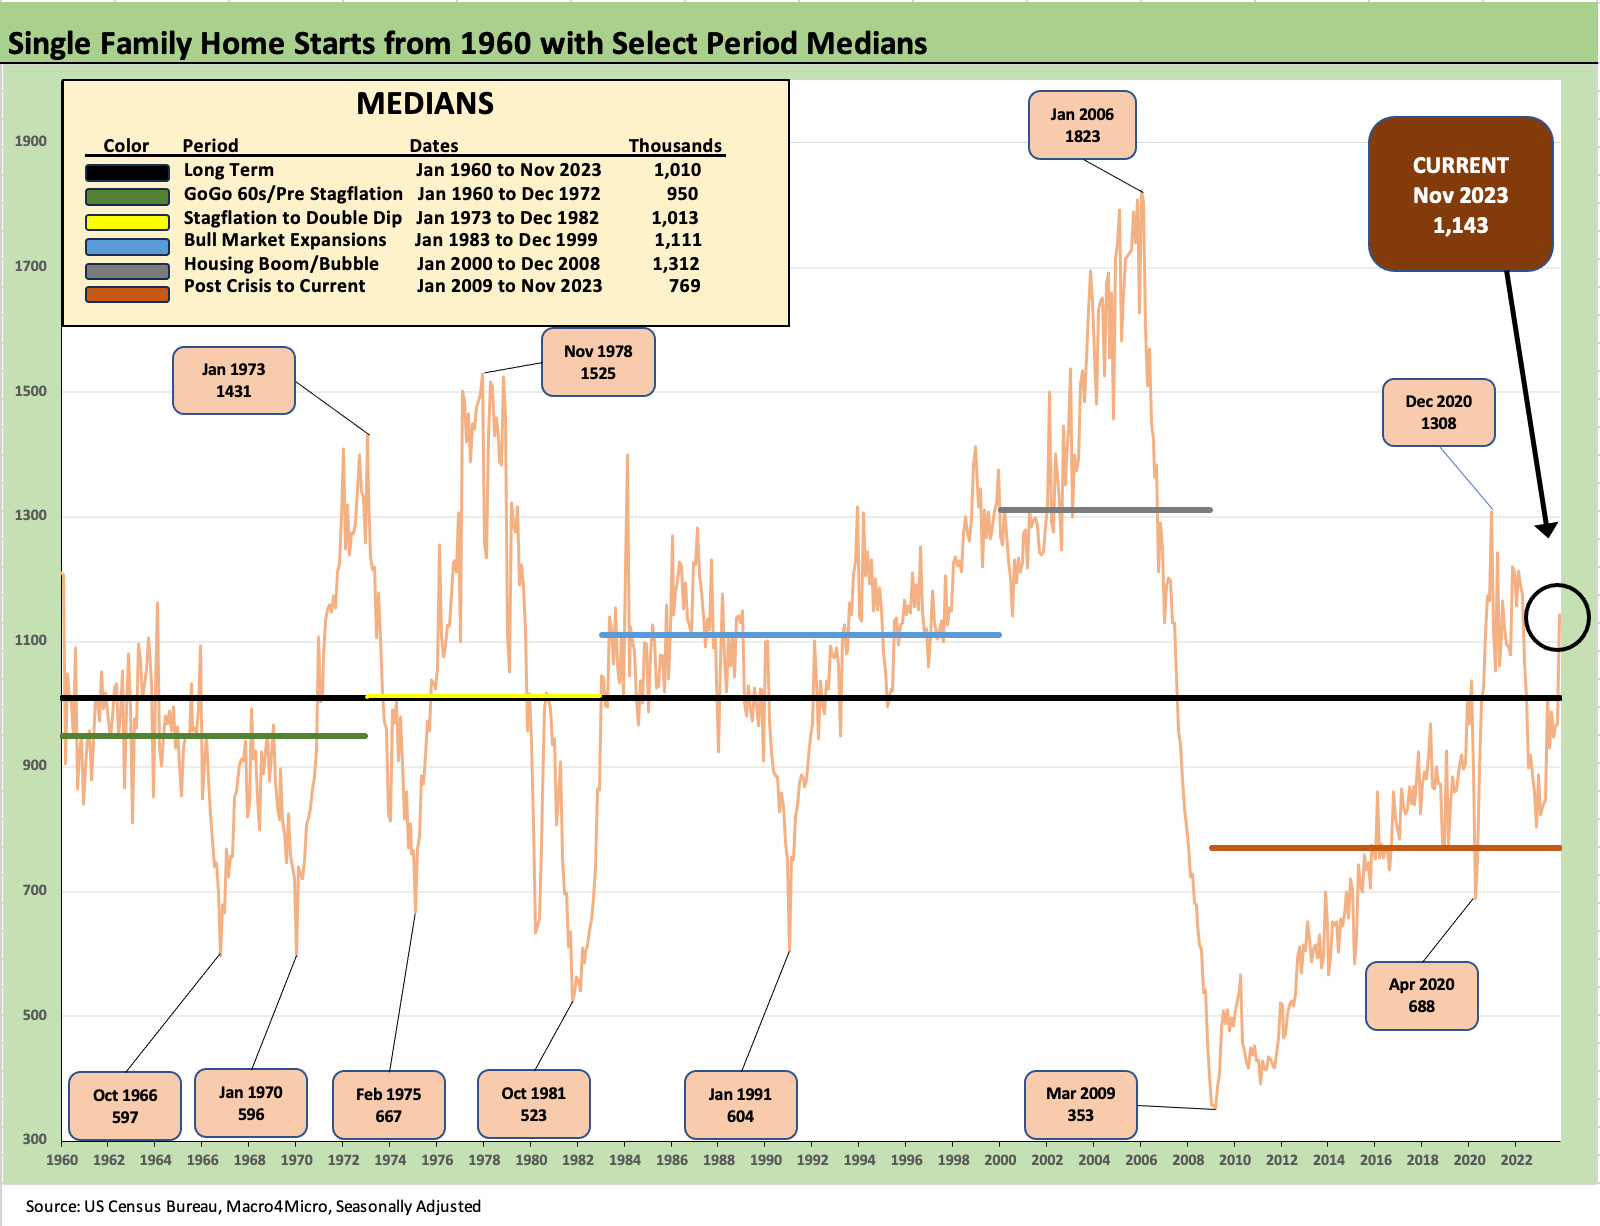
The run rate on single family starts at 1143K units (SAAR basis) is back above the long-term median (1010) and moved ahead of the only 4-digit month seen in May 2023, when we saw 1012. We see 3 of the 4 regions at the highs of the last 12 months in single family starts with only the West slightly below the high of last month.
A recurring theme in the recent homebuilder earnings reports and management discussions was the consistent strategy to keep starts and deliveries/sales in relative balance. The mix of “specs” in inventory has been high this year for numerous builders that don’t usually employ that strategy and an even higher spec mix for those that typically do. The mortgage rate challenge and timing made it a better approach and especially around managing ASPs and incentives vs. cancellations.
The idea around more specs was to have more homes ready for delivery if mortgage rates moved and demand picked up. From here, we will see how Dec and the new year starts off with the downtick in mortgage rates into the 6% handle range. We looked at the mortgage rate issues and historical context vs. the housing bubble years in our latest Footnotes publication on yields (see Footnotes & Flashbacks: State of Yields 12-16-23).
We keep getting strong numbers reported out of the major builders this season including the #2 builder Lennar last week (see Lennar 4Q23: Buyer Buzz, Curve Support 12-15-23). Meanwhile, the Homebuilder ETF (XHB) cleared last week as the #1 performing line item ahead of a laundry list of 31 ETFs and indexes that we track each week. XHB was ahead of Tech Heavy ETFs and Magnificent 7 led industry ETFs (Footnotes & Flashbacks: Asset Returns 12-16-23)
Single family housing units under construction remain high but down by -10.8% YoY even as they ticked up sequentially by +1.9%. The single family “under construction” number has trended down from 1Q23 on a SAAR basis and is well below the tail end of 2022.
Multifamily “under construction” moved higher YoY by +7.9% but is modestly below the summer peak. This is the follow-through on the multifamily starts boom that we addressed in earlier commentaries (see Home Starts - Will Housing Nerves Infect Multifamily? 12-21-22). We plot multifamily trends further below.
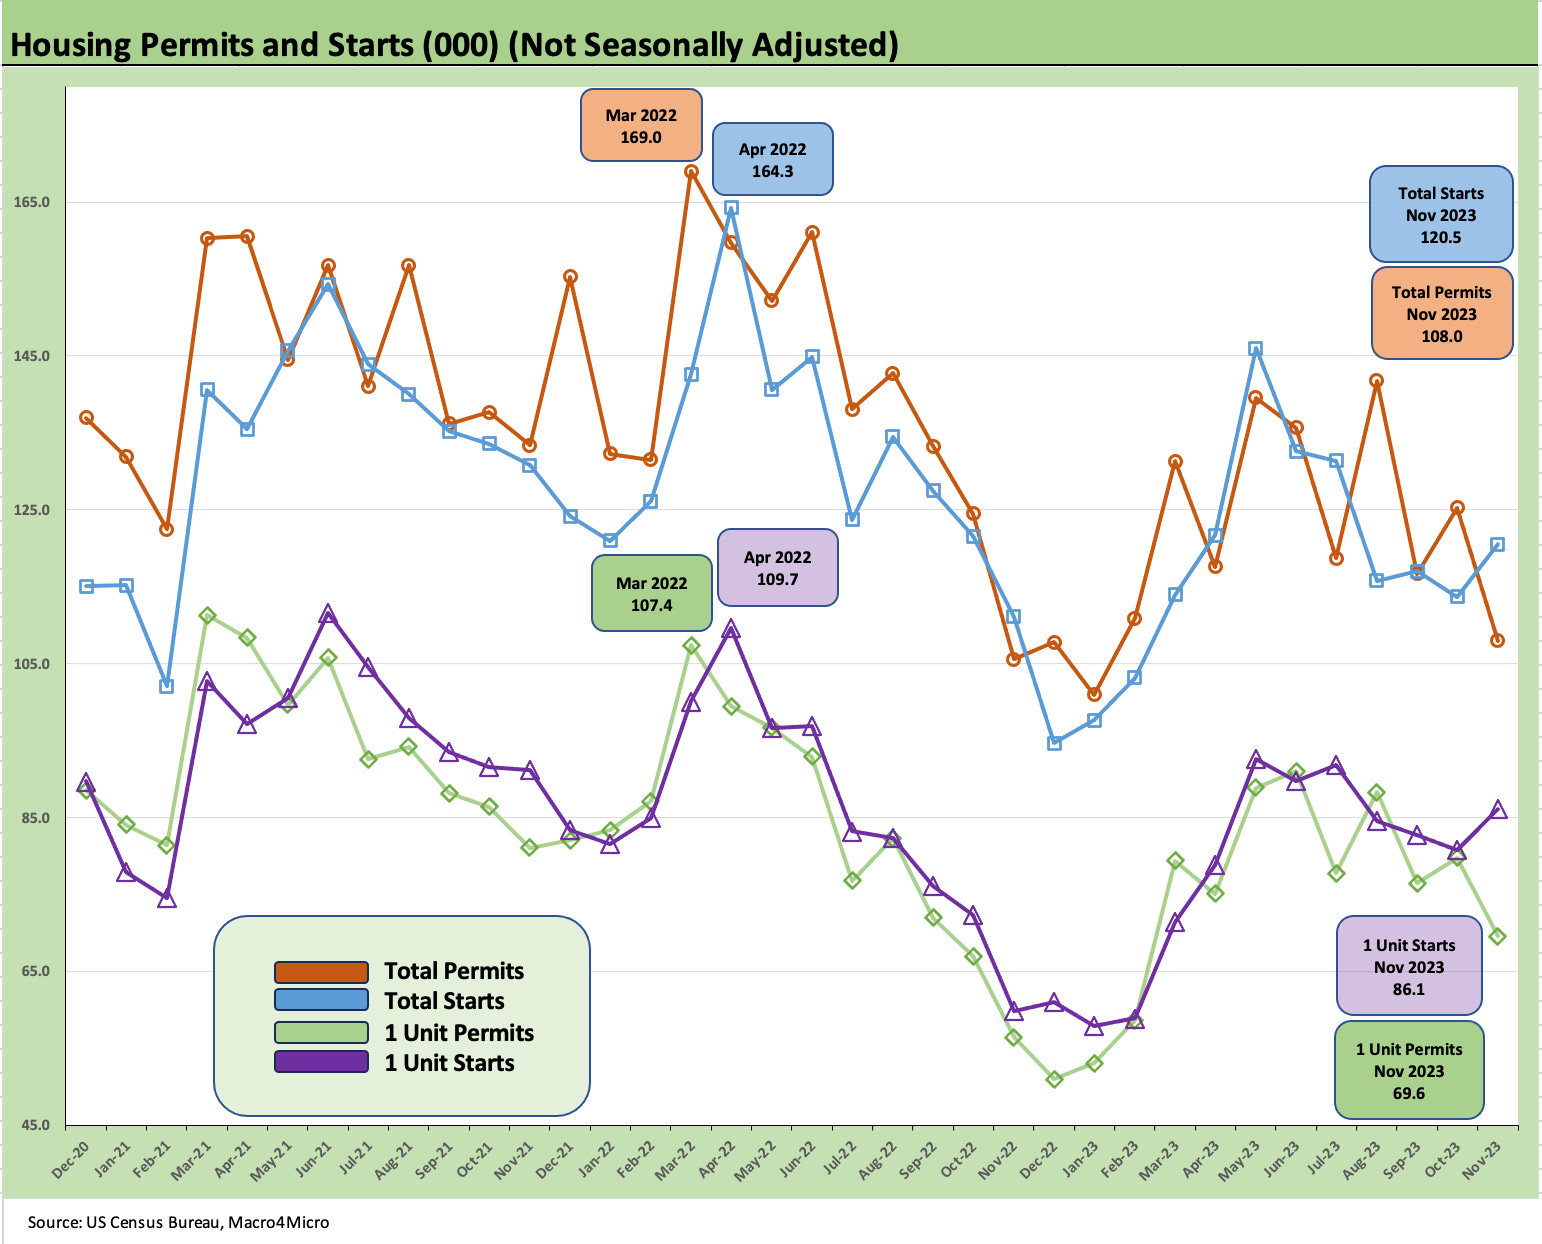
The above chart plots starts vs. permits on a “not seasonally adjusted” basis (“NSA”). NSA offers a useful proxy for what is going on in the building lots for the builders outside the SAAR models.
We plot the total for all units as well as for single family. We see the lower starts from the pre-tightening period and post-COVID rise and now a rebound for starts off the worst of the tightening cycle lows. We see starts running ahead of permits in the NSA trend line.
The direction of starts shows increased levels of economic activity and more supply for potential homebuyers as the builders pick up share of total home sales relative to the existing home sales inventory that can be put on the market. With mortgages running lower after the FOMC, the monthly payment pain is still quite high for a seller with a 3% handle mortgage, so there will be a lot to work through between now and the peak selling seasons of 2024.
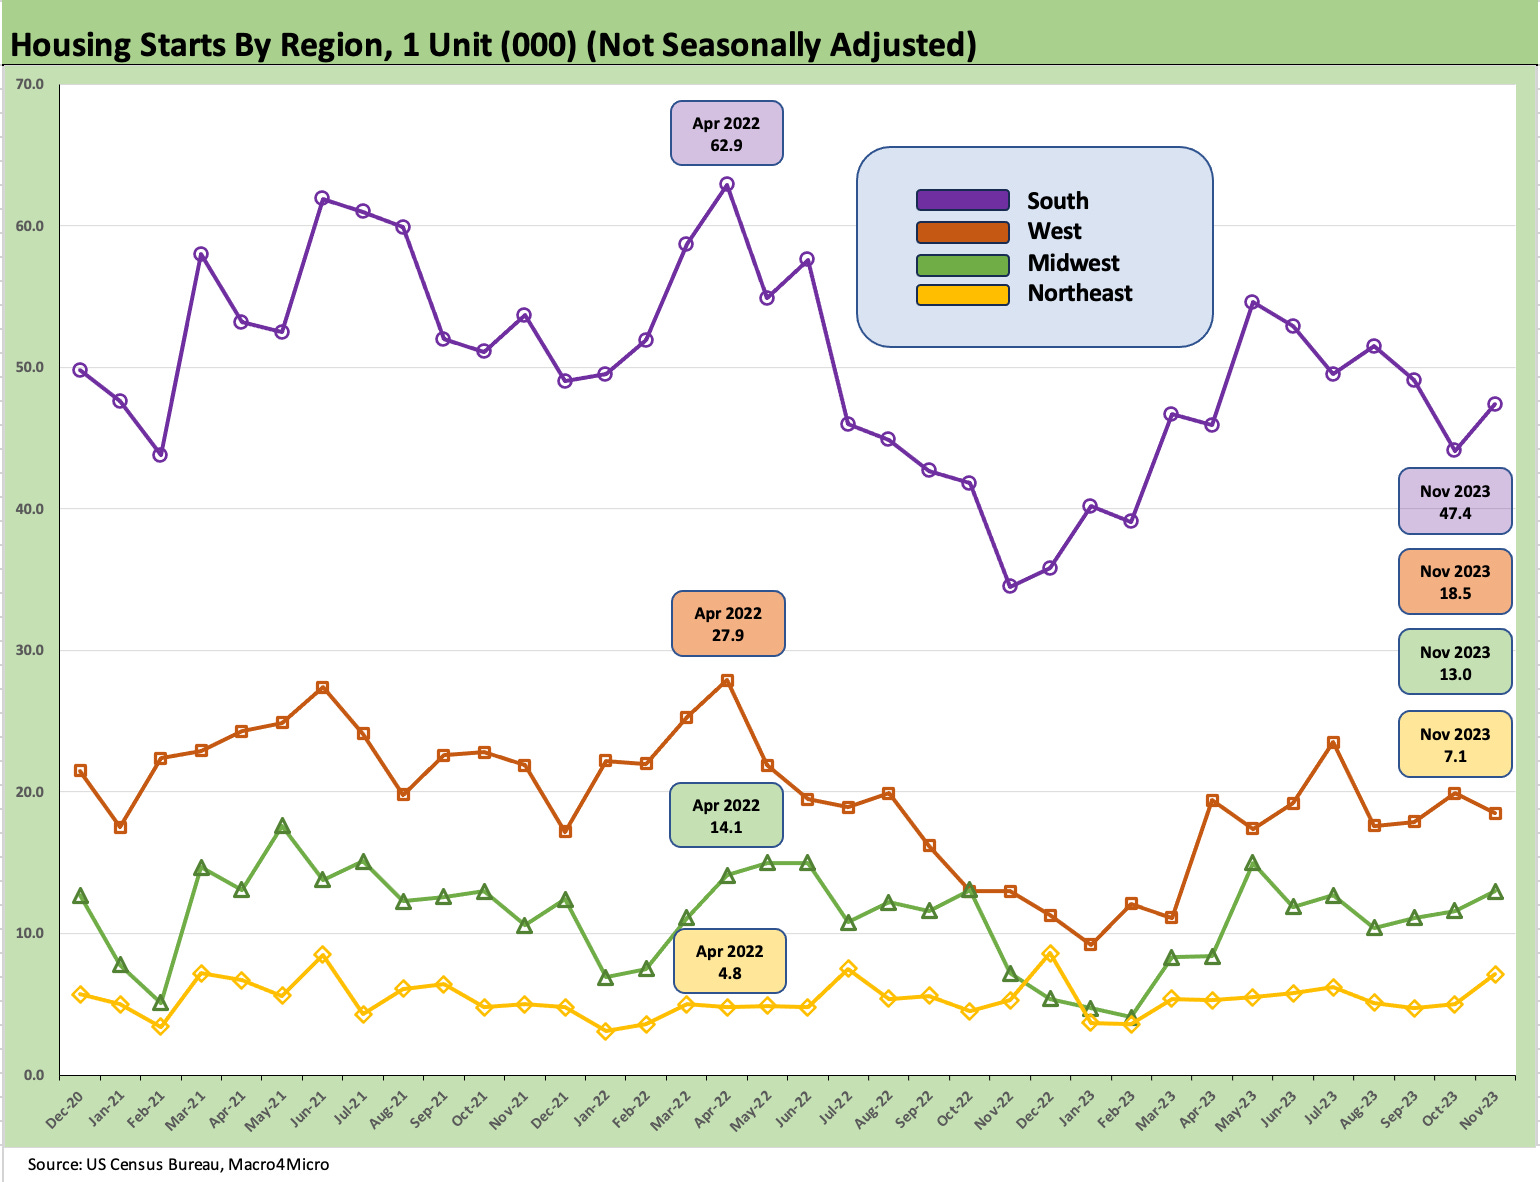
The above chart tracks the single family starts by region on an NSA basis with only the West region showing a downtick sequentially. The South region is ramping up off the lows of the tightening cycle. Given that the two largest markets in the South are Texas and Florida with a very wide range of price tiers, the mortgage rate impact will be a critical variable for the community planning of the major builders into 2024.
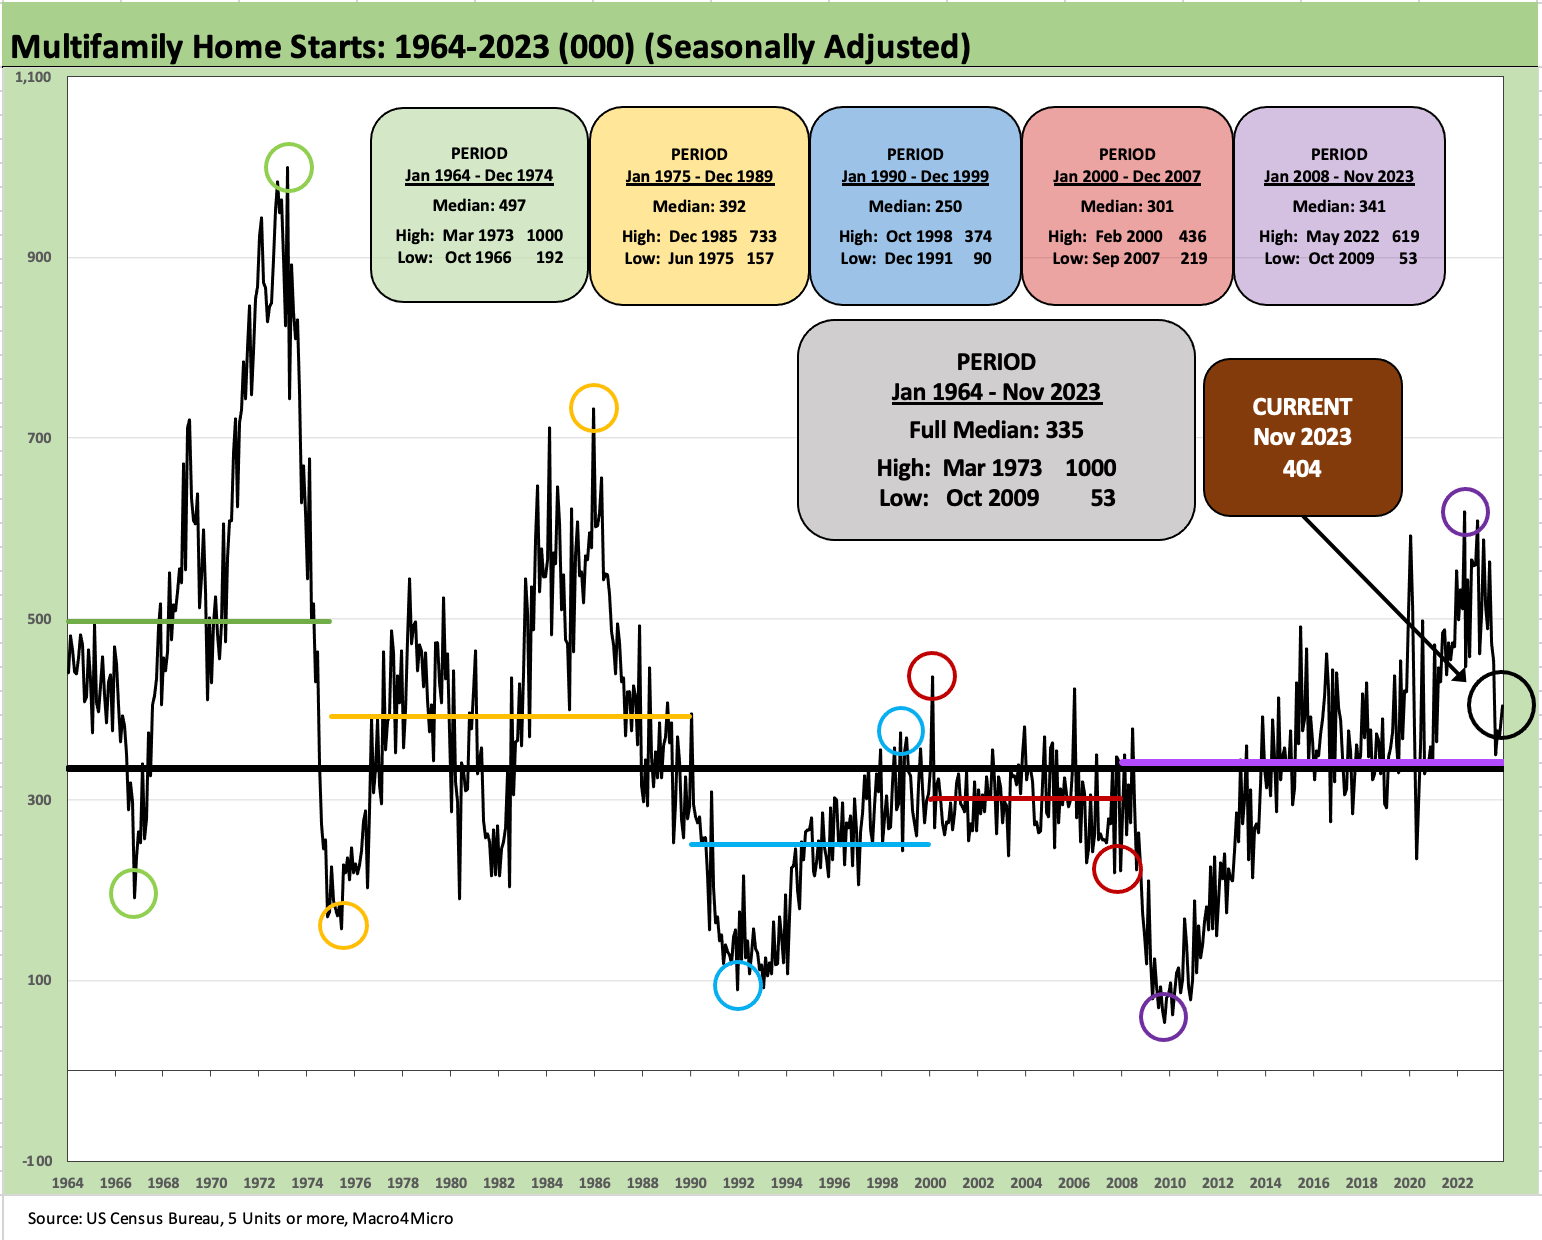
The above chart plots the multifamily 5+ units starts on a SAAR basis. We see current levels running well ahead of the long-term median and the post-crisis median as noted in the boxes. The total 5+ units starts moved higher sequentially at +8.9% but is down by -33.7% YoY as the supply coming on the markets is having some impact on rental trends and forward-looking project economics.
The hope for inflation watchers has been that rental supply will temper the shelter inflation numbers directly on rental inflation but also through the estimates of Owners’ Equivalent Rent (OER). Shelter is still the laggard and sticky piece of Services with CPI ex-Shelter at 1.4% (see November CPI: The Big 5 and Add-Ons 12-12-23). The Shelter line dominates the CPI index with a 35% share with 25.8% of that tied to OER.
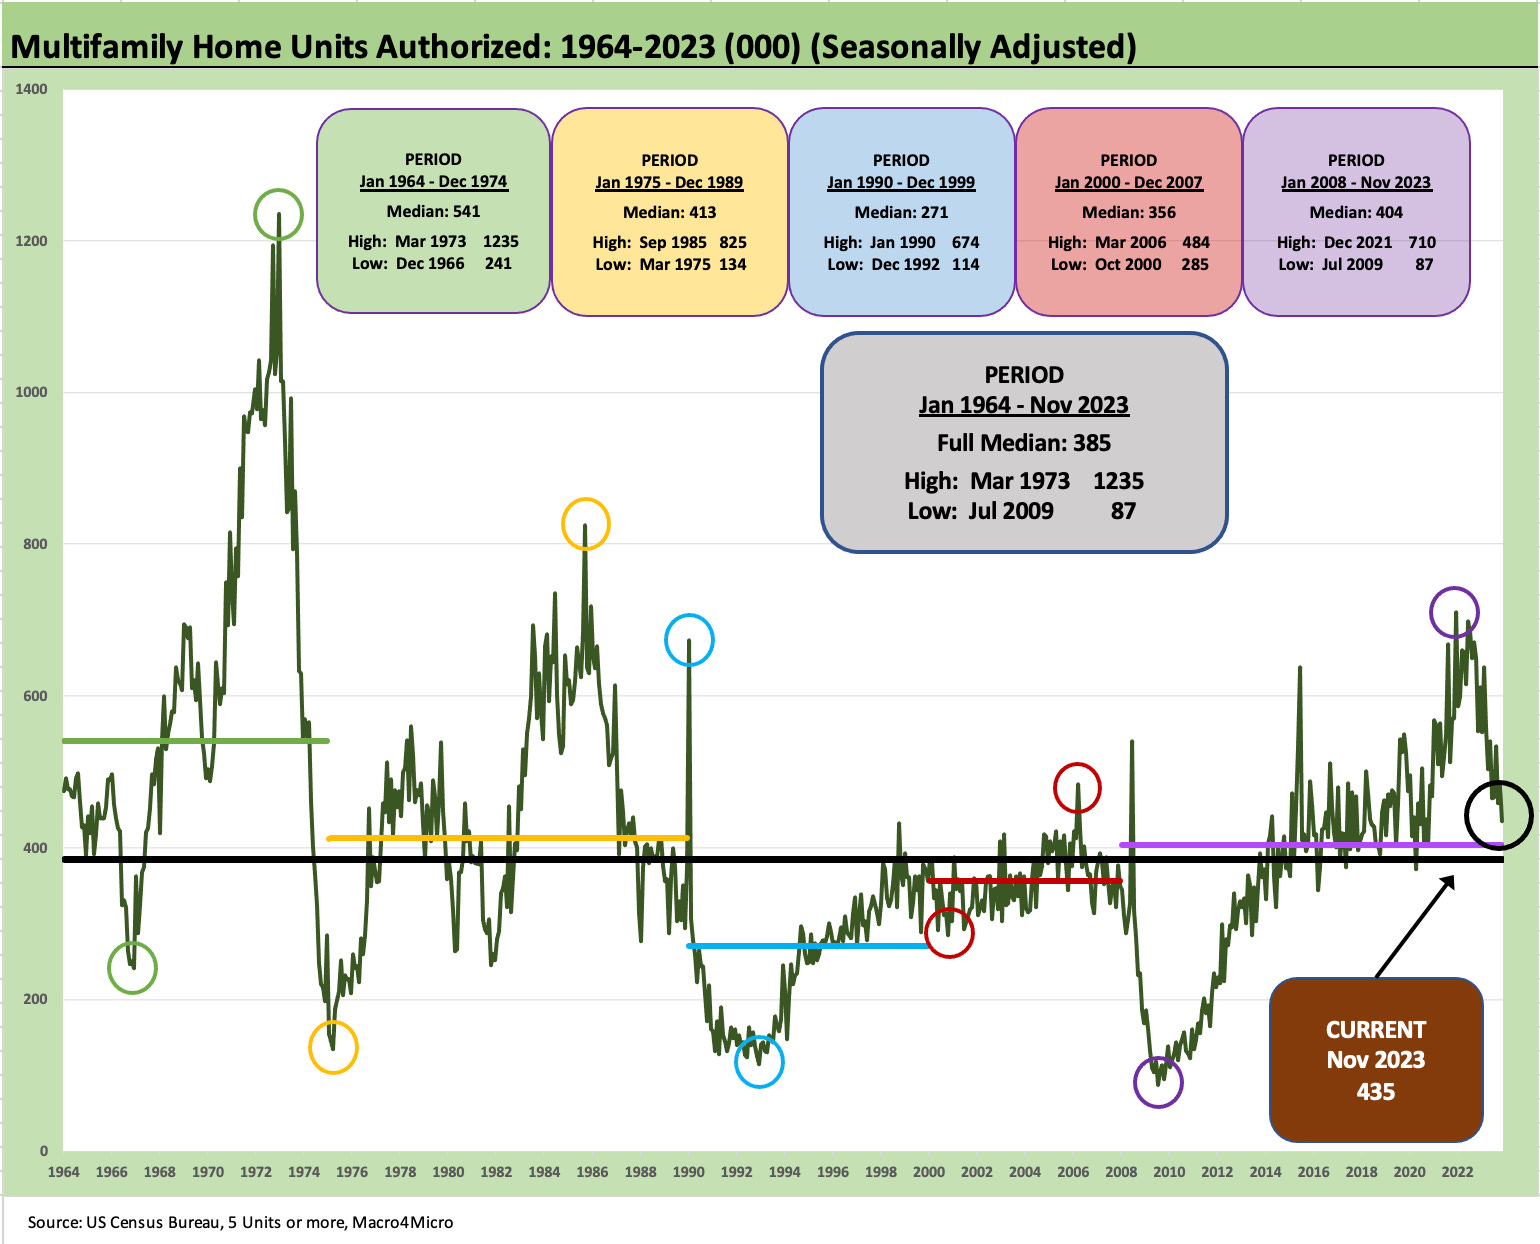
We wrap the housing collection with multifamily 5+ units permits, which are down sequentially by -9.6% and YoY by -21.3%. At 435K (SAAR), permits are running ahead of the long-term median and the post-crisis median as detailed in the boxes. As a reminder, the boom years of multifamily were back in the late 1960s and early 1970s. We saw a fresh but lower spike in the early 1980s and life was not as busy in the space until this latest wave.
Multifamily trends make for a complex story over the decades (demographics, affordability, migration patterns, zoning changes, etc.) with emerging variables such as single family rentals and growing suburban rental projects. The moving parts all make for a more multilayered analysis each year in total and by region. Those are topics for other times.
Overall, November numbers made for an impressive month for the builders.