
Credit Crib Note: CarMax (KMX)
We look at the fundamental and financial trends for CarMax as the incumbent leader in used car retail and a good microcosm for consumer finance.

Credit Quality Trend: Stable. KMX is facing a challenging market in used vehicle retail, but a strong market position, steady profitability despite the recent margin weakness, and a formidable advantage in balance sheet strength vs. peers tells a good financial risk story in a very competitive auto retail sector. The company does not have publicly rated debt and is not in any bond index, but it is a major counterparty with a substantial presence in non-recourse securitization markets.
KMX boasts a strong liquidity profile based on its cash flow and its $2 bn unsecured revolver (2028) that is fully available at 3Q24. KMX presents an investment grade risk profile and is an important bellwether for used vehicle industry evolution that is much larger (by units) than the new vehicle markets. Through its CarMax Auto Finance unit (“CAF”), KMX is a key lender to a consumer subsector that is useful to watch for the macro view on consumer credit.
Operating profile: We have dug into KMX in past commentaries (see CarMax: Credit Profile 7-9-23, CarMax 4Q23: Wacky Market, KMX Stays Steady 4-11-23), and detailed its market leadership position and strong operating model. Auto retail is seeing radical change and intensifying competition from digital business models and legacy franchise players entering the space in a bigger way.
KMX serves as a microcosm of the various challenges faced along the spectrum of operators from the traditional dealers including some making a more aggressive move into used cars (e.g., Lithia, Sonic) to the most aggressive online retail players (Carvana). For F3Q24 (Feb fiscal year), 31% of KMX revenue was from online transactions, up from 28% in F3Q23. The 3Q24 virtual/online wholesale auctions comprised 19% of revenue.
With its omnichannel strategy still rolling in as the incumbent leader and a dedicated focus on used cars (vs. franchised dealer competition), KMX results depend on steady retail volumes, a readily available supply of used cars for inventory, and customer credit availability. KMX needs both the supply and demand side (volume and price) to be working well to sustain margins and generate the desired return on their growing investments in facilities and technology platforms that comprise their omnichannel asset base.
As a competitor in a used vehicle space where unit volumes run from 36 to 40 million units in recent years, KMX has been steady and reliable in adapting to the secular shift in auto retail (see The Used Car Microcosm: Industry Comment 11-29-22). KMX offers securities holders the brand power, asset coverage, and operating strengths that are reflected in the largest market cap in the larger peer group of public dealers (the “Big 6”) and digital retail (Carvana).
Financial trends: KMX benefits from a strong balance sheet with debt to cap at a multiyear low and under its lease adjusted leverage targets of 35% to 45% (using 8x lease expense). Net debt/capitalization ex-rent adjustment is under 18%. KMX owns the majority of its properties and does not franchise its operations and thus fully controls an extensive real estate asset base.
KMX has ready access to all the liquidity options it needs to operate in a market where earnings for the industry are weakening, financing margins have narrowed, customer asset quality is weaker relative to peak levels, and loss exposure on repossession is higher. KMX has an all-unsecured capital structure of revolver, term loans and small unsecured private bonds on a balance sheet that is otherwise dominated by non-recourse securitized debt.
When looking back across fiscal years, it is important to remember that FY 2024 ends at the end of February, and the start of the time series above from 2/29/20 (leap year) ended before COVID spiked in the US.
KMX has two reportable segments with CarMax used car sales operations and CarMax Auto Finance (“CAF”), so the business lines are straightforward.
The wild ride for used cars across price and volume saw used car valuations go through some stunning and unprecedented moves in recent years as the markets were “schooled” on the interplay of OEM supplier chain risk, auto production rates, disruptions in trade-ins and leasing, dealer inventory struggles (new and used), and sourcing challenges that drove swings in used car prices and that flowed into profit margins.
The F3Q24 quarterly release (11-30-23) is the recent quarter detailed herein, and it was respectable relative to market conditions with KMX stock initially popping by over 5% in a broader rally for auto retail.
After the last quarter reporting, the market had been handicapping lower rates in the shorter segment of the curve that sets the costs, for dealers and customers, in auto financing.
Lower rates would lower inventory costs, improve affordability for customers, and ease provisioning pressure on new origination at CAF. The problem is that UST curve optimism has not held into 2024.
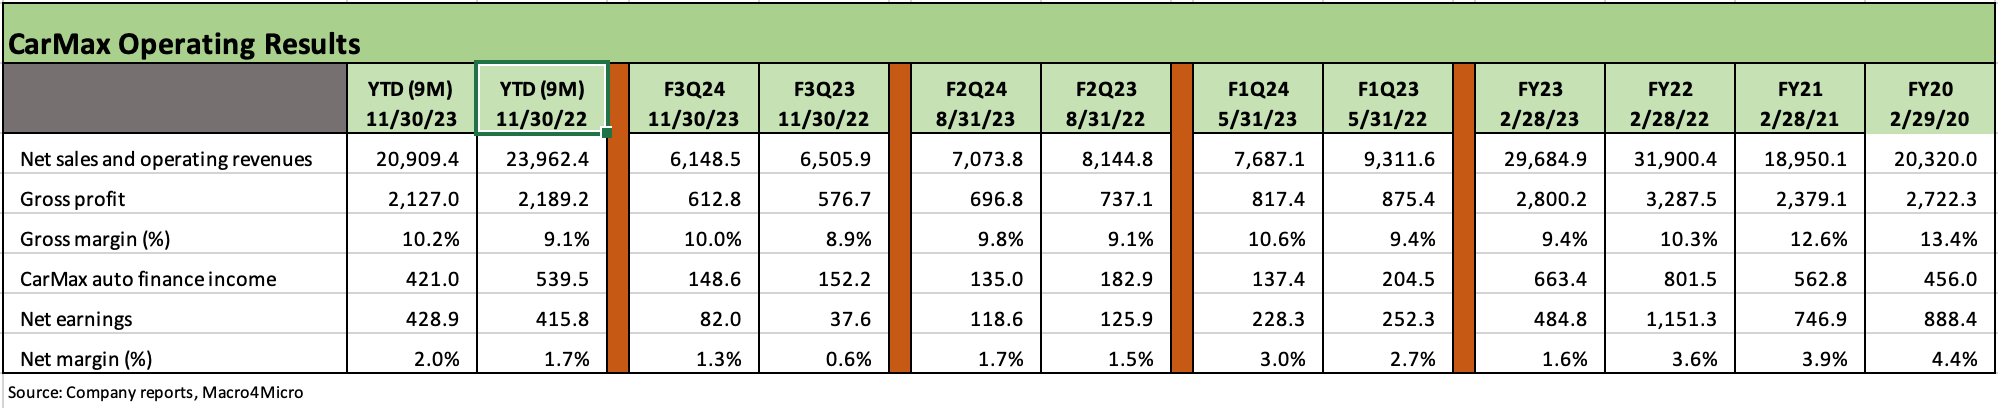
FY 2023 (2-28-23 fiscal year) marked a multiyear low in profit margins as gross margins dipped into high single digits at 9.4% and KMX posted a 1% handle net margin on the bottom line.
Gross margins have battled their way back up across the 10% margin line YTD F3Q24 despite volume and price weakness in both retail and wholesale for YTD.
Demand and used car pricing are down sharply from the distorted volumes of the COVID whipsaw, but affordability of late model used cars are still benefiting from tailwinds of strained new car affordability and shifting consumer preferences toward used cars and notably in the age of student loan stress.
The secular shift toward a preference for late model used cars translates into a steady and reliable floor for demand under a range of economic scenarios for employment, wages, and household financial trends.
Broadly, a key problem for used cars has been the supply for resale, including off-lease, slower trade-ins during 2022-2023, a strained supply of certified pre-owned vehicles (“CPO”), and lower car rental fleet turnover volumes among other factors.
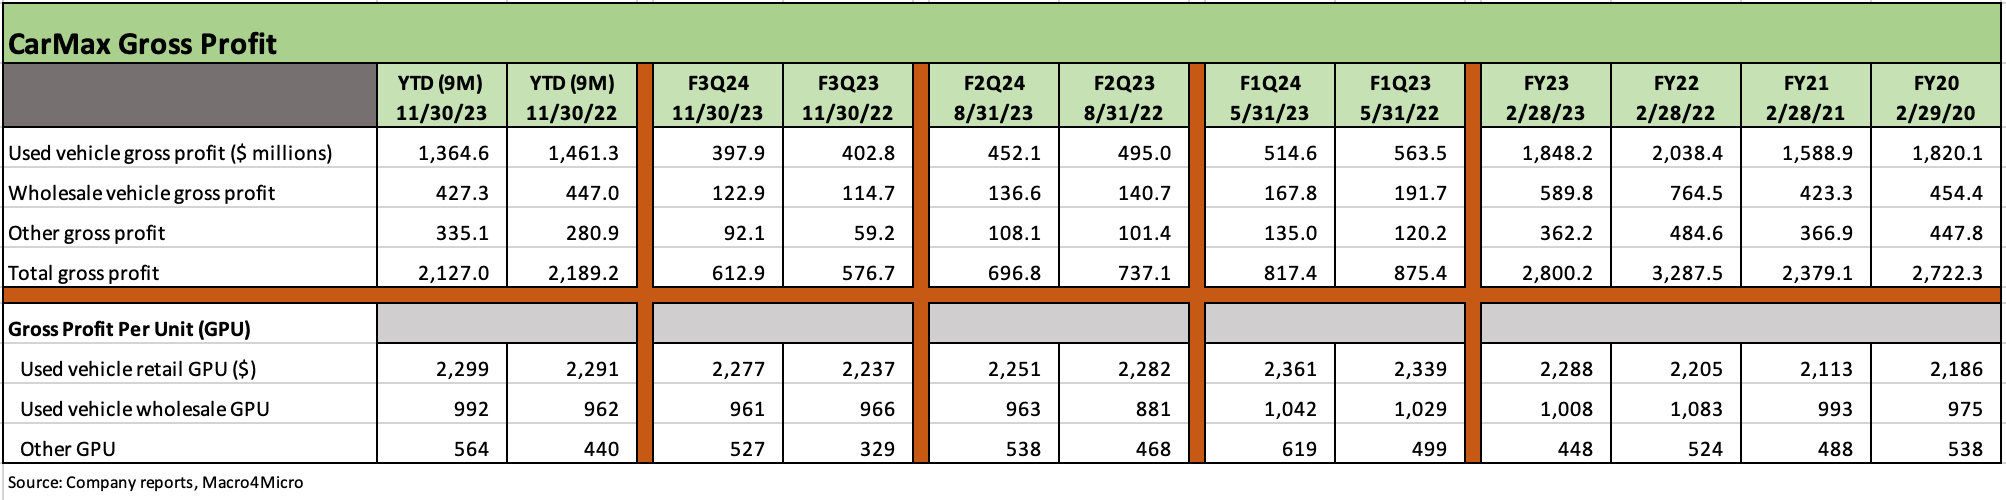
The table above breaks out total gross profit and gross profit per unit (GPU) for retail, wholesale and “other” with gross profit down YTD through 9 months. CAF income is broken out separately in the earlier chart.
“Other” includes service department revenues, extended protection plans (EPP), and net third party finance fees (the riskiest customer finance is typically handled by third parties).
The seasonal peak selling seasons of spring and summer saw YoY declines in total gross profits for F2Q24 (8-31) and F1Q24 (5-31) with weakness in total retail gross profit.
Retail gross profits were down again for quarterly and YTD YoY for F3Q24 (11-30-23) while wholesale was down YTD but up YoY for the quarter. Including “Other,” the total gross profit line was lower YTD but higher for the F3Q24 quarter.
Gross profits justifiably get a lot of attention, but we always emphasize that volume is critically intertwined with per unit metrics to drive cash flow. We detail volumes and prices in the next table.
The volume X factor remains weak for the headline used car players whether CarMax as the leader and incumbent in the space or for the online-focused players (notably Carvana).
Too much focus on per unit profits can give a false sense of security with some of the cash bleeders such as the highly leveraged (and historically EBITDA-starved) Carvana urgently needing more than high unit margins. CVNA needs higher unit margins and much higher volumes. There is a reason CVNA needed to restructure its debt.
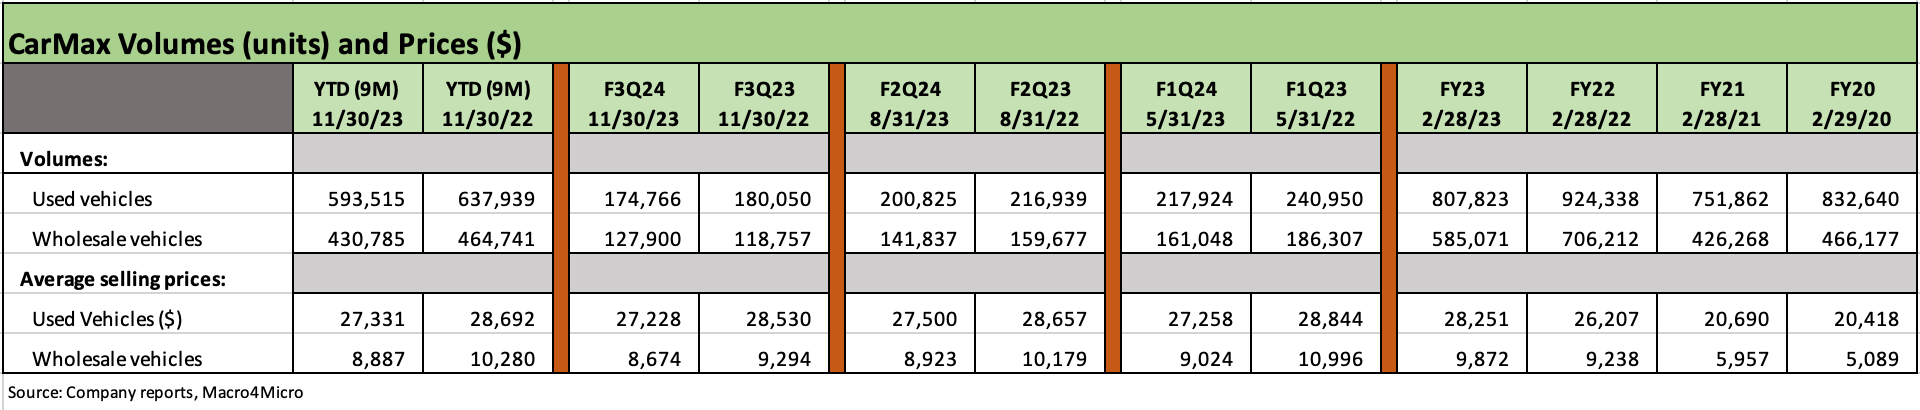
The negative trend line in volumes from calendar year 2022 into 2023 is clear in this volume and price table with soaring numbers for both retail and wholesale units from FY 2021 into FY 2022.
FY 2021 was the year of COVID (10 months of FY 2021 was in calendar 2020), and the industry was notable for a supply crisis in vehicles broadly (new and used) as supply chains melted down and stayed under pressure and semiconductors served as a massive auto sector headwind.
The rebound for vehicle demand in calendar 2021 came up against severe shortages in both new and used as the imbalance shows up in both retail and wholesale prices in FY 2022.
The car shortage during COVID and its aftermath drove an upward spiral in used car prices into calendar 2022 with a $28K average price on used retail vehicles in FY 2023 peaking at $28.8K during the May 2022 quarter and $28.7K in the Aug 2022 quarter.
As the industry leader, the pricing history since calendar 2019 (FY ended 2/29/20, a leap year) captures the soaring used car price off the starting point of that year in both retail ($20,418 for FY 2020) and wholesale prices ($5089 for FY Feb 2020). Retail almost reached $29K in the May 2022 quarter and wholesale almost $11K in the May 2022 quarter).
The peak for used car pricing has been amply covered in our monthly CPI commentaries across 2022 (see Automotive Inflation: More than Meets the Eye 10-17-22), and the market has gained a lot more insight into the distortions created by new vehicle supplier chains and how that flows into used car supply-demand imbalances.
That market has experienced more than its share of outsized used car price swings in late model used cars that drove car rental profit margins off the charts as they sold used cars into the market at times when prices could be above a same-model new car just on the basis that the used vehicle was available.
An important consideration in looking at used car retail and wholesale prices is that lower prices on the selling side has to maintain some semblance of balance with the costs of those used cars on the sourcing side. Used cars need to be sourced in the markets (auctions, dealers, consumers) for those that do not have captive trade-ins and off lease supplies. That is the KMX and CVNA challenge.
The competitive dynamics of “sourcing” a reliable used car supply at the right price and on a large scale is a critical top line as well as gross margin variable, and KMX has been able to prove its strengths and competitive advantage by being able to reliably meet supply needs from dealers, households, and wholesale supply sources.
The legacy franchise dealers have intrinsic advantages on lease returns and trade-ins, and that sourcing battle will continue to get monitored against a weaker backdrop where the franchise players, the leading incumbent (KMX), and upstart online retail payers will be fighting for a finite supply of units while trying to pitch a revenue and earnings growth story.
As a sourcing frame of reference, during F3Q24, KMX bought more cars from consumers and dealers (250K total) in F3Q24 than the prior year with 228K from consumers and 22K from dealers. Slightly more than half of the consumer sourcing came from the company’s “online instant appraisal” service.
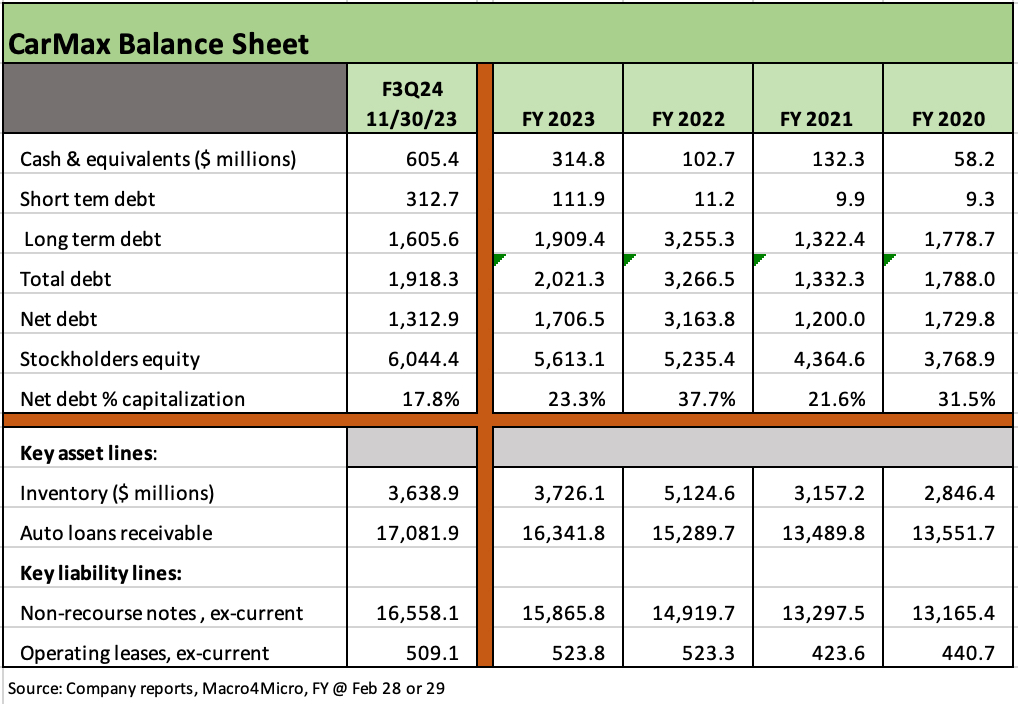
The KMX balance sheet is the swing factor in the KMX story with securitization and nonrecourse debt being the primary funding mechanism for operations with high quality and liquid receivables the primary asset base that is funded. We detail the asset quality history in a separate chart for CarMax Auto Finance further below.
The KMX balance sheet is investment grade caliber with debt to capitalization at 17.8% at 11-30-23 and just over 10% if we adjusted capitalization for the market value of KMX common shares (2-20-24).
To be clear, KMX bonds are not rated by the major agencies. From the KMX website: “At present, we have no publicly traded debt, and therefore the credit rating agencies have no ratings on the company.”
The unsecured revolver, term debt and limited amount of bond borrowing are unsecured, underscoring the financial flexibility of KMX to navigate almost any realistic economic scenario.
The chart above also breaks out inventory and auto loan receivables set against non-recourse notes and leases.
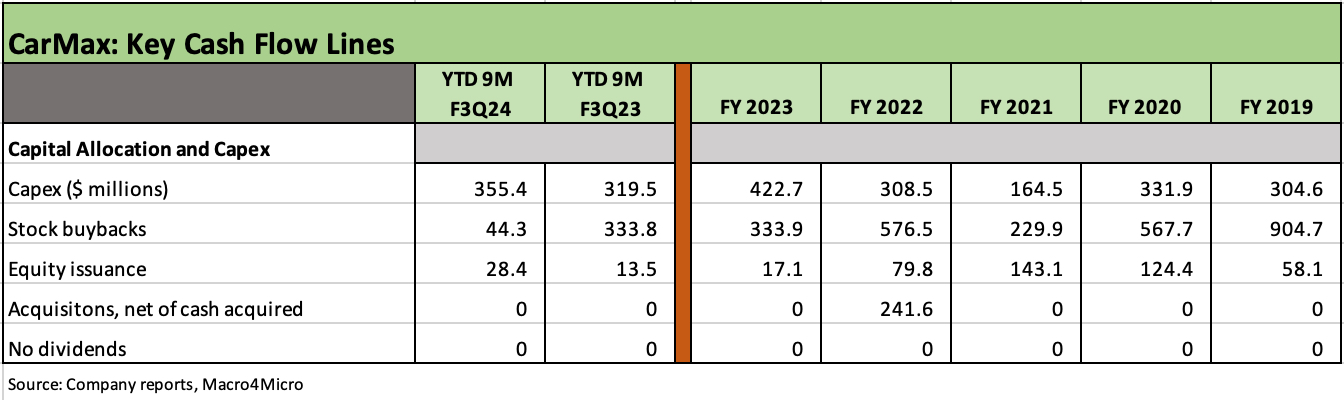
CarMax shows relatively low capex intensity with respect to recurring capex demands although investment in technology and retail locations will remain an important factor as the omnichannel capabilities continue to get built out by the company.
We have seen capex rising steadily in recent years for “growth capacity initiatives and technology.”
As of the end of FY 2023, KMX owned 157 of its 240 sites with 83 leased, which underscores the financial flexibility and additional asset protection of KMX.
KMX does not pay a dividend and has a primary goal of reinvesting in the business combined with stock buybacks to return cash to shareholders.
Buybacks slowed in FY 2024 as the tightening cycle pressured business conditions but resumed in the November quarter under its $2.4 bn remaining buyback authorization.
M&A has been limited with the exception of the purchase of Edmunds in FY 2022 for $402 mn (cash, stock, preexisting investment at fair value).
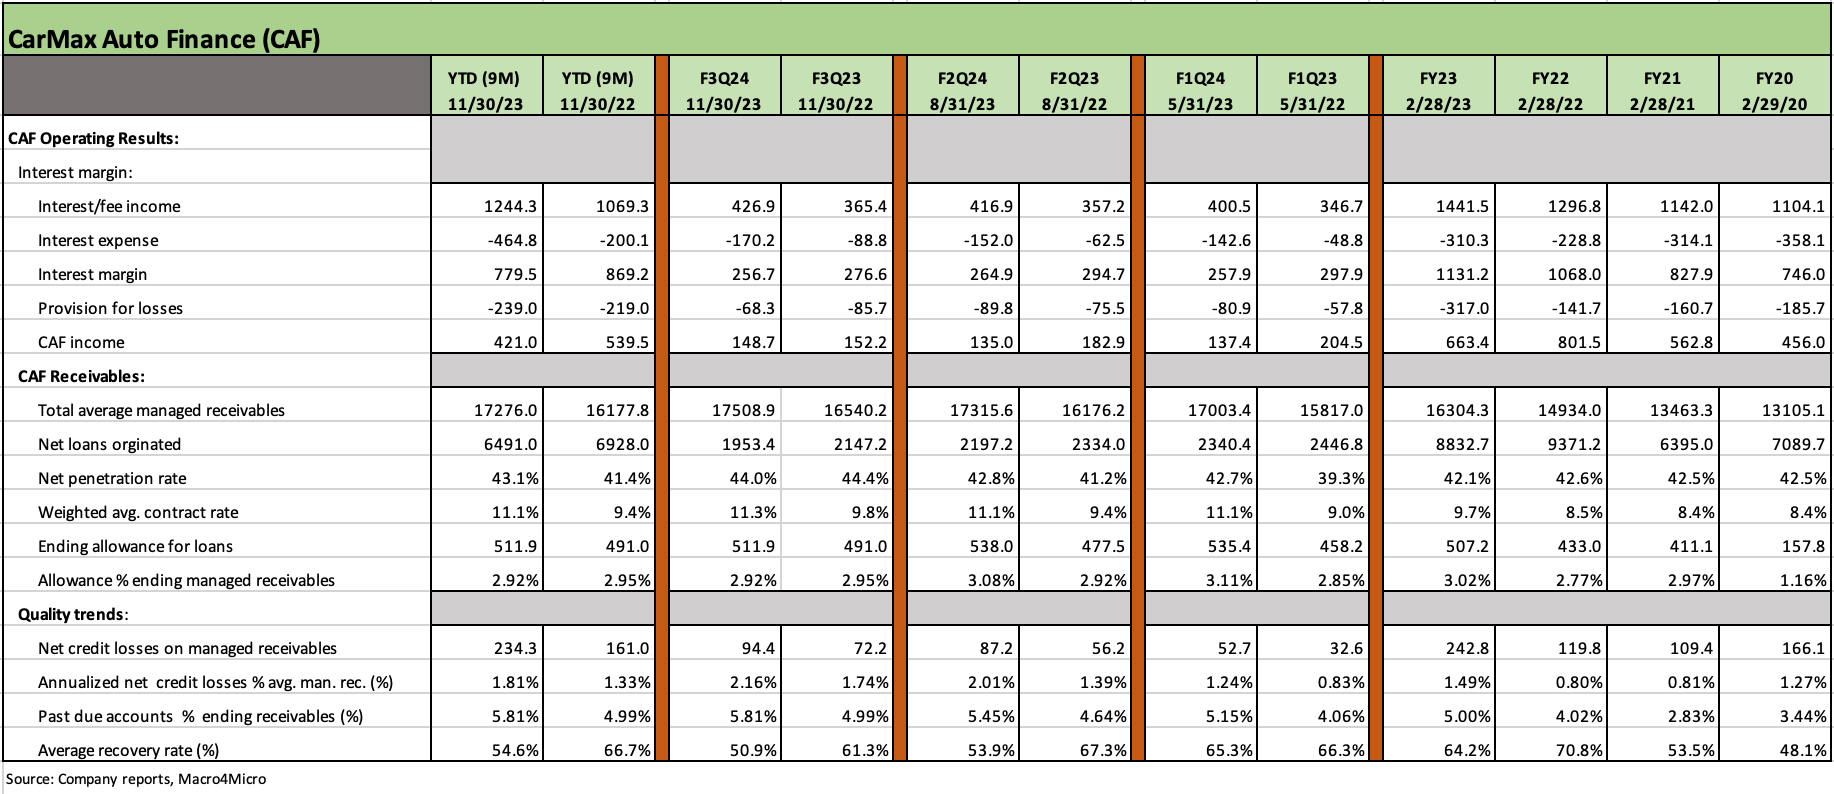
KMX operates a solidly profitable finance operation in CarMax Auto Finance (“CAF”) with the steady growth of managed receivables consistent with the growth of the company’s operations and notably after the used car demand spike.
Originations started to drop off with the tightening cycle and more onerous affordability pressures tied to borrowing rates and rising monthly payments.
With over $17 bn in managed receivables and 43% net penetration rate (vehicles financed as a % used vehicles sold), the CAF operation has proven to be an important part of the KMX growth plan. CAF serviced 1.1 million customer accounts as of 11-30-23.
Contract rates rose to 11.3% for F3Q24 and 11.1% YTD, and that mitigates some of the damage done by the tightening cycle and the squeeze on interest margins and CAF net income. The interest margin was lower YoY and YTD as broken out in the chart.
Credit losses have been prudently managed in the lending operation and reserving policies have been adequate with rising credit losses still well inside recurring provisions for current production and allowances already on the books.
The reserve of 2.9% of receivables at the end of F3Q24 comfortably exceeds net credit losses that have been running at multiyear highs near 1.8% YTD and at 2.2% for F3Q24 (quarter ended 11-30-23).
An important fact is that the overall portfolio is in the high-quality range with an average credit score of 718 YTD F3Q24, which is the highest of the periods shown. CAF has its own separate scoring model using a wide range of sources and does not rely on FICO in its primary scoring model. We view that as a positive factor.
Used cars are often associated with subprime, and that is an inaccurate generalization in the age of high price used cars. Subprime is a distinct lender base that CAF can tap as third-party lenders.
Past due accounts ticked higher to over 5.8% (30 days or more with the bulk in 31-60 days).
KMX lenders and stockholders will be watching the provisioning expense line (-$68.3 mn in F3Q24 vs. -85.7 mn in F3Q23) after it was lowered at a time when losses are materially higher YoY. KMX expected questions on the topic and had somewhat reasonable answers that will get gut checked for adequacy with the 4Q24 disclosure (2-29-24).
The average recovery rate is a function of the repossessed vehicle’s value relative to the outstanding loan balance when the vehicle is repossessed and liquidated. The range has been from a low of 46% to a high of 71% during FY 2022 with the high end of the recovery range related to the very favorable used car backdrop at the time. That recovery rate is now declining and will be a risk to monitor with loans made during an inflated period for used car prices.
HISTORY AND HIGHLIGHTS
CarMax started under the ownership of Circuit City Stores in 1993 and was spun off as of Oct 2002 into an independent company with its home offices in Virginia. Circuit City filed Chapter 11 in Nov 2008 and shifted into Chapter 7 liquidation in Jan 2009 and ceased operations in 1Q09.
At $11.4 billion (2-20-24), KMX boasts a larger equity market cap than any of the established publicly traded franchise dealers with Penske Automotive Group (PAG) the largest franchised dealer market cap with $10.0 bn with its non-US and luxury-heavy brand mix.
The expansion of online initiatives and the omnichannel strategy (“omnichannel” as a combination of online and human interaction and brick and mortar experience at the customers preference) is bringing benefits that offer more than a store-only model and allows for more operating leverage to the upside on the other side of the fixed investment in the technology buildout.
The online transaction mix as defined was 14% of retail sales vs. 12% the prior year while 55% was “omni,” up from 52% the prior year. KMX clearly wants to get more online buzz behind its equity given the valuation reward they see in CVNA, who was heading to default and a liquidity crisis without a bondholder bailout (see Carvana and Uncertain Used Car Dynamics 10-5-23, Carvana: Smoke Signals Get Smokier 6-9-23). The discounted earnings benefits being awarded to CVNA tell a good story about how much the market values online themes.
KMX cites a 70% rate of customer usage of digital capabilities in FY 2024, up from 40% in 2020. 10% of those who fully complete an online transaction are likely to be new customers.
Omnichannel effects include a rising share in markets where no new stores have been opened since 2014, so the leveraging of digital transactions has been tested and affirmed by management. Growth rates have risen in the targeted markets.
“Instant offer” is an online consumer facing appraisal service that has supported purchases and sales volumes. KMX cites online finance-based shopping as critical for lead generation and the #1 source of leads. That highlights the role of CAF in direct support of earnings as well as playing a role in sales and sourcing.
The Edmunds acquisition offered another mix of channels reaching customers and dealers as part of their strategy to leverage their brand name and online investment/capex and feed both retail and wholesale activity.