

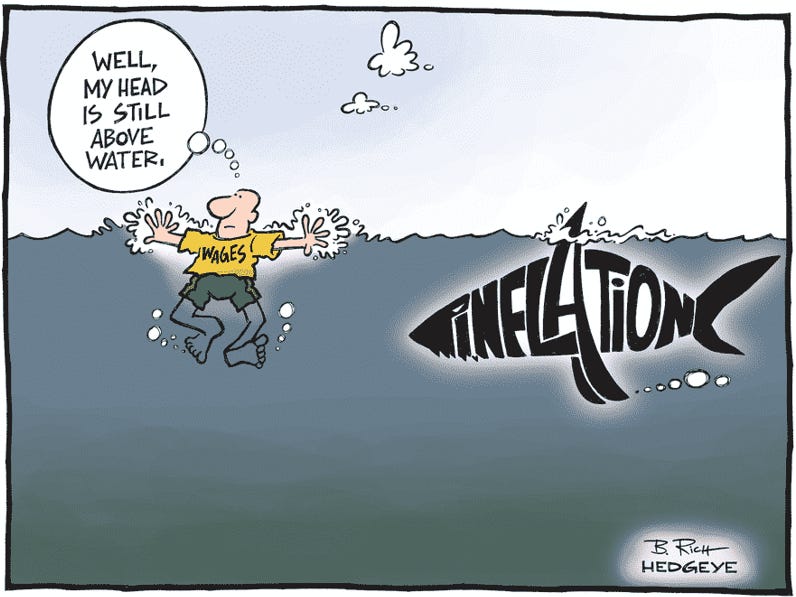
PCE inflation is still running well above target while the macro picture shows favorable income trends and solid consumption. That eases cycle nerves and mirrors favorable trends seen in the PCE growth revisions seen in 2Q26 GDP (see GDP 2Q26: Bullish Final Revisions 9-30-26, Macro Dance-Off: PCE Growth vs. Fixed Investment 10-2-26).
The latest PCE release shows price metrics in a tight range with the August headline price index at +3.4% (vs. 3.4% in July restated from 3.7%). That 3.4% in Aug is down from the 3.8% high in May (restated). Core PCE is in a tight band at 3.0% for the past 3 months after restatements (July was 3.3% before restatements). Headline and Core PCE inflation were thus unchanged as restated.
The frequent restatements of inflation always raise flags in a country where 40% of the country is looking for Communists in closets, 40% looking for fascists under the bed, and 20% that do not give a damn either way. The data changes can be unsettling given the stakes and politics (remember when the BLS head was sacked?).
Consumption (PCE) vs. income (DPI) showed a confident (or financially stretched) consumer with MoM current dollar DPI up by 0.3% vs. current dollar PCE at +0.9%. That sent the savings rate back down to 4.1% in August from 4.6% in July and to a low point for 2026. Declining savings rates can be a Rorschach Test on whether the consumer is taking more financial risk (e.g. credit cards) or feels more confident to spend. It can be as simple as higher gasoline and food prices with lagging wage growth.
We reviewed MoM personal consumption expenditure (PCE) lines, and there are plenty of examples of sequential strength, notably in Goods and the subset of Durable Goods. That includes “Motor Vehicles and Parts” where the industry has been reporting better- than-expected volumes and steady 16-handles into 2026. We saw good MoM consumption numbers in select consumer “mood signals” such as “Food Services and Accommodations.”
In the PCE trenches, prices have been mixed. Services at +3.4% posted minimal movement YTD. The YoY price index for Energy Goods and Services rang the bell at +16.8%, up from 15.1% in July but below 23.7% in May. Total Goods YoY was 3.6% with 2.6% for Durables and 4.1% for Nondurables. That is materially higher from Jan 2026 when Goods was 1.2%, Durables 2.0%, and Nondurables 0.8%. PCE ex-food, energy, and housing is 3.0% vs. 2.9% in Jan 2026 within a narrow range YTD 2026.
The bottom line is that inflation does not support easing but is not a major threat at this point based on the August trend.
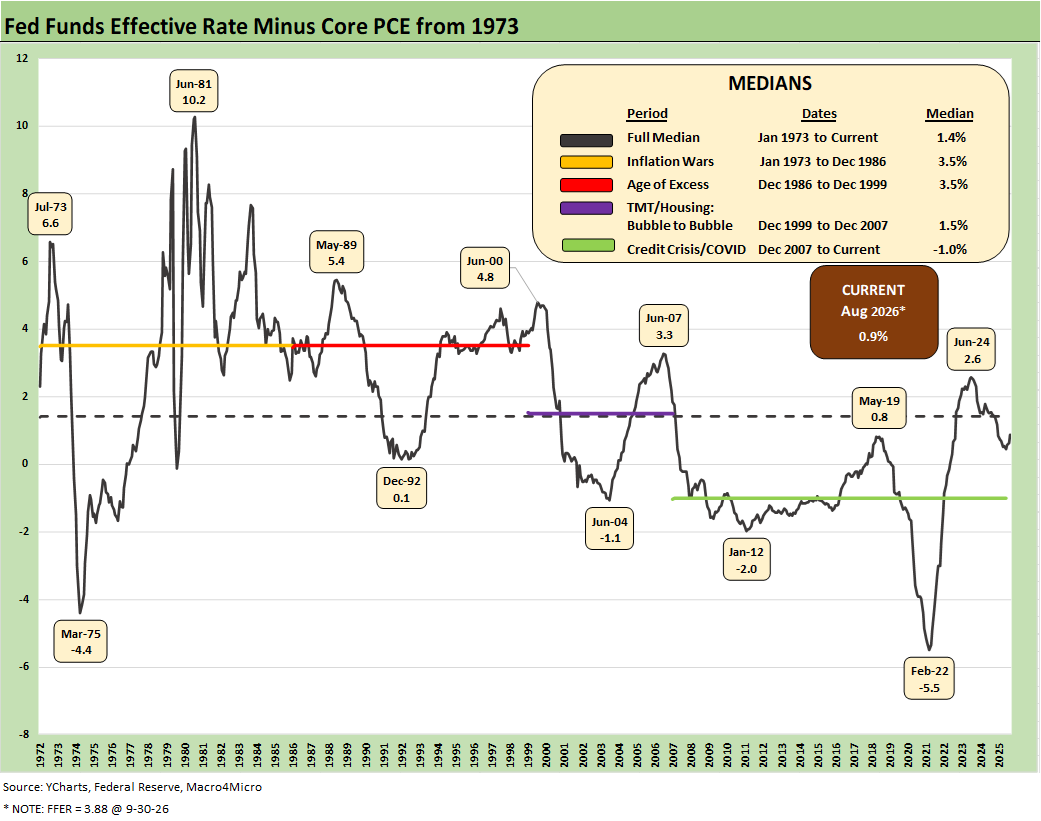
The above chart frames the timeline for “Effective Fed Funds minus Core PCE.” For this latest August measure, we see the differential at +0.9% vs. the long-term median of 1.4%. The current differential is not much of an inflation deterrent, but it is better than the negative fed funds rate being advocated (demanded?) by Trump. A slight uptick in inflation with an easing demanded by Trump would take the market back to negative real fed funds.
If one sees inflation moving higher and demands from the White House for less than 1% distracting the FOMC, inflation discipline will have been abandoned. The initial action in September reassured the market.
Core PCE is the favored metric, and that sits at 3.0% for August. The odds per FedWatch of an October hike to 400-425 are now down to 24.9%, which is down from 68.6% one week ago. The odds of 1 FOMC hike to 400-425 by the Dec 2026 FOMC meeting is at 61.3% late today. The odds of 2 hikes to 425-450 by Dec 2026 stand at 18.1%, down from 54.6% 1 week ago. The PCE release supported that move, and we will see what the payroll numbers and wage information bring on the way to CPI data in October.
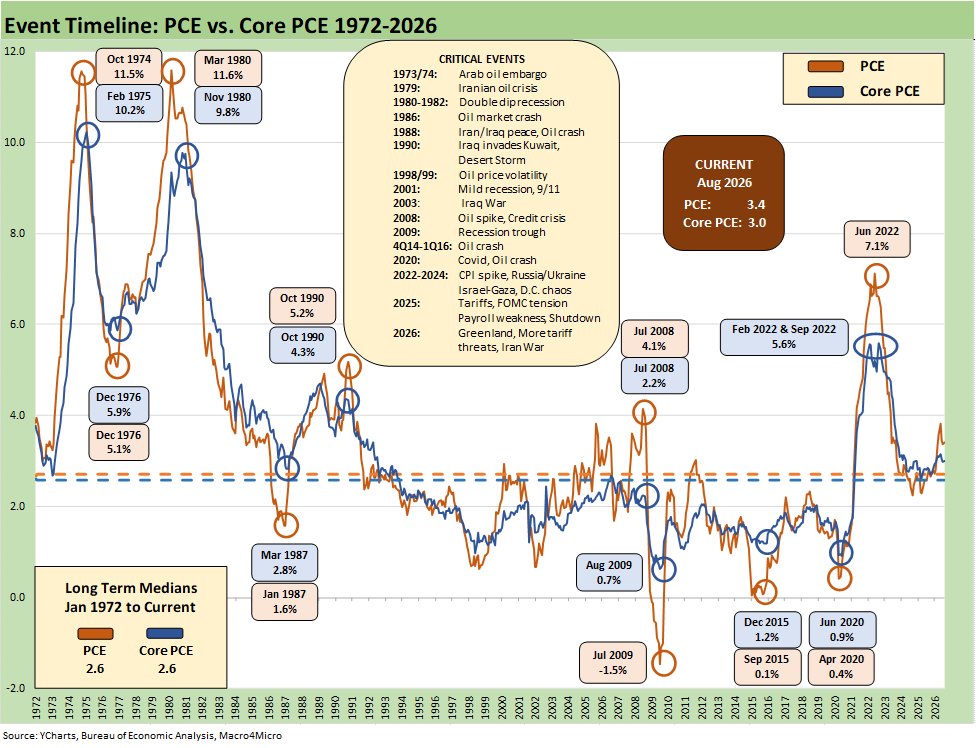
The above chart updates the long-term time series from 1972 for PCE vs. Core PCE across the decades and cycles. We see the 2.6% headline PCE long-term median in the lower left (well below the current 3.4%) and the 2.6% Core PCE median (vs. current 3.0%).
The peak 3.8% (as revised) PCE headline in May 2026 was dramatically better than where we came from in June 2022 at 7.1% PCE. The current 3.4% headline is still well above the 2.0% target and has remained stubbornly high/higher in 2026.
In the context of 2025-2026, the headline PCE price index was 2.7% in Jan 2026 and was 2.6% to start Trump 2.0 before the ensuing moves higher. It is clearly higher (that is a fact). Iran was the dagger in the lower inflation story after 2.8% in Feb 2026 on the way to the rise to 3.8% in May 2026.
The energy shock, tariffs, and the various materials and commodities turmoil (aluminum, copper, etc.) are flowing into a range of PPI, Goods, and Services lines as the effects reverberate. Oil and downstream effects are pervasive across the economy with the downstream refined products such as diesel grabbing headlines.
The diesel damage is broad based, but that also comes ahead of what could be some less pervasive home heating oil challenges with colder weather ahead. Maine has one of the highest heating oil shares in the country at around 50%, so Senator Collins is hoping for a heat wave before Election Day. New Hampshire (over 30% home heating oil) is getting hit hard and Sununu is praying for balmy weather as well.
As someone who grew up with home heating oil in Massachusetts, those big bills for filling up early in the season can take a major bite out of household cash flow. It is not like a quick gas station trip off the highway. It might cause some mood shifts ahead of Election Day.
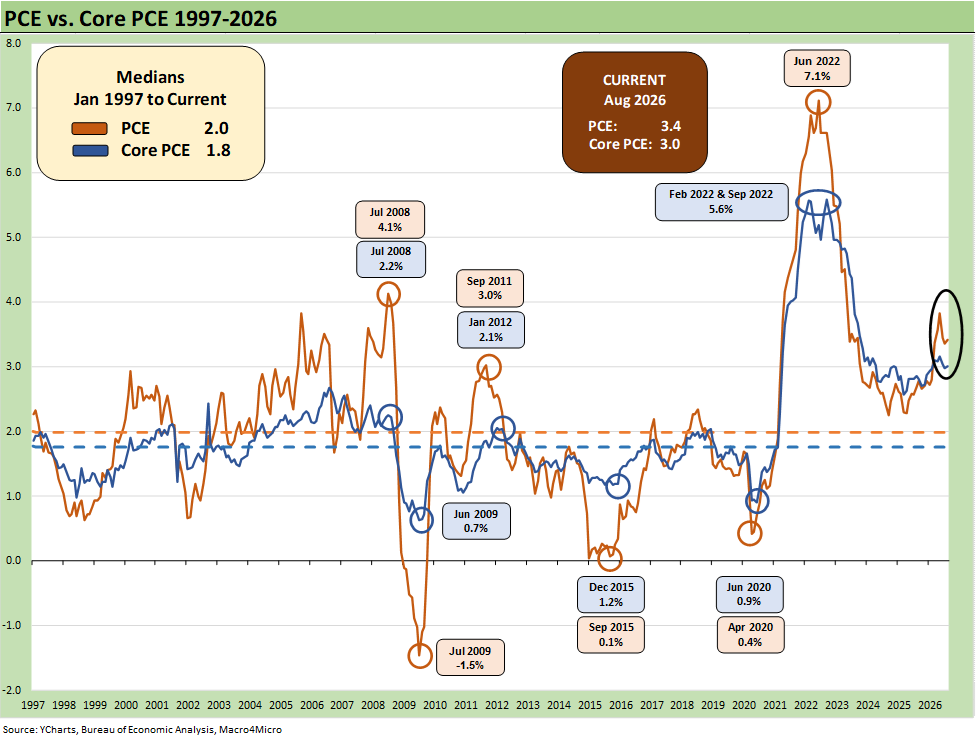
We include the 1997-2026 timeline above as it offers a useful frame of reference on the PCE target of 2.0% that is routinely discussed by the Fed and in the markets. The shorter timeline from 1997 offers a better visual scale separate from the wild 1970s and 1980s.
The “1997 to 2026” period presents a rare stretch at or below the 2.0% PCE line and Core PCE median as noted in the chart. It took a lot to go wrong in that time horizon at the systemic level and in terms of macro shocks to cross below or at that 2.0% threshold. The events along the way included tech bubbles bursting in 2000-2001; oil crashes in the late 1990s and in the late 2014 to early 2016 period; and a bank system crisis from 2008 to 2011 (including sovereign stress) to get us there. The COVID pandemic in 2020 was a new one for the modern capital markets.
That gets us back to the debate over what is the correct formal inflation target or the “closet target” somewhere above 2%. There is not likely to be a formal change in the target, but the current backdrop would be missing it regardless. Warsh cites what is “to the left of the decimal” (i.e. “2” or “3”) matters the most. As of May, he was at a “4” before the later revisions. He is now at a “3” to the left.
Warsh is leaving himself a lot of room even as he buys time with his working groups and lack of clarity in messaging. Standing up to Trump with the recent hike in a 12-0 vote bought some credibility.
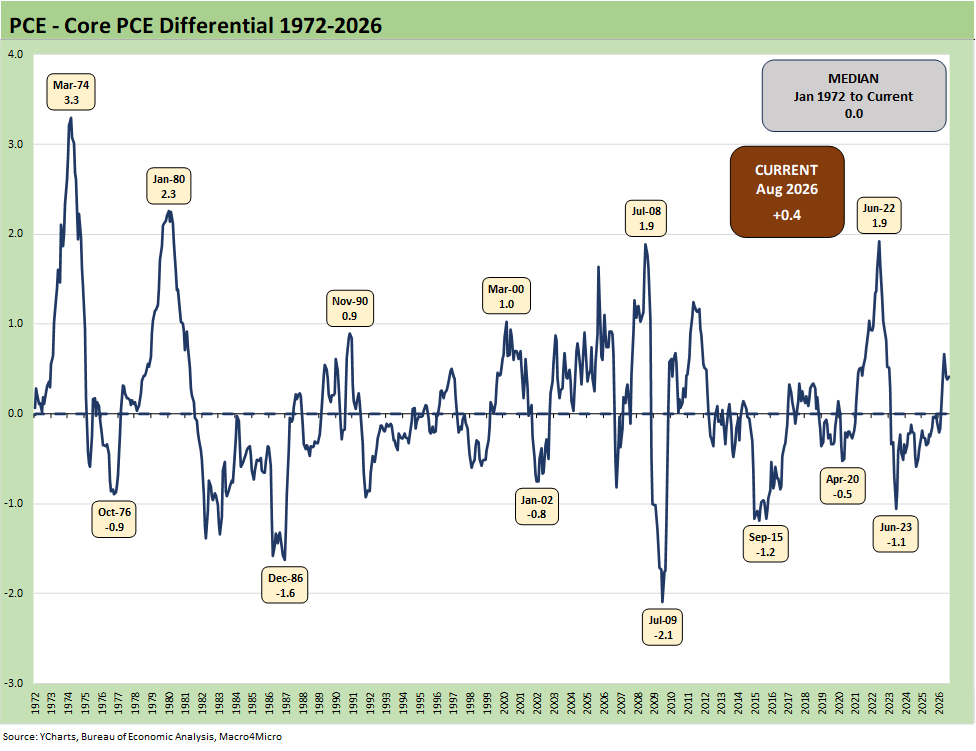
The above chart frames the long-term differential history between PCE and Core PCE since 1972. The long-term median differential is zero and we are currently at +0.4%. The volatility around that compressed long-term median ties into the energy wildcard with some food distortions also back in the 1970s.
We look at some of the CPI energy and food inflation moves in separate commentaries (see Inflation: The Grocery Price Thing vs. Energy 12-16-24, Inflation Timelines: Cyclical Histories, Key CPI Buckets11-20-23). Food, gas, and electricity inflation have been near the top of the affordability political rage-fest in this cycle. Households have been hit hard by energy costs (gasoline and electric bills and indirect impact of freight and operating costs rising in just about everything across food, goods and services).
The power demands of data centers are keeping power cost threats in the headlines and notably as data centers get pushback in the states given power needs/costs and environmental effects (notably water). Life will get sticky in AI and the related ecosystem if the electricity topic cannot be credibly addressed. The phrase “infrastructure bottlenecks” is getting tossed around a lot. That will impact AI valuation assumptions and pricing power questions.
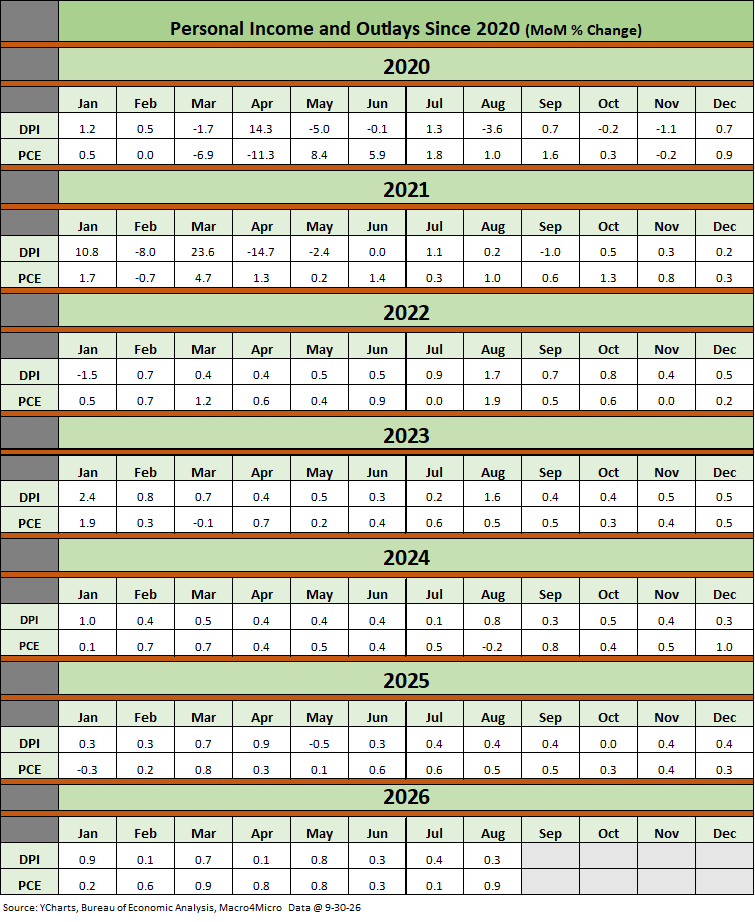
The above table plots the monthly Disposable Personal Income MoM change numbers vs. the Personal Consumption Expenditure MoM numbers across the years from 2020 through August 2026. It is an easy scan across key time periods for a look at turning points in DPI (e.g. stimulus payments) or PCE. August posted a muted move in DPI vs. a more ambitious move in Consumption.
Hassett should probably peek at the dramatic monthly moves in April 2020, January 2021, and March 2021. Or he can hire someone to generate a few charts that directly contradict much of what he says. Trump had his signature on 2 of those 3 DPI spikes. Biden tried to get his name on another one but was blocked. Everybody had their fingerprints on the demand turbocharger at a time of severe supply constraints, and that is even without citing the Russia invasion of Ukraine (which Team Trump never cites…instead just repeating, “Biden’s fault” over and over).
See also:
Macro Dance-Off: PCE Growth vs. Fixed Investment 10-1-26
GDP 2Q26: Bullish Final Revisions 9-30-26
JOLTS August 2026: Living Up to Low Hire, Low Fire 9-29-26
Market Commentary: Asset Returns 9-28-26
The Curve: Pain and Confusion 9-28-26
Weekly Returns: Benchmarks and ETFs 9-27-26
Tech Check: Weekly Price Returns 9-27-26