


JOLTS shows more staffing meditation than motivation with all the moving parts.
Job openings declined for the month, and the JOLTS data showed softer openings trends MoM in such key sectors as Manufacturing and Construction with Health Care and Social Assistance among major declines in Services.
Hires rose with Construction lower and Manufacturing higher. State and Local also rose materially while Federal was flat.
Layoffs and Discharges declined with the private sector wagged by lower layoffs in Construction with Manufacturing stable. Wholesale and Retail trade saw increased layoffs and discharges with Business Services lower.
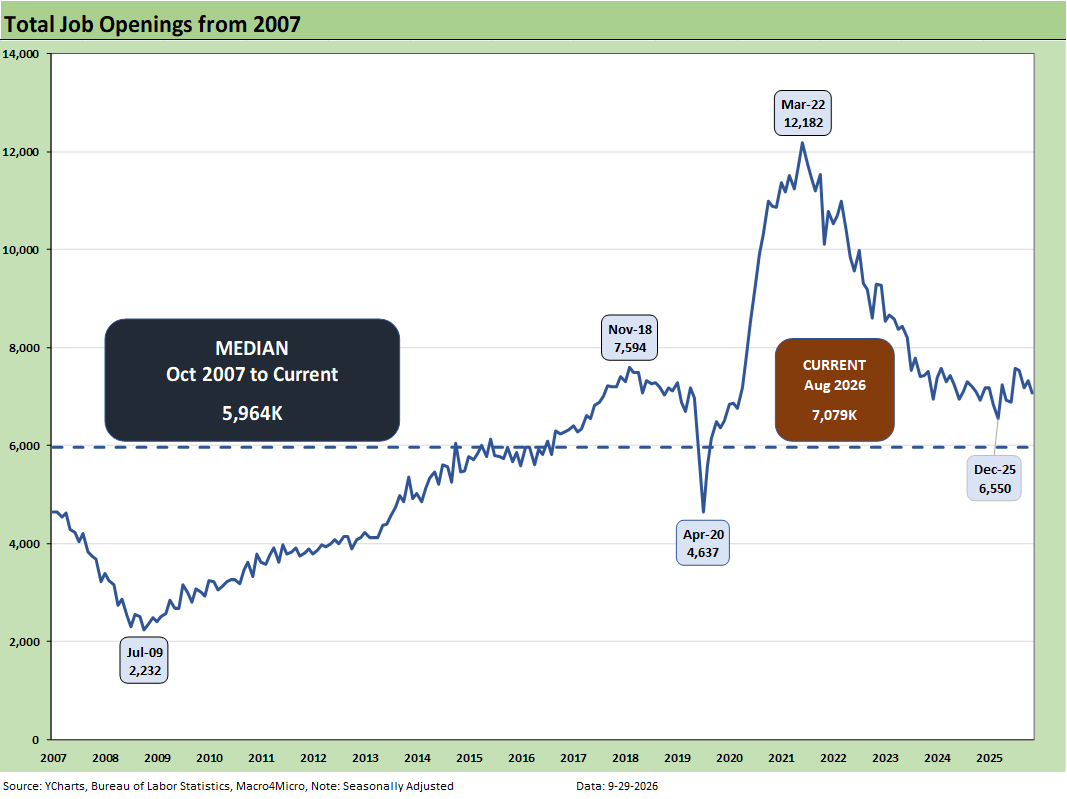
The above time series plots job openings across the timeline from 2007 to current. August 2026 continues what has been a mixed but overall weakening picture for jobs in 2026. For August, we see a -256K decline in openings MoM or around -3.5%.
We tend to focus on Construction and Manufacturing as strategic policy priorities and political talking points.
August shows Construction openings down by -48K MoM or -16.1% from July 2026. The good news is that Aug 2026 was almost +18% vs. Aug 2025, reflecting the momentum of the AI ecosystem fixed investment boom. The payroll numbers later this week will shed light on the nonresidential mix vs. residential housing with the housing sector generally taking a beating on high mortgage rates.
We also see material declines in Manufacturing openings this month with total Manufacturing openings down by -9.4%. The good news is that Manufacturing openings are still up by 25% from Aug 2025. How Iran effects, tariffs, and rising costs of financing will influence hiring on the other side of those openings is a question of where the cycle and employer confidence will trend from here. Wage growth currently falls short of inflation could shift demand and optimism around business prospects could as well.
Openings still needs actual decisions on hirings…
The trick with “job openings” has been the policy uncertainty around tariffs for some industries, intrinsically rising costs with energy and materials, rising funding costs along the curve and notably on the front end for working capital cycles (inventory, ABS etc.).
The AI capex boom benefits many industries along the chain, but there is a reason anywhere from 40% to 50% of the S&P 500 (subject to what source you look at) sees their equity prices in a bear market or correction. The breadth of the stock market is backsliding and that intuitively carries over to imbalances in hiring plans each month in the payroll report.
The March 2022 high of 12.2 million for job openings in the time series off the lows of 4.6 million in April 2020 at the peak of the COVID panic are dramatic. Recent periods had been soft before the April 2026 bounce of +731K back to 7.6 million. Current openings are running well above the long-term median (5.96 million).
Employers will need to “pull the trigger” on openings to move the GDP needle. The direction of the Iran escalation, unfolding trade wars, labor challenges, and the fate of the USMCA could play into those decisions. Mexico still has a Trump bullseye on it while Trump continues to attack Canada. EU still has more clash potential as well. Confidence in policy consistency is under a dark cloud for planning – including payrolls.
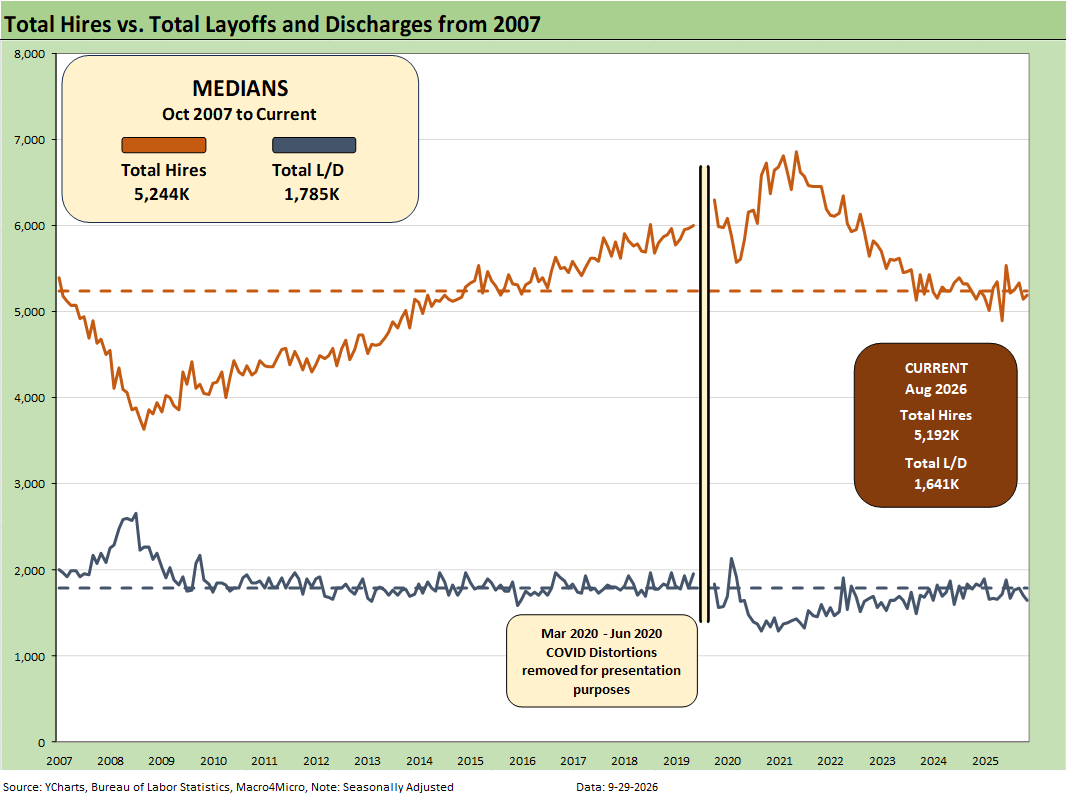
The above chart plots Hires vs. Layoff/Discharges on a SAAR basis. Note: we remove the COVID numbers from several charts to support the visual value for “normal” periods. We comment on the COVID history at the end of the note.
Hires rose by +46K in Aug 2026, but that was heavily weighted toward the Government payroll lines with the private sector declining by -1K. The State and Local hiring of +46K drove that headline delta including +24K in State and Local education.
In the private sector, hiring in Construction was down by -50K MoM and down by -28K YoY. Manufacturing rose by +39K MoM and by +33K YoY. Nondurables rose by +31K of the +39K with Durables only +9K in Aug 2026. We see +23K in Durables YoY for a +13.9% gain. Interestingly, auto payrolls have not been a beneficiary of tariffs in payrolls as we covered in the August payroll commentary (see Payroll Aug 2026: Trouncing Low Expectations is “Positive” with an Asterisk 9-6-26). We will see what the Sept numbers show later this week for tariff-heavy auto/OEM/supplier employers that have seen supplier and material chains disrupted.
Layoffs/discharges declined by -61K in August with total layoffs in the private sector down by -50K and government down by -11K. The largest declines in layoffs and discharges came in Construction. Manufacturing was essentially flat.
While we are in an expanding economy, the annual GDP growth of 2.1% in 2025 lagged 2024’s 2.8%. We get a fresh update in the final 2Q26 GDP numbers this week. The 1Q26 GDP growth rate was boosted in the final numbers to 2.1% GDP growth. GDP in Goods and Services has been weak with the headline growth being driven by the fixed investment with weak consumer numbers falling short (see GDP 1Q26 Final: PCE Growth Plunge 6-25-26). The PCE line drives a lot of services jobs, so that remains a focal point. We will also get PCE monthly growth this week along with PCE inflation.
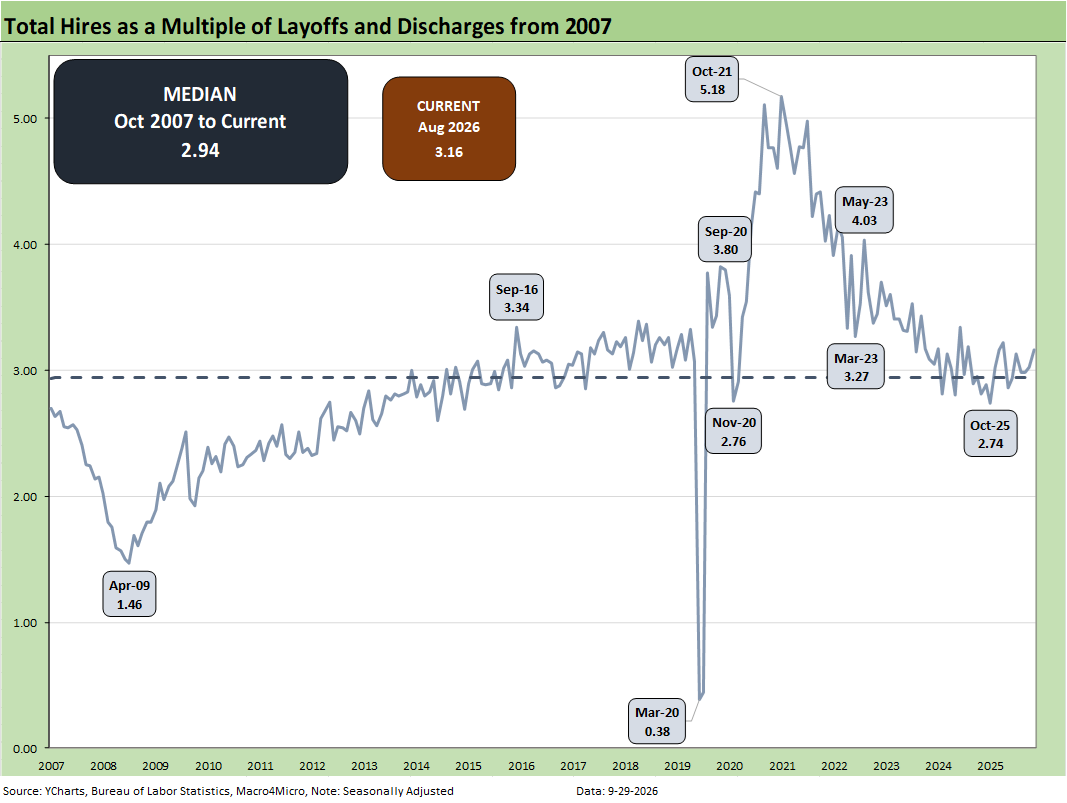
The above chart updates the ratio of Hires to Layoffs/Discharges. The relationship stands at 3.16x, above the long-term median of 2.94x from 2007. The post-2007 period includes the effects of the longest recession since the Great Depression (Dec 2007 – June 2009) followed by the longest expansion in history from June 2009 to COVID (Feb 2020), which brought a very brief 2-month recession wrapped around a wild swing in pandemic employment.
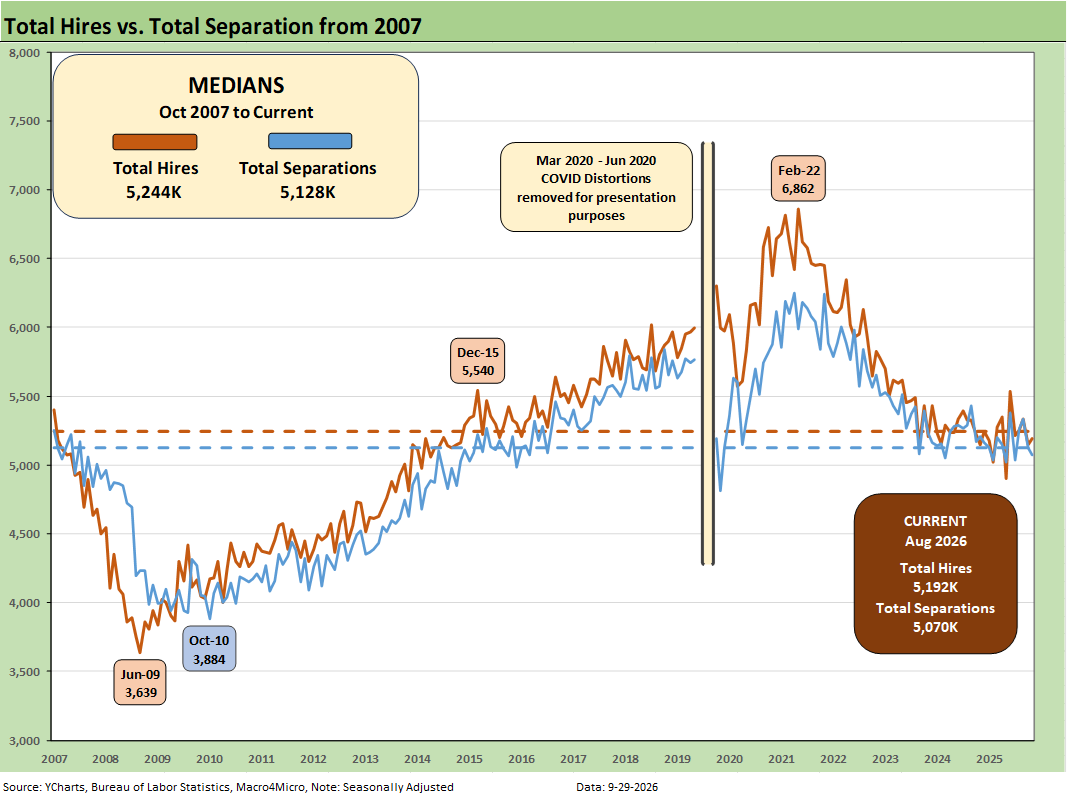
The above chart plots Hires vs. Total Separations on a SAAR basis. Separations include Quits, Layoffs/Discharges, and “Other Separations.” Total Separations declined by -58K MoM and were lower by -137K YoY. While many focus on separations, we prefer layoffs as the priority line. We typically do not find “Total Separations” particularly interesting as a multi-line net number. It’s too murky.
The decline in Separations MoM includes a -24K decline in the private sector and -34K in Government. We see a decline in “Quits” of -23K MoM. One theory is that quits signal relative confidence in finding a job on the other side of quitting. “Other Separations” rose by +26K for the total separations of -58K (-61K layoffs, -23K quits +26K “Other” = -58K).
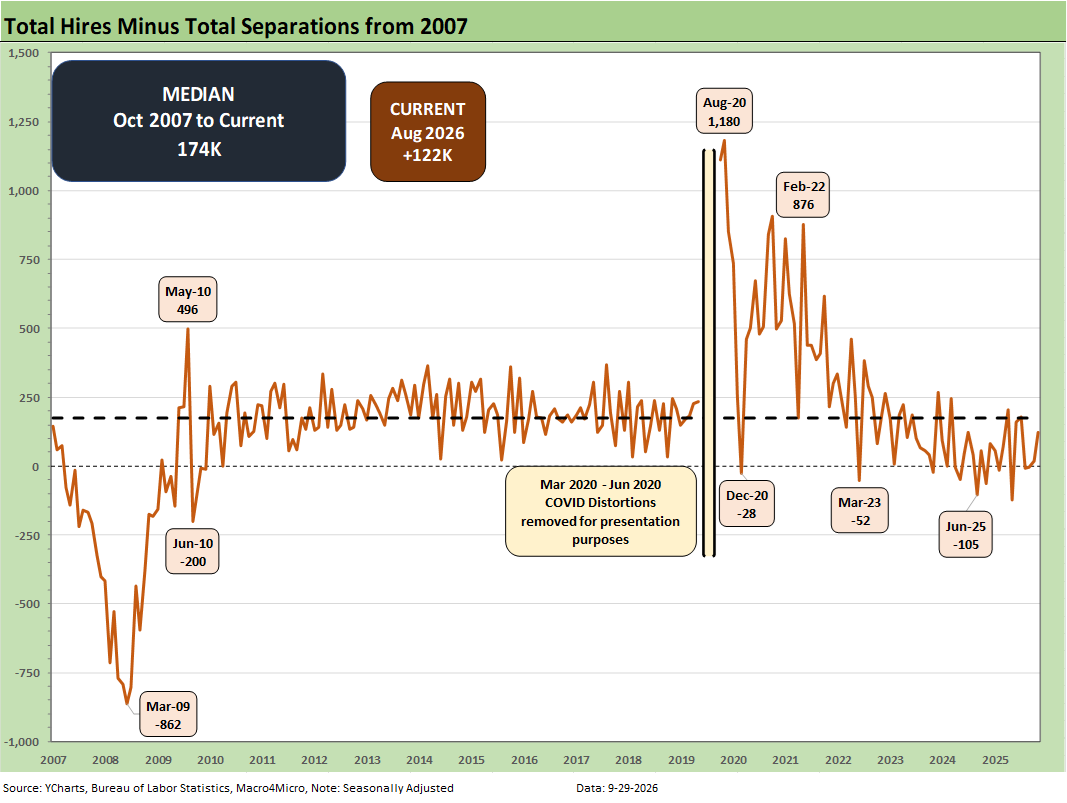
The Hires minus Total Separations differential is plotted above. The +122K remains well below the long-term medias of +174K. The net number above had moved notably lower in recent months and even dipped into the negative range in Feb 2026 before bouncing back into positive range in March and April. The differential of +122K is below the long-term median of +174K. That still constitutes stability and constructive news.
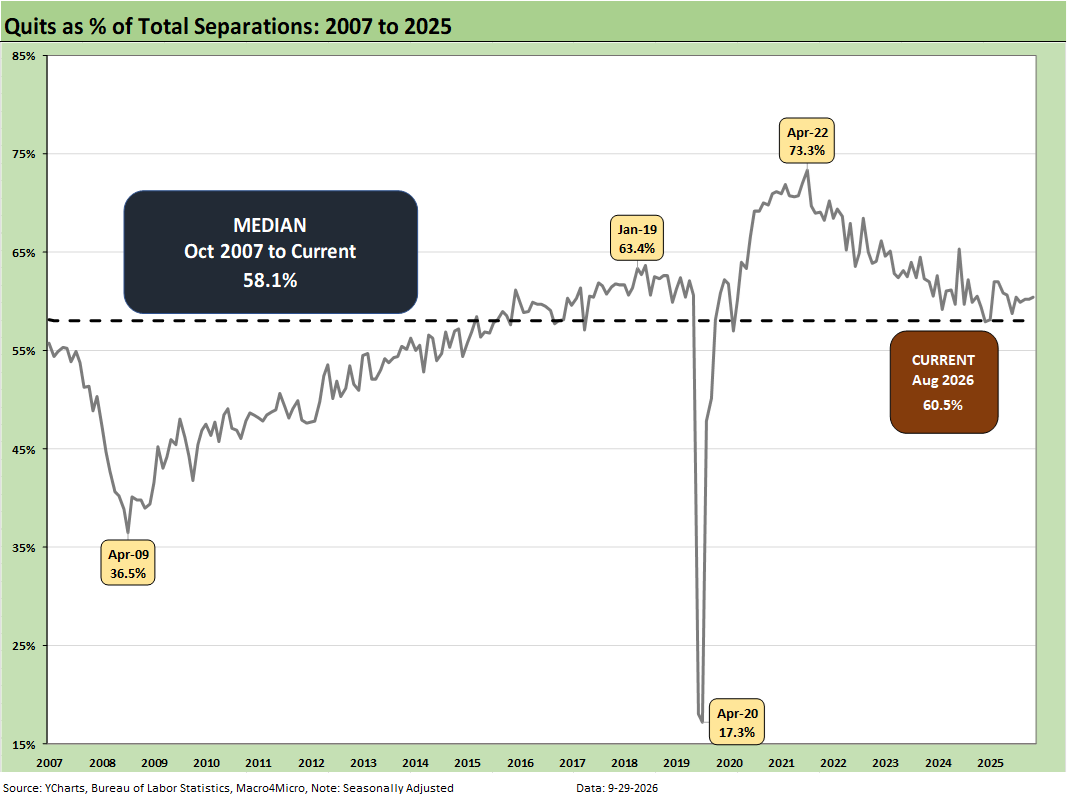
The time series for Total Quits as a % of Separations (SAAR basis) was 60.5%, slightly above the long-term median of 58.1%. The classic “Quits Rate” is measured by Total Quits as a % Total Employment, and that metric was flat at 1.9% MoM, which is just below the 2.0% of Aug 2025.
NOTE ON COVID DISTORTIONS
The Hires vs. Separations time series make for interesting numbers but tough charts to plot visually given how much the spike in Separations/Hiring during COVID distorted the numbers from March 2020 to June 2020. The swings literally were off the charts. For presentation purposes, we adjust the charts above to exclude the raw data for those months to get a better vantage point on somewhat more normal times. Compared to COVID, the credit crisis seems “normal” in terms of the job count moves.
For disclosure purposes, Separations across March 2020 (16.3 million), April 2020 (11.6 million), May (4.7 million), and June (5.2 million) were running against Hires in March (5.2 million), April (4.0 million), May (8.1 million), and June (7.4 million). We remove those from the charts to get better scale visuals on the periods that precede and follow as the market saw 50-year lows in unemployment in 2022. Wild swings were experienced by all as industries saw shutdowns and layoffs in the COVID recession. The long-term medians from 2007 to 2022 for Hires and Separations were very close.
Almost 28 million Separations combined in March-April 2020 as a brutal reminder of that period.
See also:
Payroll Aug 2026: Trouncing Low Expectations is “Positive” with an Asterisk 9-6-26