


Trust me. I got this. The Sioux don’t give me enough credit for my greatness. I know more than all the Chiefs combined.
The market winds down a tough September for bonds and for stocks with tech resilience easing the multi-asset pain.
The week will see a wave of data with PCE inflation while the income and outlays data will also give a fresh read on the consumer sector. PCE growth (68% of GDP) is the most vulnerable area for sustained economic growth while residential housing is also under siege.
Fixed investment has been booming (ex-residential), and we will get another 2Q26 GDP final estimate this week. The AI ecosystem fixed investment is a critical multiplier effect variable as AI has set off rising demand from materials to supplier chain components to finished goods.
With diesel, everything costs a lot more from ag and construction to food and services as operating costs face fuel surcharges and tariffs.
The data center wildcard will stay politically toxic with the elections dead ahead. The ability of a House or Senate shift to undermine certain initiatives will await the newly elected taking the helm in 2027.
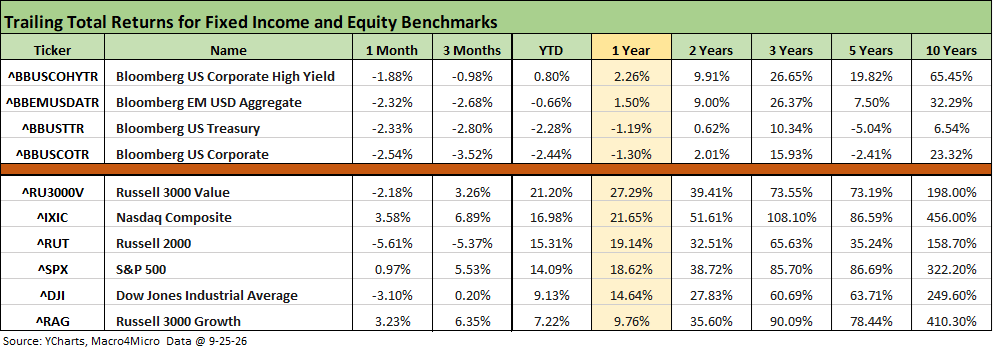
The table above breaks out the fixed income and equity benchmarks we monitor. The rough stretch for bonds has been evident as duration took a beating on adverse UST curve migration. We see all negative returns for trailing 1-month and 3-month fixed income benchmarks with 3 of 4 negative YTD (only HY was slightly positive).
In equities, the Dow and small cap Russell 2000 have struggled over 1 month and 3 months as Tech (NASDAQ and growth stocks) stayed on track. The S&P 500 posted a bad month but remains comfortably in double digits YTD.
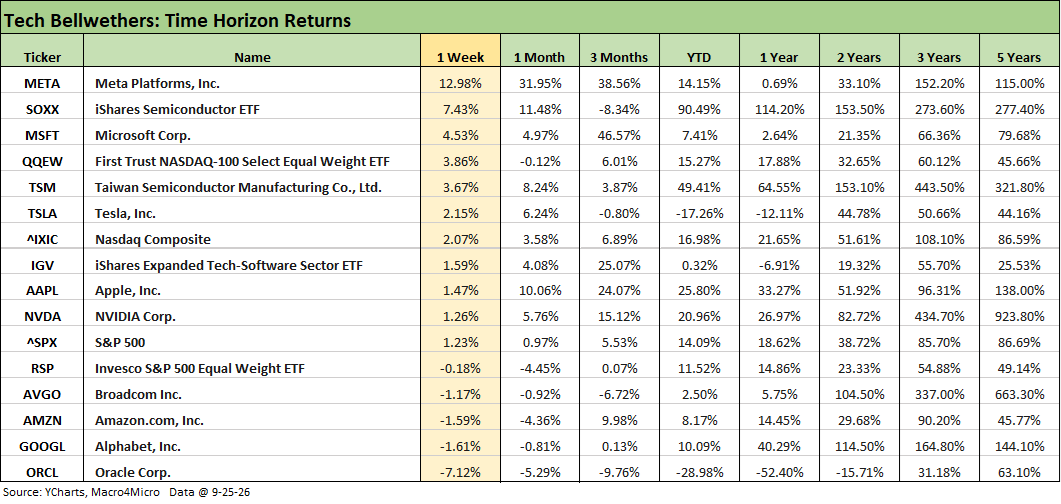
The tech bellwethers had a strong week with Meta generating a lot of excitement on its Muse offering and generating a return for the week of just under 13%. Meta is only +14.2% YTD, so this week dominates its 2026 performance. We saw 5 of 7 Mag 7 names in positive range this week.
Semiconductors also came storming back with the Semiconductor ETF (SOXX) at +7.4% for the week. The earnings release for Micron (MU) comes this week set against the backdrop of NVIDIA announcing an incremental $150 billion for its stock buyback program. NVIDIA showed a muted response. NVDA has been a second quartile performer YTD as covered in other charts below with the top quartile including single names such as Micron (MU), Intel (INTC), Advanced Micro (AMD), Applied Materials (AMAT), and Taiwan Semi (TSM).
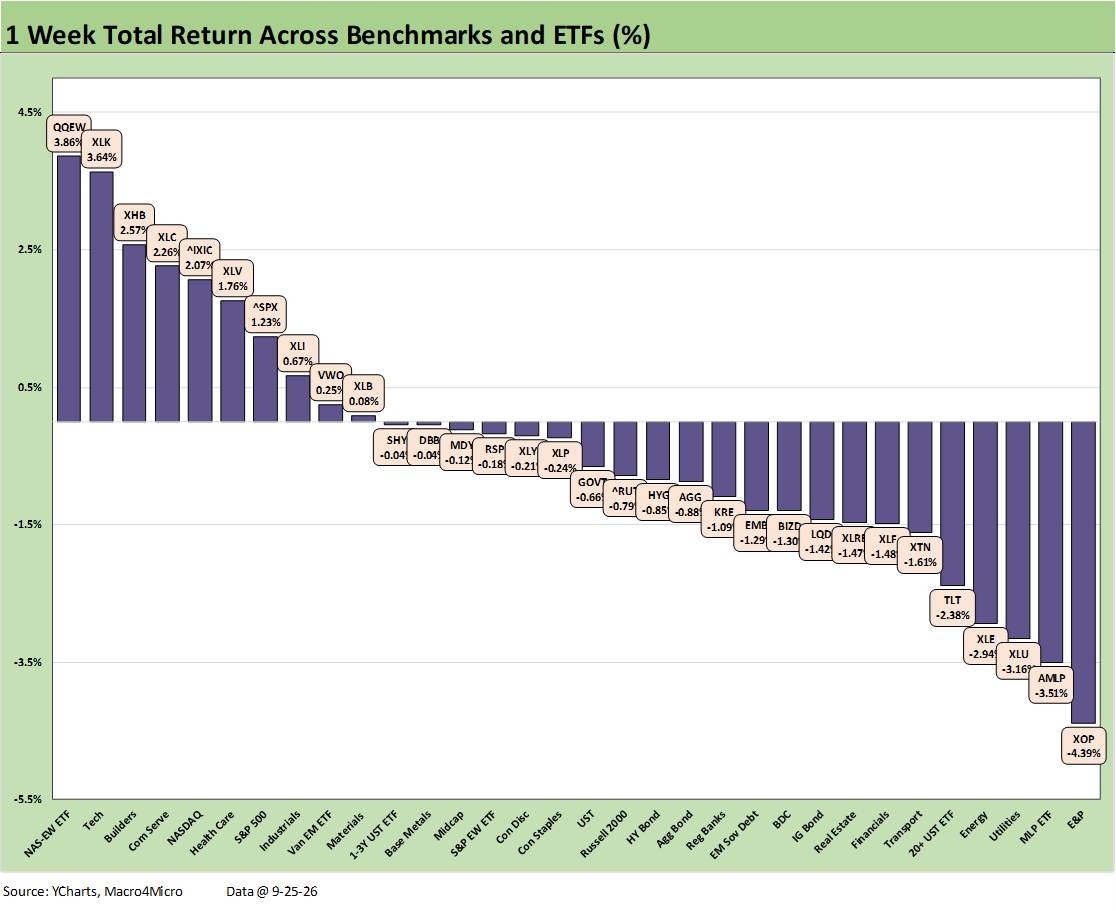
We already posted a commentary on the 1-week returns for the broader mix of benchmarks and ETFs (see Weekly Returns: Benchmarks and ETFs 9-27-26). The 10-22 score was hurt by more than the fact that all 7 bond ETFs were in the red. Energy dropped to the bottom quartile with E&P (XOP), Energy (XLE), and Midstream (AMLP) along with some more interest-rate-sensitive and dividend-heavy ETFs.
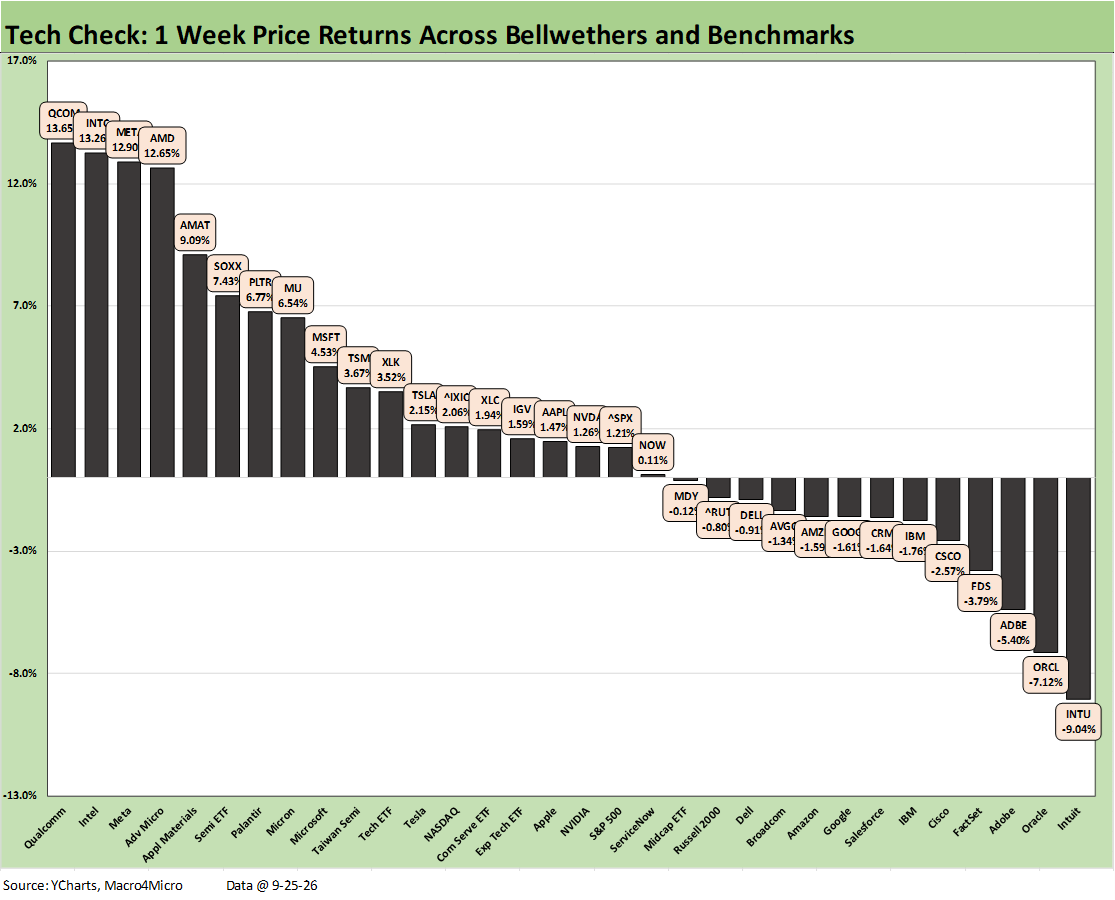
We already posted on the 1-week returns on the Tech Check asset lines (see Tech Check: Weekly Price Returns 9-27-26). We see 6 of the 8 top quartile names from the semiconductor subsector joining Meta of the Mag 7 and Palantir as the only software name. The 19-13 score was solid with the bottom quartile still heavier on software and SaaS.
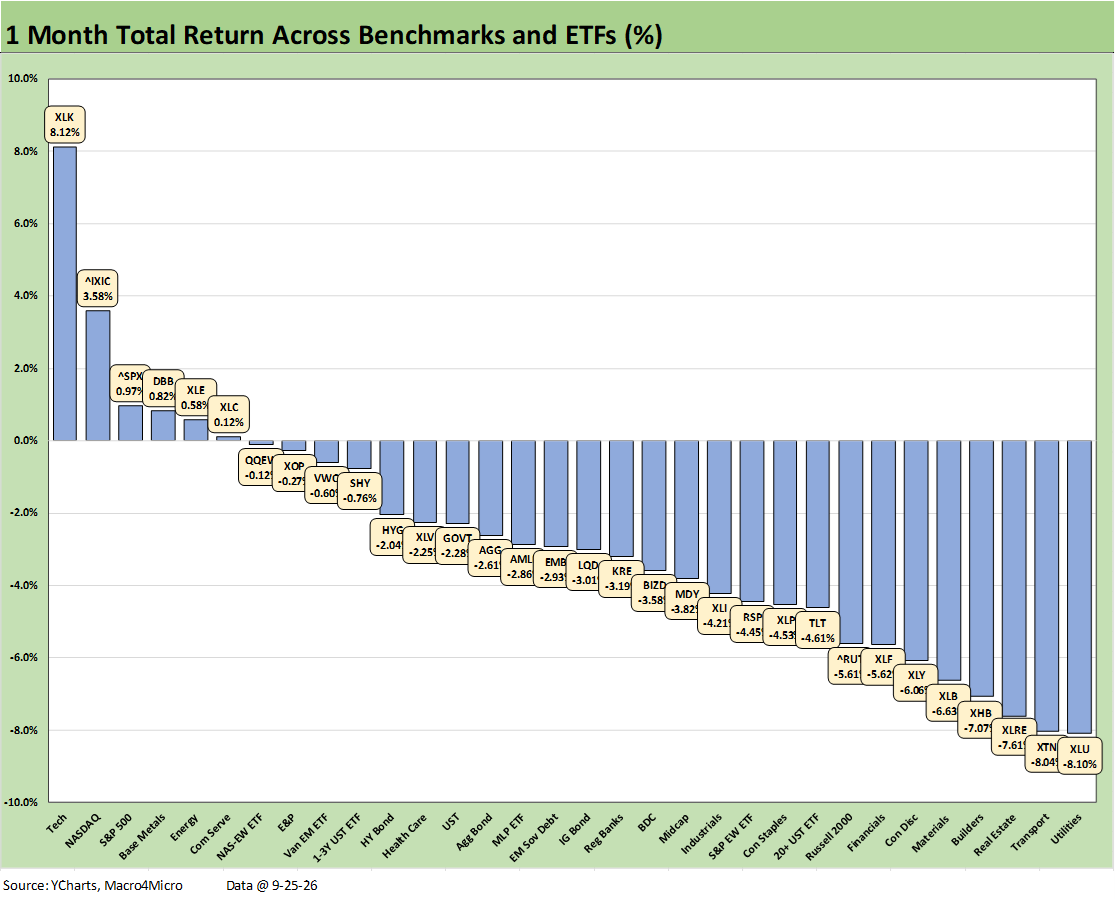
The 1-month performance for the broader benchmarks and ETFs was ugly at 6-26. All 7 bond ETFs were negative. Interest rate sensitive industries dominated the bottom tier. The same was true for those most exposed to energy sensitive cost lines as Transports (XTN) damaged by diesel and aviation fuel prices.
The winners were heavier in tech and energy with the Tech ETF (XLK) well ahead. The tech heavy broad benchmarks such as NASDAQ and S&P 500 in the top quartile joined by the Equal Weight NASDAQ 100 (QQEW) and the Communications Services ETF (XLC) where Meta is a major constituent.
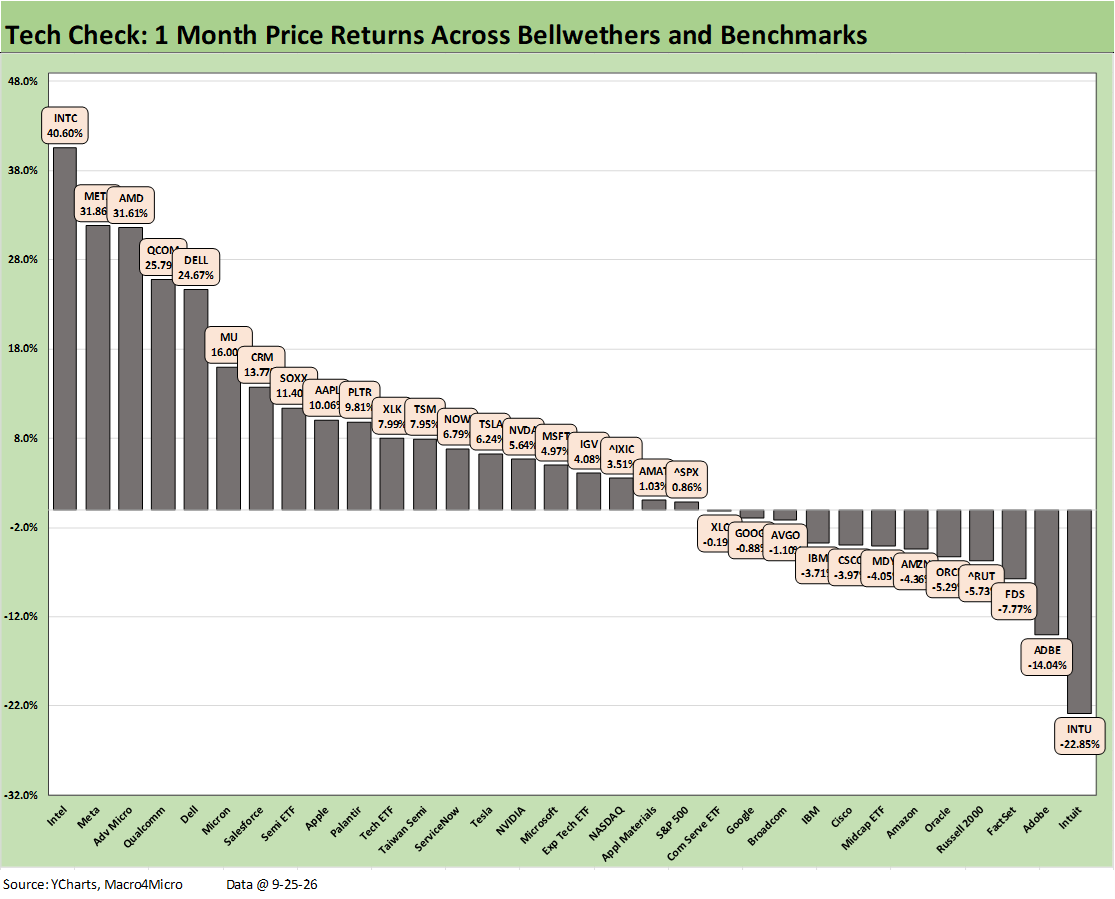
The 1-month returns for the Tech Check list weighed in at 20-12 for the week during a stretch where there were some notable moves as semiconductor markets moved around and the markets continued to wrestle with which bearish views on software and SaaS based services names were overdone during the “SaaS-pocalypse.”
Only Salesforce (CRM) was able to break into the top quartile on the month with Intuit (INTU), Adobe (ADBE), and FactSet (FDS) sitting in the bottom 3 slots and joined by Oracle (ORCL) among single names in the bottom 5. ORCL is in the bottom 3 YTD as detailed in another chart further below.
The top quartile was semiconductor and AI ecosystem heavy with 6 of 8 in that bucket joined by Meta and Salesforce.
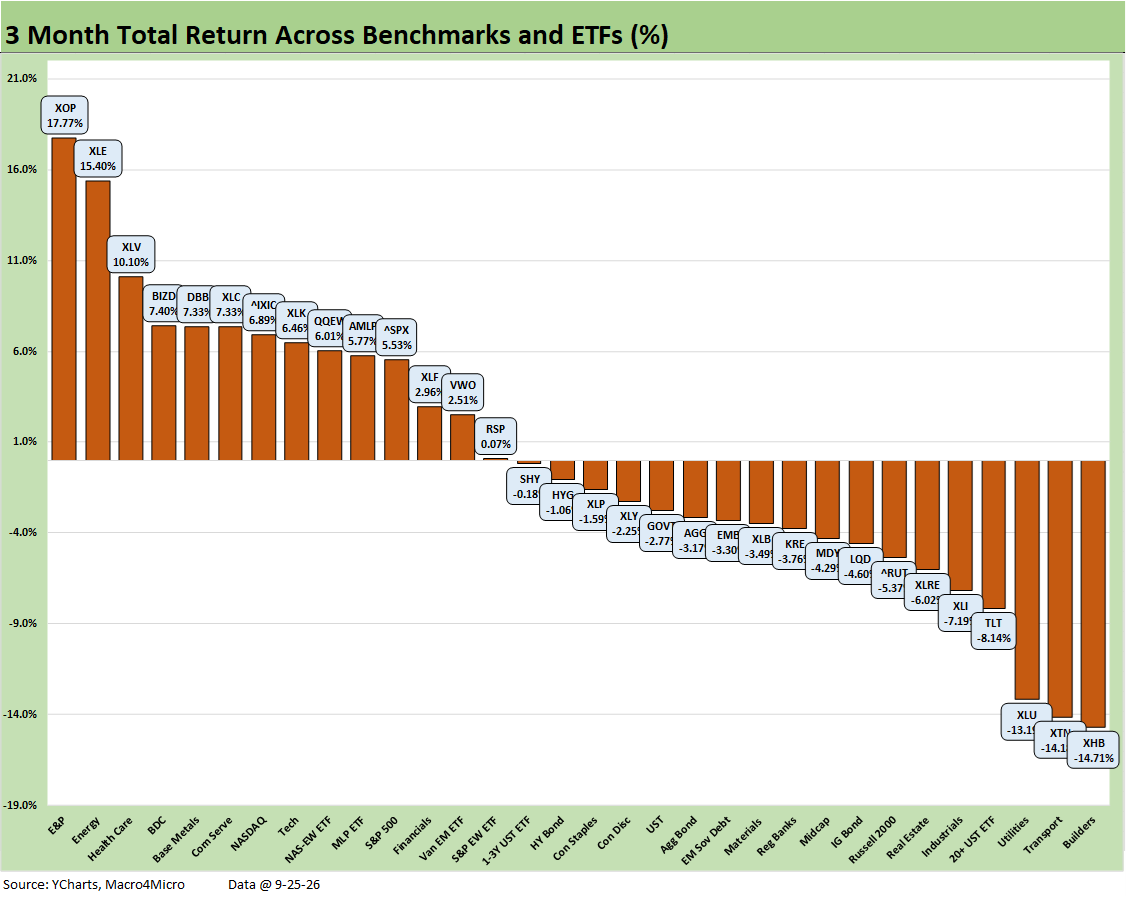
The broad benchmarks and ETF mix over the trailing 3 months rang up a score of 14-18. Oil prices carried E&P (XOP) and Energy (XLE) to the top two slots with the pharma-heavy and defensive Health Care ETF (XLV) at #3.
A shock for some might be the BDC ETF (BIZD) at #4 as another earnings season and earlier overreaction to the downside eased some of the most bearish generalizations that private borrowers would somehow decide on a mass default. The +7.4% 3-month total return numbers for BIZD are part of the -3.5% YTD return.
The private credit market presents a vastly diverse mix of quality and price risk and underwriting /due diligence standards. The concerns around the quality of marks, more narrowly in terms what price would “clear the market today,” is a different exercise than handicapping permanently impaired assets and the quality of reserves by lenders. There is also the risk dynamic of BDC and NAV math versus a billion-dollar private portfolio facing redemption risks.
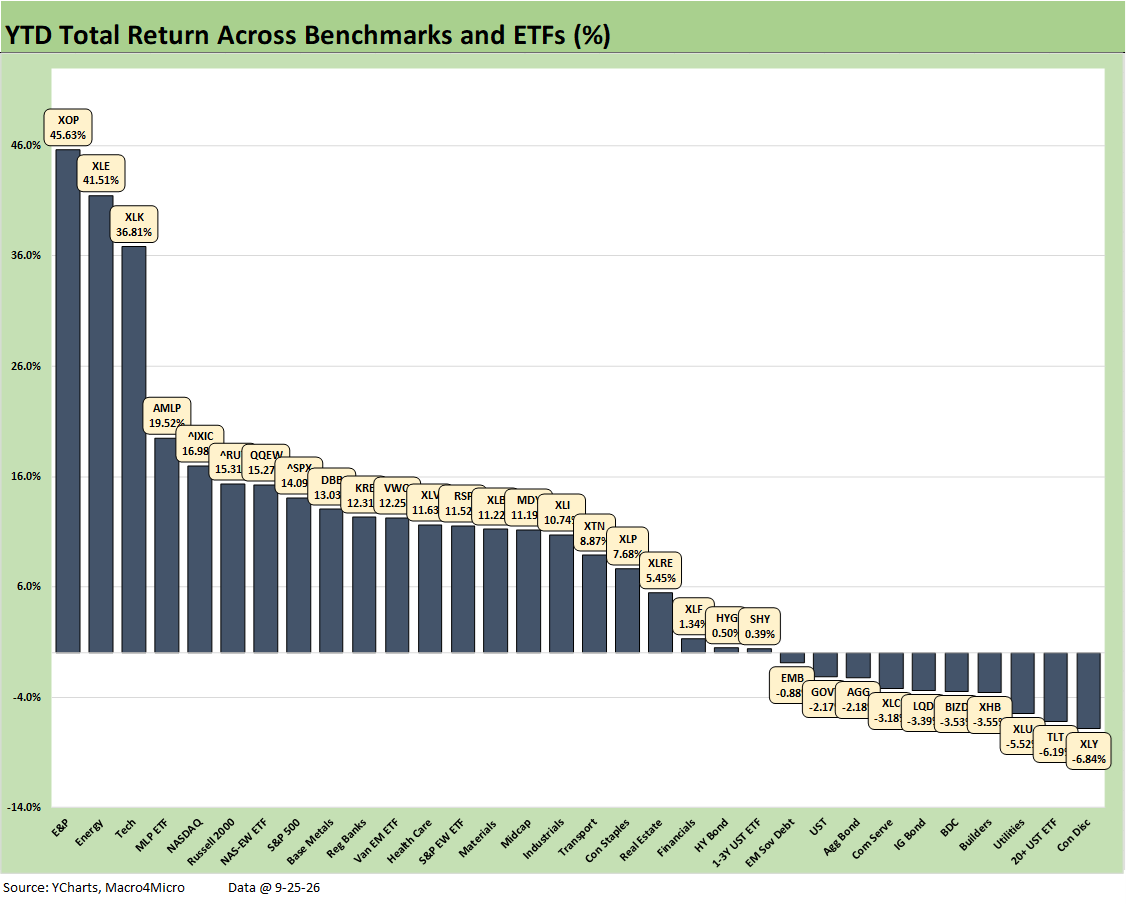
The YTD returns for the broad market benchmarks and ETFs show a favorable YTD score of 22-10. Within the 10 asset lines in negative range are 5 of 7 bond ETFs with only the short duration 1-3Y UST ETF (SHY) barely positive at +0.39% and HY (HYG) at +0.5%.
Energy and Tech led the pack YTD with E&P (XOP) and Energy (XLE) at #1 and #2 with Midstream (AMLP) at #4. For tech, the Tech ETF (XLK) ranked at #3, NASDAQ at #5, the Equal Weight NASDAQ 100 (QQEW) at #7, and tech-heavy S&P 500 adding up to half the top quartile with the Russell 2000 rounding out the top tier lineup.
The bottom tier is heavy on the interest rate exposed equity ETFs such as Homebuilders (XHB) with 3 bond ETFs. The Consumer Discretionary ETF (XLY) is sitting in dead last at -6.84%. XLY had a slew of names with material underperformance YTD (Tesla, McDonald’s, Lowe’s, DoorDash, Booking Holdings, TJX, etc.).
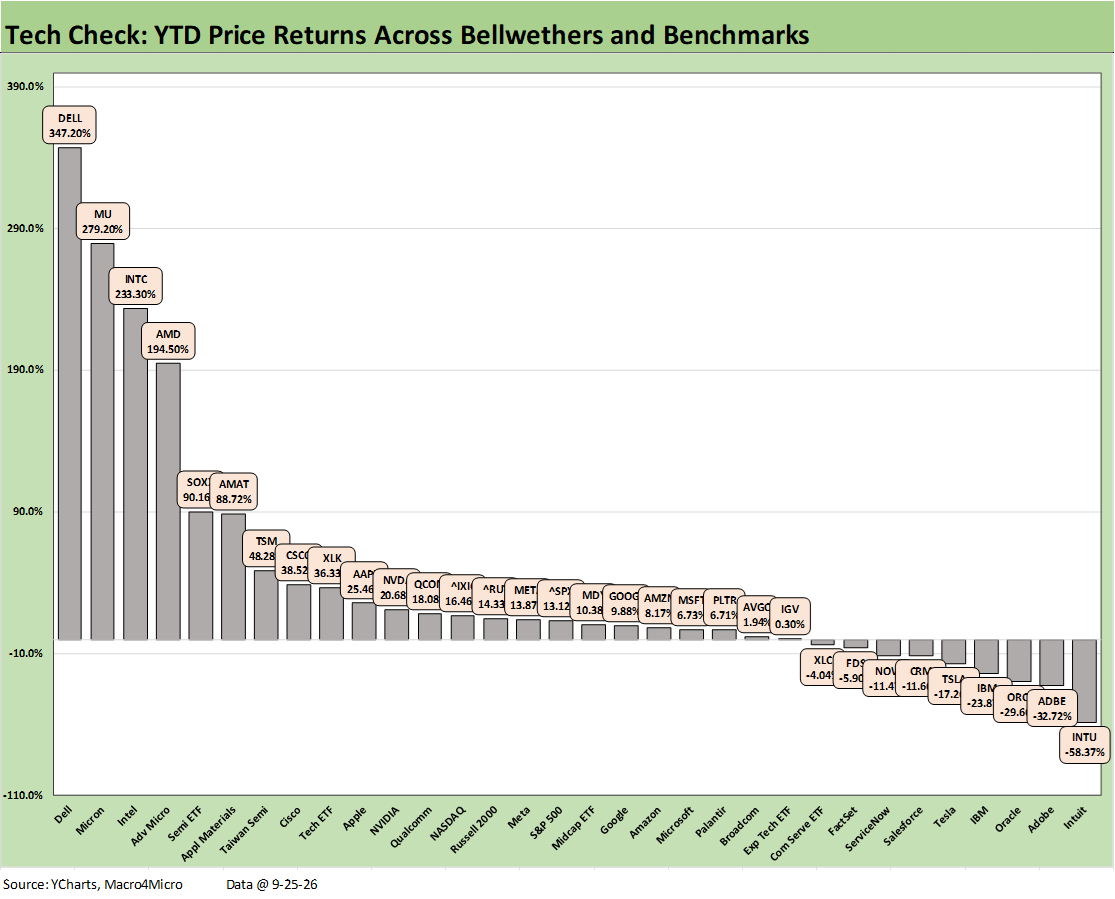
The YTD Tech Check list shows the massive difference between semiconductors and software/SaaS that we have updated along the way. It took a return of +38% to make the top quartile and over +90% to make the top 5. The semi and AI ecosystem plays such as Dell showed the chain reaction from data center hopes and chip demand (the semi names).
The running negative returns in the bottom quartile have eased in recent weeks but it took -17.2% to make the bottom 5 with Intuit (INTU) bringing up the rear at -58.4%. Joining INTU in the bottom 3 were Adobe (ADBE) at -32.7% and Oracle (ORCL) at -29.6%.
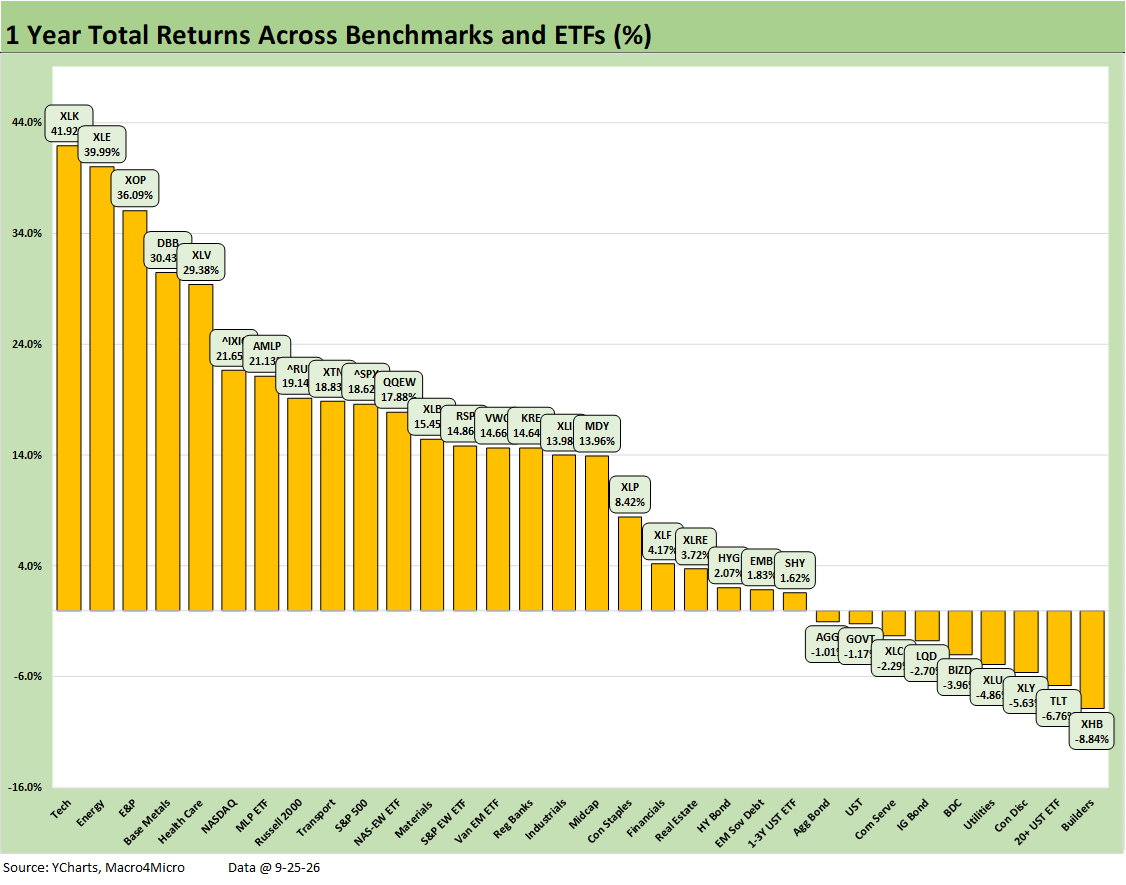
The LTM returns at 23-9 show the slow and steady increase in the number of negative LTM returns from single digit asset lines in the red. For example, the list was 31-1 at the end of June with only the BDC ETF (BIZD) in the red at -13.5%. BIZD is now back down to -3.96%. We see 4 bond ETFs in the red for the LTM period.
The home stretch gets tricky from here with Trump assuring lower oil prices while promising to the start bombing Ira after the election. Meanwhile, the FOMC could be looking at two hikes. We still need to get past an election of course without a state of emergency, ballot seizures, and/or a wave of ICE ‘roid rage at the polling places.
See also:
The Curve: Pain and Confusion 9-28-26
Weekly Returns: Benchmarks and ETFs 9-27-26
Tech Check: Weekly Price Returns 9-27-26