


PCE vs. Fixed Investment in harmony right now.
PCE growth in 2Q26 is now only back to the levels we saw in 2Q24 to 4Q24, and the question of sustainability will get put to the test. With PCE around 68% of GDP, that is a key variable.
The real winners have been along the fixed investment lines, which are smaller in terms of total GDP contribution but remain key drivers of wealth effects and potentially payroll stability from tech to freight and logistics to financial services.
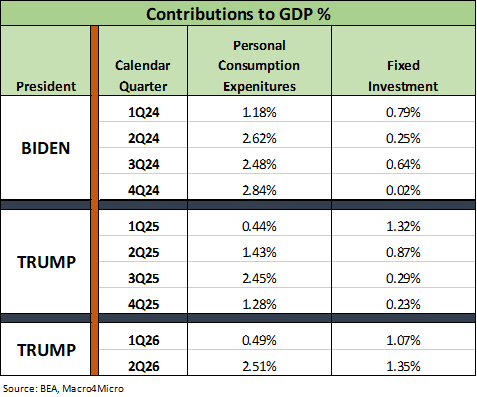
The chart breaks out the critical drivers of GDP from 1Q24 to 2Q26. We detail the contributions to GDP for Personal Consumption Expenditures (PCE) and for Fixed Investment. We already looked at these numbers in our GDP update for the final 2Q26 estimate (see GDP 2Q26: Bullish Final Revisions 9-30-26).
This chart offers a more granular comparative update of objective factual numbers by quarter. The political spin is heavy on adjectives, but the concept of “higher” or “lower” is a fact and not an opinion. The underlying drivers and macro or micro quality assessments of what can influence these numbers is more subjective.
The fallout from Iran is hard to find in the PCE trend. Consumers showed up even if the asterisk ties the volume to the “K shaped recovery” and inequality of the consumption patterns. Wage growth running below inflation is shifting with the lower CPI and PCE inflation metrics, but that reality remains a problem.
The easy takeaway from the chart is that the consumer sector was doing much better in PCE growth in 2024 than in 1Q25 to 1Q26. Trump’s attempt to tag the US as a “dead country” in 2024 reflects his usual economic ignorance since the PCE numbers were strong. PCE growth was north of a 2% contribution in 3 of 4 quarters in 2024 vs. 1 of 4 in 2025 and now 1 of 2 quarters through 1H26.
We see fixed investment coming on strong into 2026 with the AI spending boom. “Equipment” at +13.4% has been a big winner as detailed in the 2Q26 update. “Intellectual Property Products” are also on a roll at +9.2%. We don’t see the capex pace slowing down yet, and that would be a market shock if it did.
The IP and Equipment boom is one of those times when an intrepid reporter could ask Trump “How well do you think the US would be doing without the massive growth in the trade deficit with Taiwan?” You sure will not hear this raised as a topic on CNBC. They do not want to risk their GOP dignitary guest flow.
“Golden Age” still will not fit with these numbers for anyone who was around in the 1980s and 1990s.
The banner fixed investment is obvious in 2026 and 1Q25 period, but the PCE piece of the story is only now starting to swing toward more positive numbers. The sustainability of the PCE growth will get tested with the lag effects of inflation, energy, tariffs, etc.
We covered the noted PCE rebound in the GDP commentary. After we reviewed this month’s PCE data release (Income and Outlays report), the consumption story is proving remarkably resilient after a weak stretch in early 2026.
Headline GDP often comes with material moving parts as we cover in our GDP updates. Net Exports/Imports and changing balances in inventories are usually the biggest movers that can easily swing Headline GDP by +/- 2 points and even more with the wild phase-ins of tariffs and dislocations in working capital in 2025 (see 2Q25 GDP: Second Estimate, Updated Distortion Lines 8-28-25, 2Q25 GDP: First Cut of Another Distorted Quarter 7-30-25). The export and inventory lines in GDP contributions for 2Q26 moved the headline number -1.6 points lower. While Trump hates trade deficits, one does not need much imagination to see that the massive and growing Taiwan trade deficit has been a big contributor to the investment boom.