
Payroll: A Little Context Music
The questions will fade quickly once the FOMC weighs in during Sept, but an 818K payroll revision still pales in comparison to the gross numbers.


Honey I Shrunk the Employment
The 818K revision raised some eyebrows and sent Trump into a Fox rant on conspiracies and fake numbers, but in the context of over 16 million jobs adds under Biden through July and over 1 million jobs added in the combined months of June/July 2022 at the inflation peak, a little context always helps when setting 818K against the 161 million employed (Household Survey) or total payroll or over 158 million (Establishment Survey).
Looking back across the Presidents, the 11 million for Clinton in Term I and II after almost 11 million in Reagan II and over 10 million in Obama II, Trump might be feeling some size issues again when he had just over 6 million through 3 years before being the first President since Hoover to post a single term jobs decline. Just the facts.
Perhaps the most important aspect of the revision is that the FOMC can potentially worry less about jobs and wrestle with the the broader economy as Service PMI numbers are still telling a balanced tale of soft landing. That is the 25 vs. 50 bps cut decision and how to best start an easing cycle (see CPI July 2024: The Fall Campaign Begins 8-14-24).
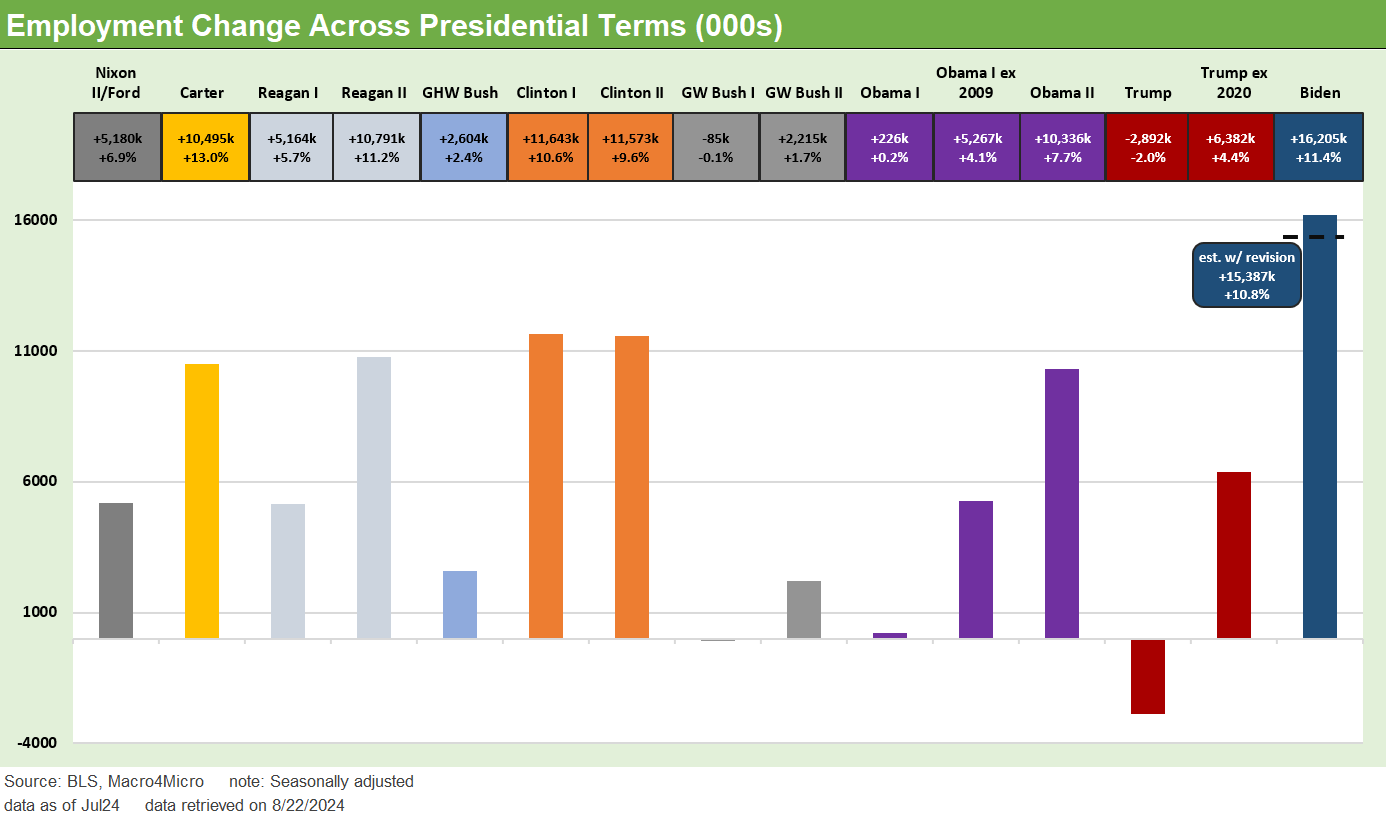
We have looked at the various payroll adds across the years (see Employment Across the Presidents 8-15-23), and we update the Biden term numbers above in the lookback to the Carter years. One of those obscure facts is that Carter posted the highest % growth in payrolls and Biden the highest absolute number of jobs added in one term (yes, even with the revisions) ahead of Clinton I and Clinton II in second and third.
The numbers tell the story above for employment additions from Nixon/Ford through Biden with “two termers” (i.e., not Trump or Biden) broken out for each term. That is a lot of impressive job adds from Carter to Biden. We see some very big years in the 1980s and 1990s in the bipartisan bull markets of Reagan and Clinton (Maybe “bipartisan” is better for the country’s economy even if not for aspiring dictators?). We have already highlighted how strong the Reagan and Clinton economies were relative to Trump’s self-proclaimed “economic miracle” and “greatest economy in history” (see Presidential GDP Dance Off: Clinton vs. Trump 7-27-24, Presidential GDP Dance Off: Reagan vs. Trump 7-27-24).
We will not pile on Trump (ok, maybe a little) since he seemed to be in a foul mood on a “Fox and Fiends” dial-in talking about the evaporation of jobs and fake payroll numbers (presumably by those who faked the 7 million votes he lost by and the same for the 2+ million gap in the popular votes in 2016). The important point is that there has been a longstanding tradition of hammering the BLS data and the gaps across methodologies. Trump and Biden both had the BLS numbers.
Perma-bear publications have been hammering on this topic for decades. Some of us tend to do the same on such topics as “Owners’ Equivalent Rent” but in the end you cannot fight City Hall. You need to work with the data delivered in framing up investment strategies and the state of the economy. The same is true for the Fed.
On a side note, Project 2025 wants to dramatically downsize the availability of data, replace those who are not like-minded across the Department of Commerce and roll it all up under White House control in version of “Sharpie Gate” N+1 (see Payroll June 2024: The Race Gets Confusing 7-5-24). How do you think the quality of the data will look then?
The fact that the routine downward revisions could go off the charts like it did this time (surprising many street economists) likely gets back to the stunningly distorting trends in so many different variables since COVID and the wrestling match to gauge immigrant effects in a world with so many undocumented workers.
The fact that many macro models, economic wizards, and triple-jointed quants have struggled on multiple fronts should not be that shocking given so many years of ZIRP and global curve distortions in the leading economies, so many tariffs, so much fiscal stimulus, and a yield curve so dramatically inverted for so long in a growing economy with inflation pressures.
There had not been an inflation backdrop like 2022 since the 1970s. In those days, I can’t remember much agreement among the Professors (Harvard, Chicago etc.) on how to frame up that stagflation mess into the early 1980s. That was “not in my model” made its way to the Laureates of LTCM, so it easier to forgive some government employees on a lower pay scale. Even that large base of expertise might get purged by Project 2025. The political priority is, after all, about control and not quality. Starve the Dept of Commerce of talent, objective analysis, and funds and make it work for the White House needs.
Big numbers, small % of the employment base…
The payroll numbers detailed in the above chart are always eye-openers on the sheer scale of jobs added across the cycles. Those numbers fall under the heading of favorable demographics even if the Baby Boom turned 65 years old in 2010. Even beyond the payroll count, that is still a lot of retirees that keep on living, spending, and driving their own set of economic multiplier effects (notably in health care and social assistance jobs).

Just as a reminder, we revisit update the total payroll ranks by occupation above from our most recent July payroll update (see Payroll July 2024: Ready, Set, Don’t Panic 8-2-24). The above chart updates the private sector while in the chart below we update Government payroll data. We see over 135 million in private sector jobs and over 6 million added in the private sector since just before COVID (we start the deltas at Jan 2020). The Jan 2020 delta does not give weight to the Biden’s term refilling the payroll hole left by COVID 2020. We covered the Biden term deltas above.
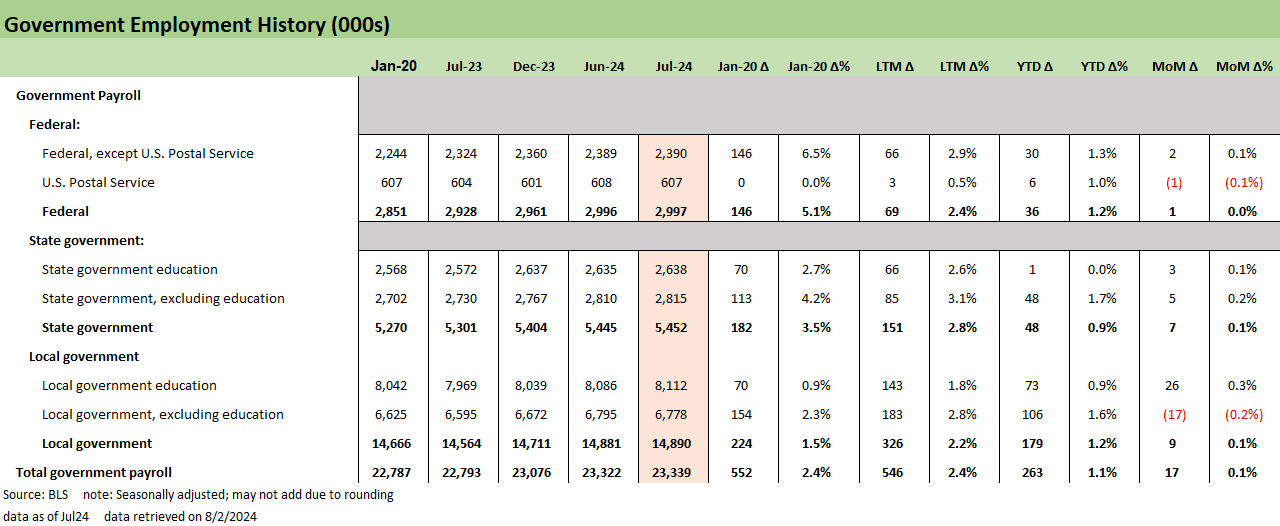
We usually separate out the Government payroll to highlight how strong the state and local hiring has been with so many state, metro, and local political leaders singing the blues on the horrors of the national economy. They do that while bragging about the strength of their local economies and still magically finding excess budget to go on a hiring binge the last 12 months. The two sets of books are pretty transparent in motives (see State Unemployment: A Sum-of-the-Parts BS Detector 6-30-24, Employment: Real Numbers vs. Fictitious Dystopian Hellscapes 3-9-24).
Glenn Reynolds, CFA glenn@macro4micro.com
Kevin Chun, CFA kevin@macro4micro.com
See also:
All the President’s Stock 8-21-24
Footnotes & Flashbacks: Credit Markets 8-19-24
Footnotes & Flashbacks: State of Yields 8-18-24
Footnotes & Flashbacks: Asset Returns 8-17-24
Total Return Quilt: Annual Lookback to 2008 8-14-24
CPI July 2024: The Fall Campaign Begins 8-14-24
Footnotes & Flashbacks: Credit Markets 8-12-24z
HY Industry Mix: Damage Report 8-7-24
Volatility and the VIX Vapors: A Lookback from 1997 8-6-24
HY Pain: A 2018 Lookback to Ponder 8-3-24
Payroll July 2024: Ready, Set, Don’t Panic 8-2-24
Presidential GDP Dance Off: Clinton vs. Trump 7-27-24
Presidential GDP Dance Off: Reagan vs. Trump 7-27-24