Footnotes and Flashbacks: Week Ending Feb 24, 2023
We look at multiasset returns, duration pain, the latest UST shift, the 3M to 10Y UST slope, and tough numbers from Anywhere and Carvana.
Bear flattener still has teeth.
This Week’s Macro: Broad index returns for equity and debt; Duration headaches; ETF benchmark 1-month and 3-month returns; BDCs take the lead; Running bear flattener differentials since ZIRP ended; 3M to 10Y slope update.
This Weeks’s Micro: Residential brokerage and related services as Anywhere Real Estate reports ugly quarter; Carvana keeps the bad streak going at negative EBITDA run rates.
MACRO
In our Macro section, we look for notable economic releases or trends signaled by bellwether industries from the top down.
Comparative Asset Returns
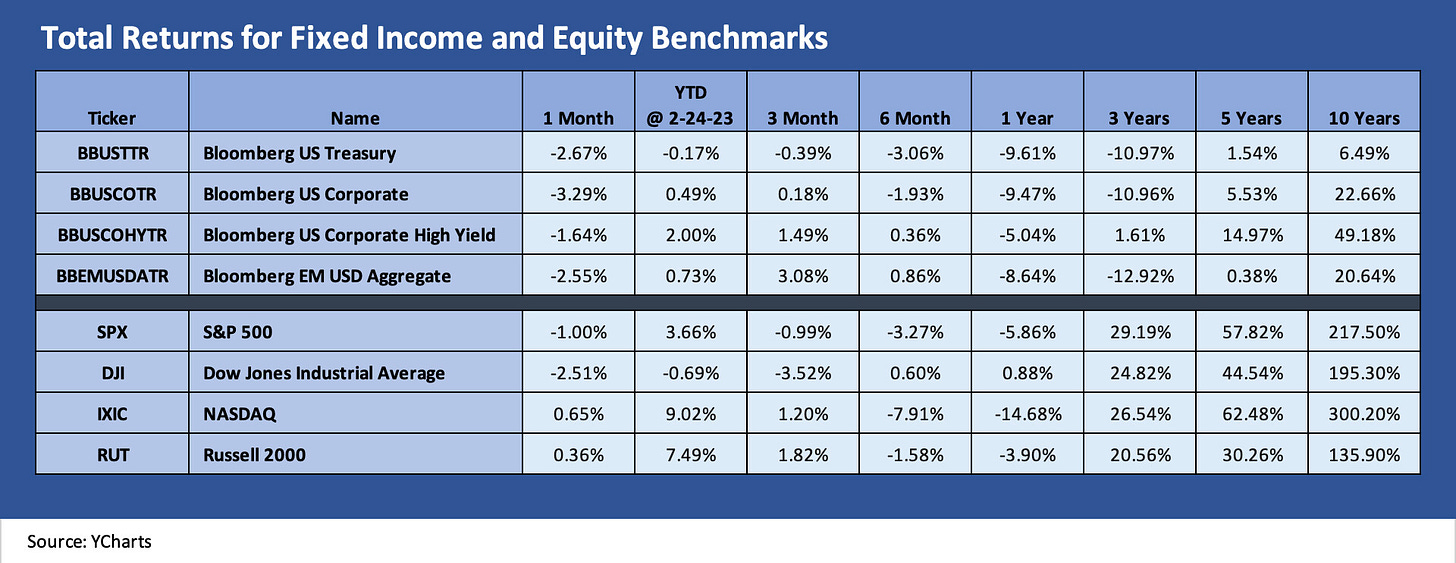
The chart above updates the broad benchmarks for fixed income and equity returns over a range of trailing time horizons. We see fixed income starting to get roughed up on the duration side of the ledger even though excess returns and credit pricing (OAS) has been favorable YTD. For the past week, we saw negative returns in UST flow into high grade bonds and to a lesser extent in US HY. The US HY market saw excess returns stay solid with minor weakness there in IG bonds.
The noise level on inflation and Fed policy anxiety peaked with the Personal Income and Outlays release on Friday and the latest PCE inflation figures. The data also hammered home a breakaway month in income and spending (see Income, Outlays, Inflation: Rerun? Or Trilogy of Terror? 2-24-23) that tells a good demand story for the PCE line in GDP and pushes back on recession timeline handicapping.
The underlying curve problem for US bond benchmarks was also evident in weak equity performance in recent weeks as the S&P 500 saw three negative weeks on yield curve fears. Meanwhile, rising rates always complicate the exercise in growth stock valuation. With cash now a viable asset class on the menu at yields higher than intermediate bonds (see 3M to 10Y inversion commentary below), the cost of being on the sidelines has change materially for uncertain investors with multiasset flexibility. Patience has a lower opportunity cost than in the post-crisis cycles.
A look at the longer tail in equities…
Below we add some additional equity benchmarks that extend the view into the Russell 3000 growth and value stocks. We wanted a wider angle view on what the equity markets are thinking. We also drop in some broader sector benchmarks near and dear to the risky credit markets across Financials, Energy, Industrials, and Real Estate.
We look at more subsector breakdowns in the ETF section below, but the recent outperformance by growth over value runs counter to the rule of thumb on the upward yield curve shift. The fact that optimism around the economy can drive some resilient IT budgets and support capex programs that increasingly have a very high tech and software component might be changing that generalization around “long duration equities.”
Looking across some of the major sectors above, we see that Financials have been shaky on fears of a broader NII margin squeeze and some possible weakness in asset quality even with a mixed cyclical picture. The asset quality metrics have hung in well in the consumer sector and corporate sector alike even after the massive UST migration in such a short period.
The high PCE numbers often receive a mixed reaction when good household news hits the headline metrics. The yield curve bears see trouble, but the demand side of the picture can also reassure on earning trends in many sectors. Asset quality fears can pick up when the “PCE Rorschach Test” signals excessive spending and overextension of credit in some income tiers.
As the chart above details and as we see in the ETF performance below, Energy has been a loser YTD even while still minting money in 4Q22 and reporting strong shareholder rewards. That is a valuation debate and not a sector risk worry. Plunging natural gas prices on warm weather is not a new experience for the E&P sector and sub-$80 WTI is a long way from earlier scenarios.
The more important factor is that Europe dodged a winter energy crisis on the scale originally feared even as a mad scramble has been set off in the LNG markets that could last years and pull in the full supplier chain from Canada to the US to serve Europe and undermine Russia. To move faster, that would potentially require the Democrats stepping back from pipeline and midstream intransigence.
For Real Estate, rising rates shorten the real estate cycle, and that is still on the front burner for REITs and the rate of spending in residential and commercial real estate markets. The Residential sector surprised the market last week with the best new home sales number since 1Q22 (see New Home Sales: Sequential Stabilization Beats a Sharp Stick 2-24-23). That performance comes with the asterisk that it was driven by one region – The South (the #1 region). That new home performance came on the heels of a grim existing home sales report (see Existing Home Sales: Still in Freefall 2-21-23) which dominates total home sales numbers (existing + new).
ETF subsector returns show some differentiation…
The next two charts highlight returns for a range of ETF subsectors by industry group. We update these each week for trailing 1-month and the 3-month periods to smooth out the short-term volatility. We also mix in some broad index benchmarks with the ETFs.
The 1-month time horizon…
The shorter trailing time horizon for 1-month returns in ETFs and broad market benchmarks has taken a decided shift to the right of the zero-return dividing line. We see the bookends of Business Development Companies (BIZD) on the left just ahead of Consumer Discretionary (XLY) and another bad month for diversified energy (XLE) and E&P (XOP) over on the right. We see only 5 of the 21 in positive territory.
As we scan across the list, we see the inflation fears and curve shift hitting duration with LQD at -4.2% while US HY (HYG) with its shorter duration asset base (based on maturities and higher coupons) and better credit returns are well to the left of LQD at -2.2%. HYG was comfortably ahead of GOVT and AGG with LQD the worst of the fixed income ETF pack.
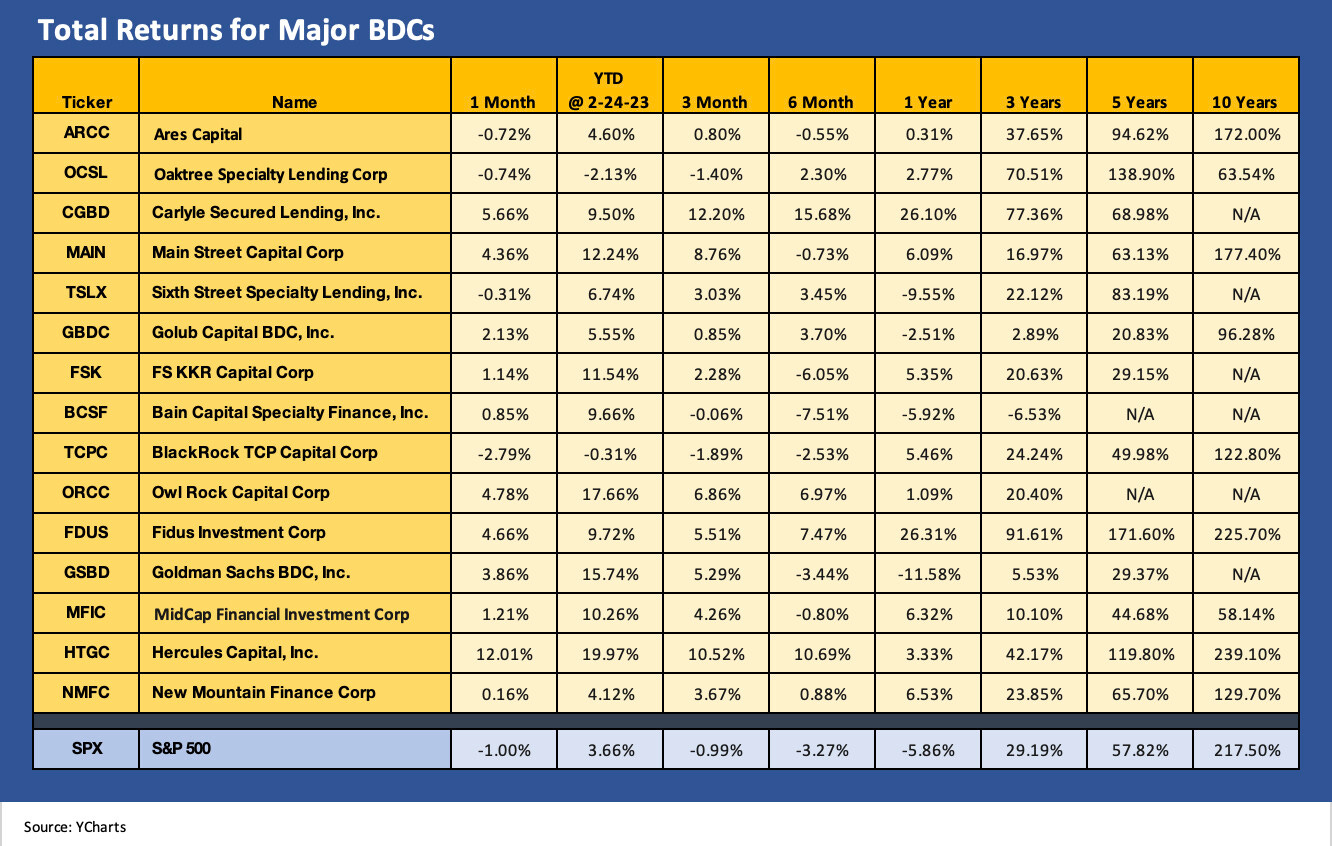
With cycles and rates in focus, the fact that BDCs are doing well should not be a surprise. We included more commentary recently on BDCs in our last weekly (see Footnotes and Flashbacks Week Ending Feb 17, 2023). We need to start rolling up our sleeves and writing more on individual names in this peer group. As a disclosure issue, I still own a number of BDC names but had harvested some for gains during 2022. None are over 2% of the portfolio.
We look at the BDCs from the vantage point of an income product and distinct asset class but also as a strategic subsector. BDCs offer a window into the credit trends of small cap and microcap names (using the more traditional definitions of size from the equity market indexes). In drilling down into the performance at the issuer level, one can get an idea of what is going on in those names in credit quality and relative performance. Numerous BDCs have sector themes but all the major ones have well diversified portfolios by borrowers.
The BDC sector shows a very diverse range of borrowers with more than a few major brand names from private equity as managers. We highlight that not all are tied into the LBOs of the managers despite some generalizations on that topic. The portfolios are heavily concentrated in floating rate loans. As with high yield bonds, BDCs offer one more asset class subsector for yield seekers and income strategies for those with higher risk appetites. There are plenty of others.
Equity stakes and special dividends are other twists in the theme mix for BDC managers. Before the big UST curve shift, the BDCs had been successfully tapping the IG and cusp rated bond markets to lock in low coupons in unsecured bonds to fund higher yielding, secured loans (generally 1L). The average dividend yield on the list above is around 10%. In a 4% cash world (possibly headed to 5%), the BDC equity base offers a rare reach-for-yield asset class these days. It is just one more way to position oneself along the risk-reward spectrum. That asset class is not for everyone, but then again neither are growth stocks.
The 3-month time horizon…
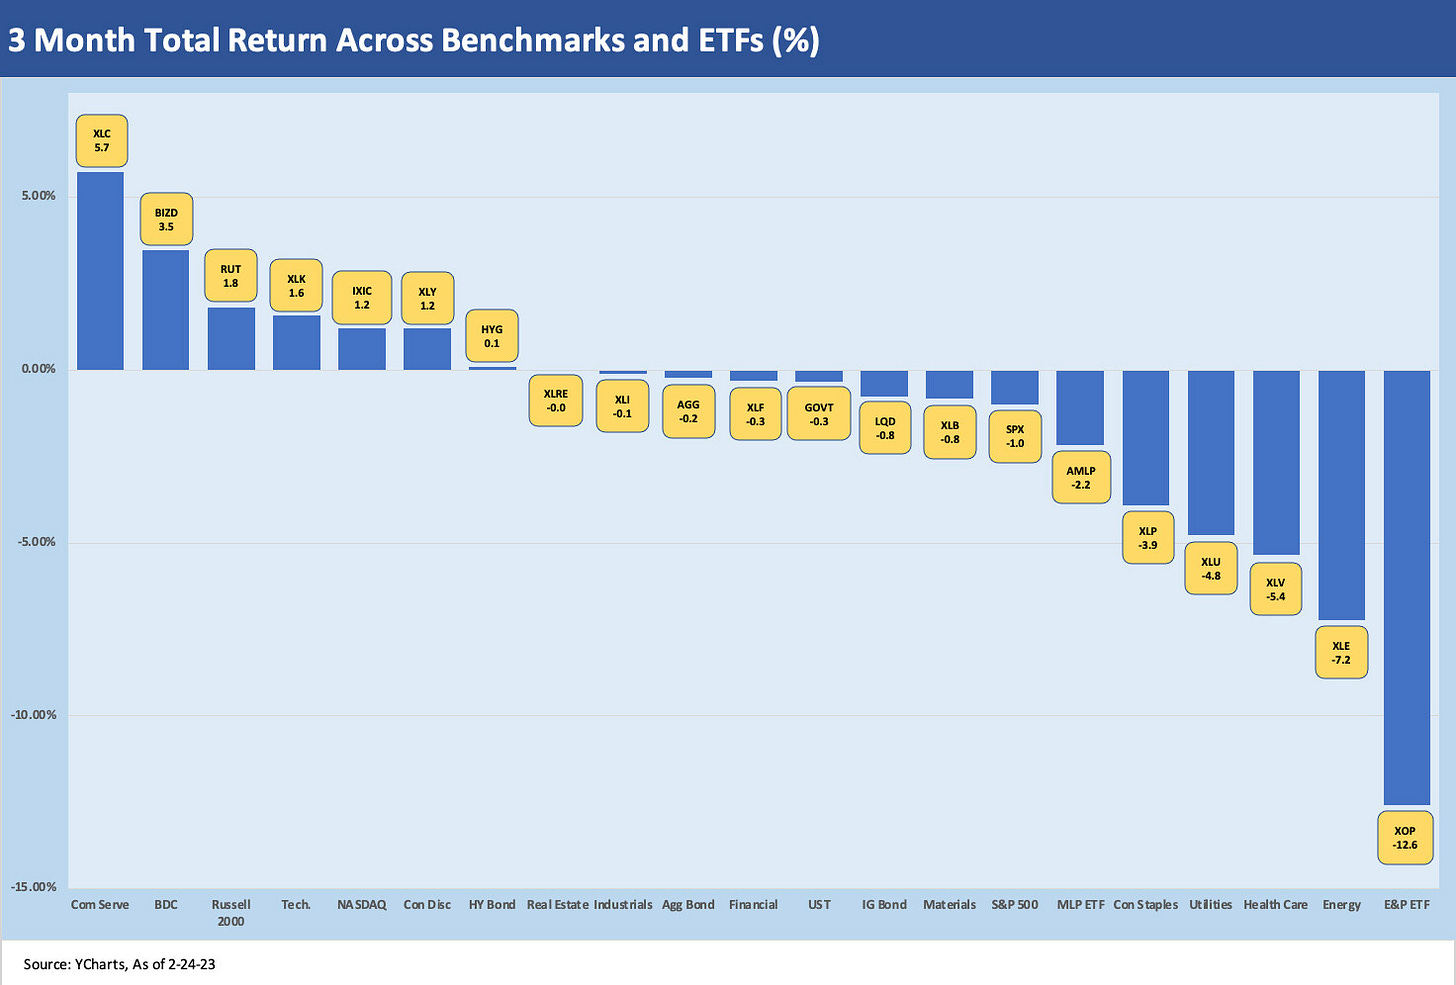
The 3-month time horizon starts its clock in late Nov 2022 and now sports only 7 of the 21 asset categories in positive territory for total returns. That is down from 18 in positive range in our first weekly of Feb 2022 (see Footnotes and Flashbacks: Week Ending Feb 3, 2023).
The 3-month numbers continue to show the old winners of 2022 as the new losers of early 2023. The ETFs in positive range are not low risk or defensive stock plays by any stretch after a rough year in 2022 for bellwether tech names. The Communication Services (XLC) ETF is at the top after being dead last for 2022 (see The 2022 Multi-Asset Beatdown 12-31-22).
XLC at the top includes the usual suspects of leading TMT names (Meta, Alphabet, Verizon, Disney, Netflix, Charter, etc.), but BDCs at #2 is a surprise given the lower visibility of many of those names. The BDC focus for more investors reflects the continued search for income and cash flow for many portfolios. When cash is at 4%, that asset class is around where not long ago you might be looking at a mid-range risk REIT equity. At least cash comes without all the equity market price risk and the fear of inflation further straining the real estate cycle.
Yield Curve Migration
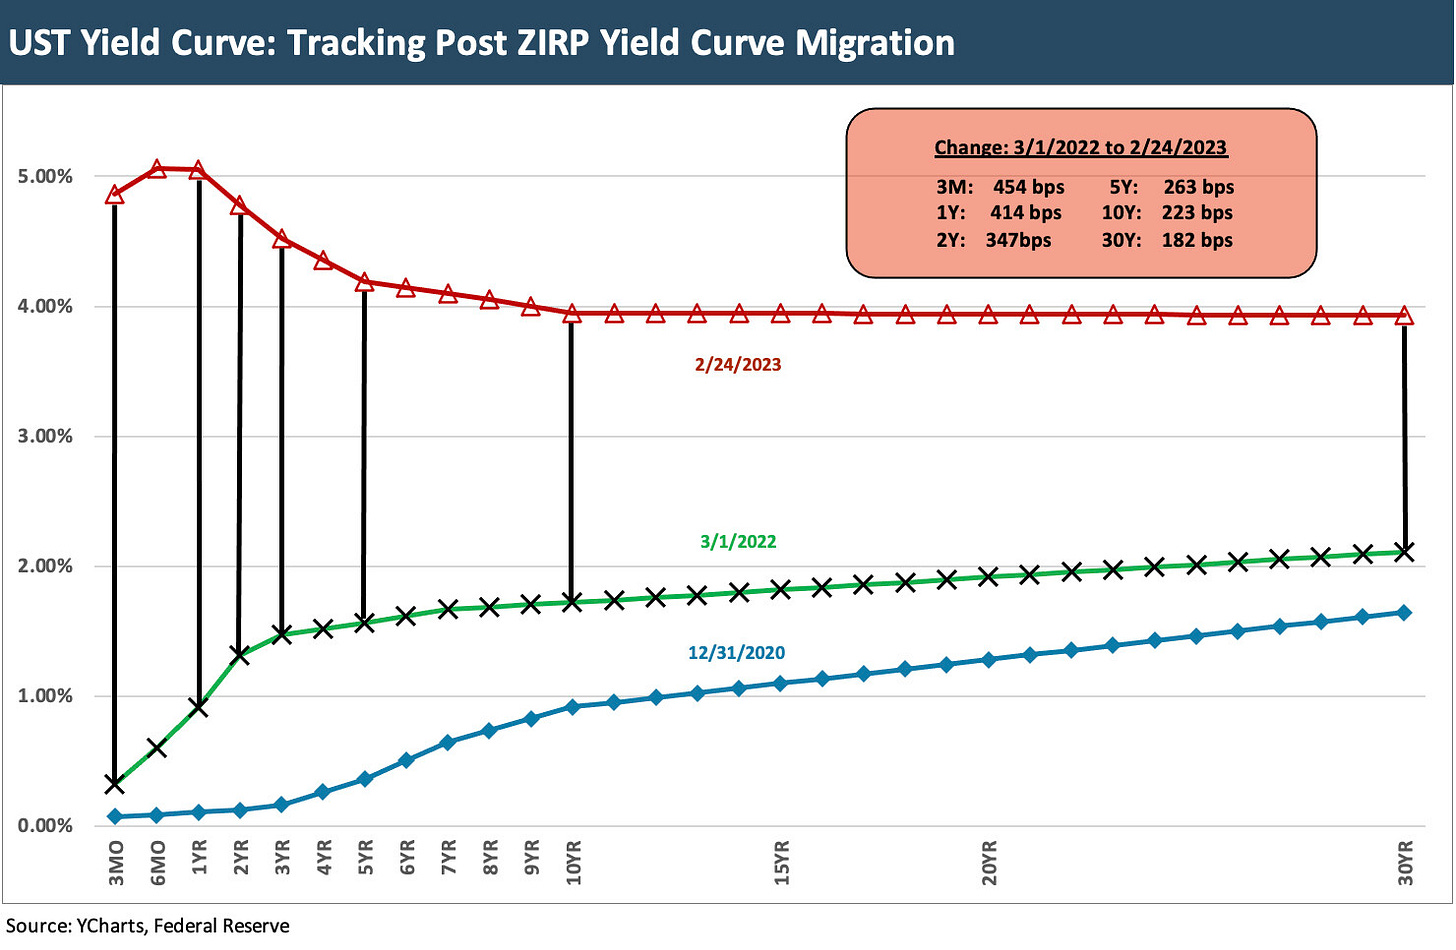
The chart below is one we update in each weekly as a reminder of how far the bear flattener and upward UST shift has moved since early March before the Fed exited ZIRP. Each week we update the differentials vs. March 1, 2022 (the month ZIRP ended). We detail the running differential in the boxed section of the chart.
The simple exercise is to look at the running cumulative shift since March 1, 2022 to current levels and compare this week’s (Feb 24, 2022) to the numbers posted last week. It eases the mental chaos of UST curve watching. Did the differential go up or down? The answer is they all went up. This week was another move higher for all those vertical lines in the chart.
We have been seeing a streak of steady, notable shifts wider this past month with this past week showing another move higher and notably in 2Y to 10Y or the sweet spot of the IG corporate bond yield curve. The 30Y differential only moved in mid-single digits over the week vs. double digits for 2Y to 10Y, but that still hurts on a 30Y maturity.
The 3M to 10Y slope inversion across the cycles…
We prefer watching the UST curve for 3M-5Y, 2Y-10Y, and the 2Y-30Y (see UST Slope Update: Some New Inversion Highs 12-8-22, UST Curves: Slope Matters 10-25-22). That said, we recognize all the yield curve segments’ shapeshifting is important for some aspects of framing relative value across the corporate bond markets. The same is true in using the yield curve slope to frame asset classes these days across cash, IG bonds, HY bonds, leveraged loans, Preferred stocks, BDC equities, and a raft of fixed income mutual fund flavors.
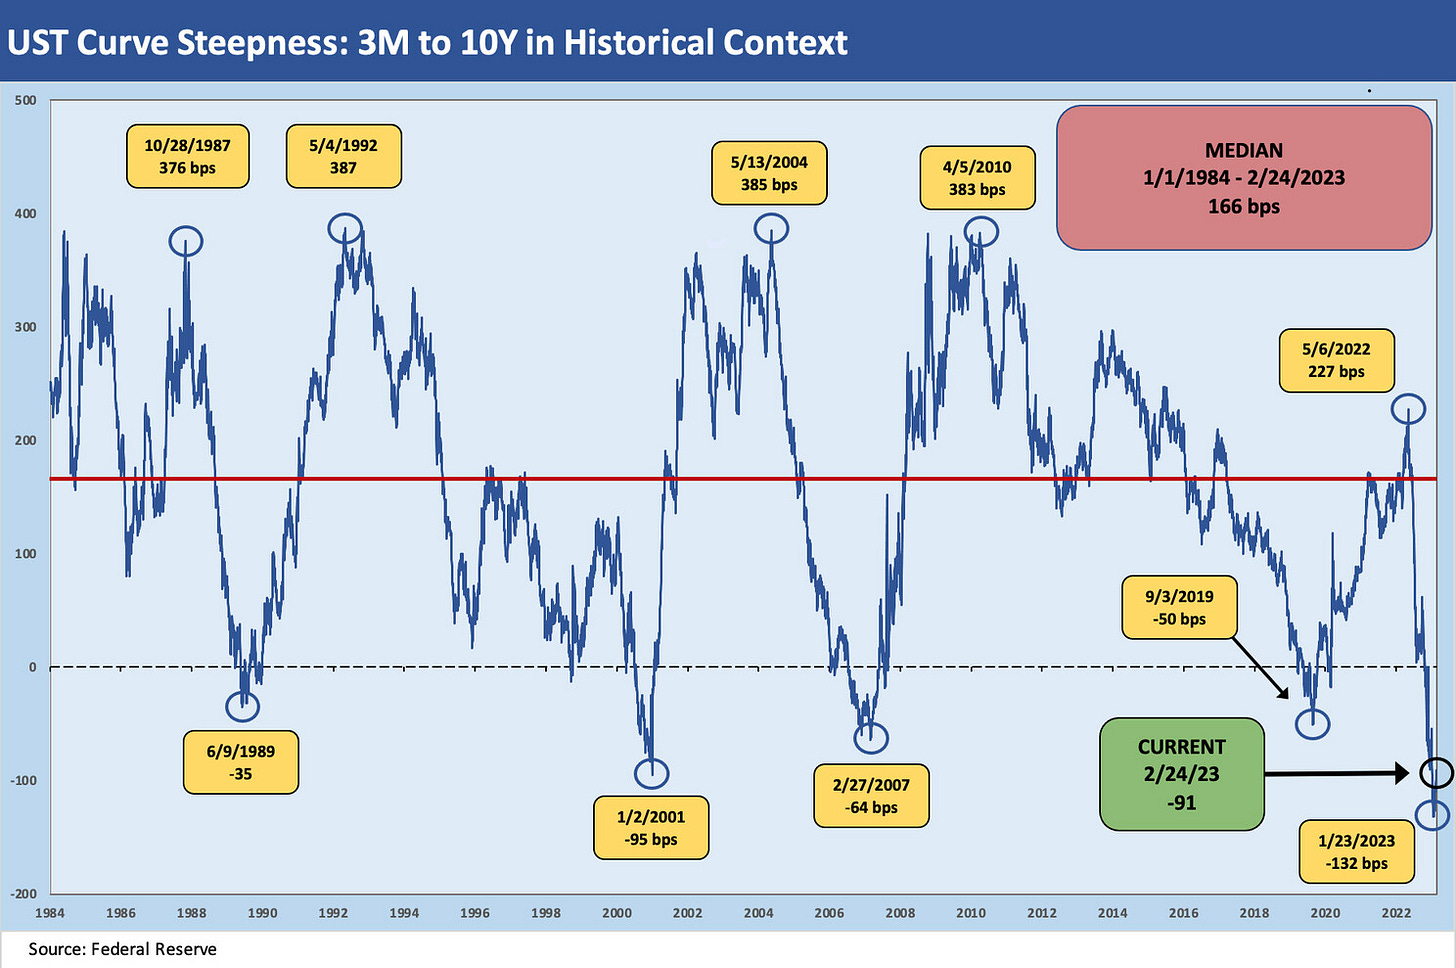
Below we add the 3M-10Y slope history into our collection as that relationship hit a new record for inversion in late Jan 23 and have stayed wide (but less inverted) into late Feb 2023. It is a rare market when cash equivalents can offer a higher yield in a market where the bias on cash yields remains higher. The same is true in a market where broader industry fundamentals are taking a step back in the direction of favorable cyclical dynamics. Duration risk remains a wildcard.
The 3M-10Y inversion stands at -91 bps to end this past week. That is right in the mix with Jan 2001 (-95 bps 3M-10Y inversion) and way ahead of the inversion of June 1989 (-35 bps) and early 2007 (-64 bps). We remember mid-1989 being part of a year where the financial markets were in chaos and the S&L crisis was still unfolding. The “credit cycle” had ended in 1989 in our view (see UST Curve History: Credit Cycle Peaks 10-12-22).
The Jan 2001 period was just ahead of the official cyclical peak but well into a TMT capital markets nightmare that was underway and stayed ugly into 2002. The Feb 2007 date was still rolling into a credit bubble to peak in mid-June, but the housing market had peaked in 2005 and the summer of 2007 would be the beginning of the end on the way to the 2008 implosion.
Strange UST shapeshifting and inversion do not always mean recession…
While the topic has been covered to the point of beaten senseless, we have not had a market with such inflation as we see in 2022-2023 since before the IG market really soared as an asset class in the 1980s. Back then, US HY was mostly a twinkle in the eyes of Drexel who wanted to grow it. On the other end of the asset risk scale (i.e., cash), the 1970s saw new innovation such as “NOW Accounts” that had been an early experiment in cash management before deposit and savings account deregulation became a big thing in the 1980s. The market was early in the game during the Volcker years with money market funds ready to get rolling the last time we saw this sort of inflation. We were also in the Glass Steagall years in terms of the bonds vs. loan menu. In other words, this is a rare market backdrop for inflation with more on the portfolio menu than ever.
The record inversion in late January (-132 bps on 1-23-23) on the way to the current -91 bps opens up a lot of time horizon and asset allocation debates that were not available the last time around when the market saw high inflation or painful stagflation. The 3M-10Y is a rare choice for allocation even if it has always been an important metric to watch. One is defensive with higher income (cash) than the one with more duration risk. That creates a choice on timing and asset allocation.
The 10Y UST also drives 30Y mortgage rates, so there remains a pervasive fear that a bear flattener from the long end might unfold and trigger that recession everyone has been talking about. Such an outcome would undermine investment by raising the cost of long-dated capital. These are not new topics, but the updated chart on 3M-10Y is worth pondering.
MICRO
Housing: Residential Brokerage and Related Services
Anywhere Real Estate hammers home the ugly existing home sales backdrop…
As last week wound down, most of the focus was on the Macro side of the ledger for inflation, another adverse yield curve shift, and how the Fed’s reaction could impact the cycle from the demand side. We had some notable industry bellwethers report. Some of the sectors have been feeling the pain more than most from the yield curve action with some of the same also seeing structural crosscurrents from the rapid shift in growth markets and how that flows into “emerging trends” in retail technologies. One of them was Anywhere Real Estate (formerly known as Realogy) and a leading real estate brokerage operation. The new ticker for Anywhere is HOUS. The other one was Carvana (CVNA). First, we look at HOUS and follow with CVNA.
Existing home sales serve as the life blood of HOUS with its commission revenue stream, and the largest publicly traded brokerage operation is feeling the macro effects. (Among the Big 3 of residential brokerage, two are private with one of them owned by Berkshire/Warren Buffet). The painful EBITDA run rates posted by HOUS at 4Q22 were even lower than the 1Q20 COVID quarter, so it was not good news. For HOUS, the near-term earnings prospects and current leverage metrics do not dovetail very favorably with industry cyclical volatility in mortgage rates and the battered economics of residential real estate affordability these days.
HOUS: Hard to fight the realities of plunging volumes…
Below we include a drill down set of operating metrics for HOUS that adds a more granular twist to the existing home sales we update monthly from data supplied by the National Association of Realtors. The easy way to look at this data is that “sides” are the measure of volume (2 sides as in a buy and a sell). The home price line is self-explanatory. Price can get a lot worse in theory if mortgages keep heading north. Volume could keep dropping if prices do not move. We would argue price has worse symmetry from here than volume.
For companies such as HOUS, volume and price is revenue that is derived from commissions and royalties. There is a lot going on in the industry around tech and efficiency, so that requires sustained investments. As advanced as the tools have become, it is still mostly about “printing tickets,” and that is why so many of these firms are pouring money into tech while also offering exceptional terms to high-producing agents. The terms of deals and the value of producers sometimes undermines the natural stabilizing variable costs of a commission based business. Cost declines cannot keep pace and will be less resilient downward than in past cycles.
HOUS bonds have been battered of late with -6% excess returns MTD into the 12% to 13% range to end the week. The problems in their commission-based revenues were already flowing into the bonds even before the 4Q22 earnings. We see HOUS as in for a very rough ride in 1H23 as running EBITDA stays ugly and the turnaround in existing home sales comes slowly with mortgage rates staying high.
Last week was sobering for those hoping the bond market inversion implied rate relief was on its way soon. The idea that lower inflation expectations will show up in the Fed plan has taken a few weeks of beatings and weighed on total returns in bonds even while excess returns have been supportive. In other words, mortgage rates do not look like they will be on the side of existing home sales for a while.
We will need to drill down into HOUS in a stand-alone report given how complicated the company’s operations are in a market where legal threats to the industry have taken on the nature of a World War Z of contingency lawyers. The gamut of legal claims runs from damaging sellers to damaging buyers to violating antitrust laws. This is one of the mainstay business lines and employers of Main Street America as well as the high price NYC, LA/San Fran, and Miami crowd to name a few of the pricier metros that favor luxury tier brokers. Unlike Big Tobacco and Big Pharma in massive class action cases, the residential broker litigation does not come with a trail of bodies. There are still existential stakes to some broker names that are every bit as threatening. More on that another time.
Business risk meets financial risk…
In past years when we had worked on Realogy bonds (since renamed Anywhere in 2022 in a brand change), the main negative angles on the company’s financial risk were more about leverage and the secular pressure on the classic agent-heavy business models. The idea was that agent-heavy and bricks and mortar franchises were headed for secular pressure if not the scrap heap.
Much was made of the rise of Compass as a usurper of the luxury throne, the disintermediation of old school brokers by tech, and the rise of low cost online players that could push commissions toward 1% handles (e.g., Redfin). The theory was that Redfin with its discount commissions was going to derail HOUS, but Redfin has not been profitable since its 2017 IPO and lost money during the three years before that as well. Compass, the would-be winner of the luxury buyer, generated bottom lines that are deeply negative before and after its 2021 IPO. At least HOUS was profitable each year after its late 2012 IPO (from its LBO) from 2013 to 2018.
Then came the story that the inevitable rise of iBuyers was the new thing as the successful business model. That has failed badly so far, and in some cases in embarrassing fashion. None of the main themes worked out for the most bearish on HOUS/Realogy, but the new problem in 2023 is more about core fundamentals and basic “price x volume” issues. The critical downside drivers cut across inflation, a mortgage spike, and a rising affordability crisis for so many buyers and sellers that are heading toward the sidelines (see Existing Home Sales: Still in Freefall 2-21-23).
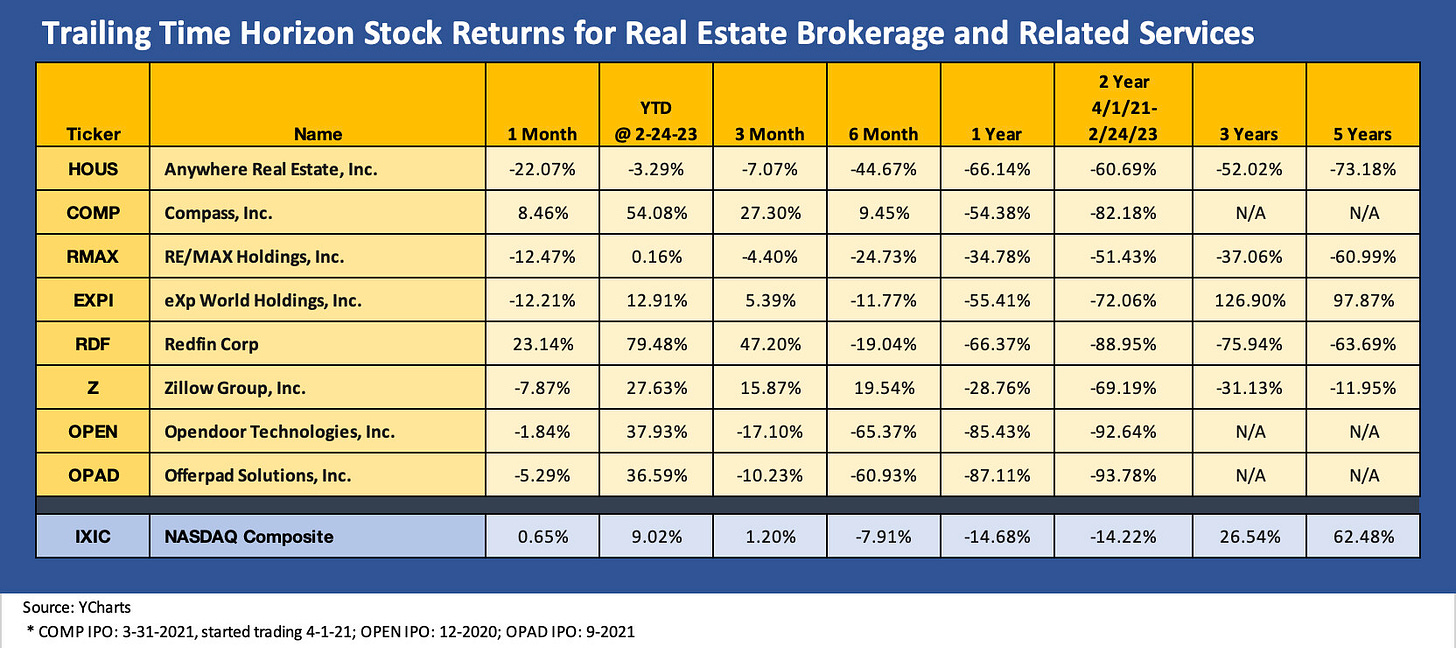
As the stock chart below shows, the new breed of growth companies is getting hit even harder since their IPOs. The demands to innovate and embrace tech and compete for brokers lends an ironic twist to the “all about tech.” After all, the tech theme fades when the competition to lure away brokers has been cutthroat and pressured earnings for both HOUSE and COMP.
The agent hiring battle does not change the need to invest in tech, tools and data analytics from lead generation to screening targets for maximum broker productivity. The investment demands and competition hit HOUS and generated losses in 3 of the past 4 years (without adjustments for write-offs and goodwill impairments). HOUS did post a very strong 2021 that was consistent with the high profits from 2014 to 2018.
The stock chart below shows how some of the new school and old school made out over the past 5 years of constant innovation and IPOs.
As you look at the list above, most were not public companies 10 years ago, so we left that column off this one. The Big 3 (Home Services of America, Anywhere, and Keller) has only one public company. Upstart Compass just priced its IPO at the end of March 2021 and started trading on April 1 (thus the column above named “Almost 2 years” since we wanted to get COMP equity in the mix).
The level of activity in the real estate related business models is reflected in the waves of tech-centric startups and IPOs. Some of the more notable companies that have seen IPOs in the post-crisis era are in the chart above. iBuyers were crushed and more seasoned names were battered when they stuck their nose in iBuying (notably Zillow). Data was quickly becoming commoditized, so the latest web-based upstarts (Zillow) quickly looked more like incumbents.
The theory has been that the retail models on residential real estate are the most antiquated, inefficient, and thus overpriced in terms of services delivery. Those who make the case can make it sound very believable, but then they need to contend with the reality that the overwhelming majority of home sellers end up working with a human broker even if they extensively research the game plan for their transaction on the internet. Such surveys are not hard to find on the web or in the trade rags (though real estate publications are often rather axed on the topic). The empirical evidence is the agents matter.
The result of the push to add more tech to residential real estate has attracted many billion in capital from venture money to IPOs across data, transaction tech, lead generation, and all along the food chain to discount brokers looking to reprice commission structures to iBuying as the next new, new thing. Many of these ventures have made entrepreneurs and private equity backers very wealthy before the post-IPO deals started falling flat on their welcome mats in the face of their first big financial and cyclical tests. Some of those major underperformers are in evidence in the list above.
In the narrower context of HOUS, they have shown they can adapt to tech-based tools and data and exploit the services being made available through even more start-ups to arm the agents. The problem for them now is earnings and cash flow. They did a great job lowering their secured debt mix and extending liabilities, but the bonds have been battered this month. The multiples of EBITDA do not stack up well against the debt balances with bad EBITDA trends ahead and static debt levels.
Automotive Retail and Related Services
Carvana is back with another very bad quarter…
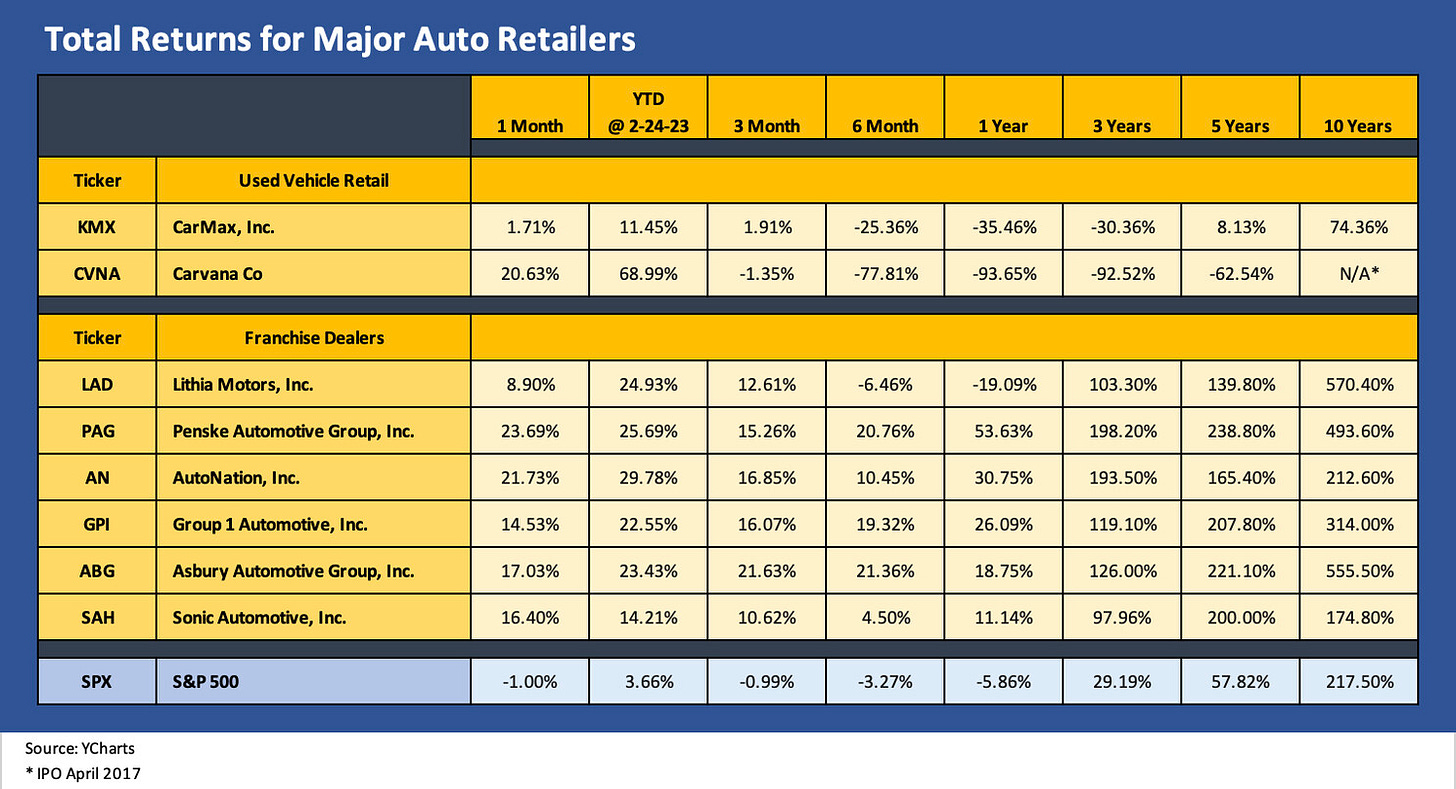
We had looked at Carvana and shifting dynamics of the used car markets in past commentaries (see Carvana: Wax Wheels 12-8-22, Market Menagerie: The Used Car Microcosm 11-29-22.) The latest 4Q22 report just keeps the heat on some directional changes as the reality of the day for a company that has seen its stock plunge from $370 in Aug 2021 to an $8 handle to end last week. We also looked at the main Auto Retail themes at some length in a recent comment (see Footnotes and Flashbacks Week Ending Feb 17, 2023) where we framed how well the major players were doing in their new vehicle sales operations and materially outperforming the markets.
Some of those major players have invested heavily in any combination of online retail channels and used car operations including dedicated branding of used car retail units. Lithia and Sonic were the most aggressive in that area, and their stock hiccups affirmed that the used car investments are a longer-term payback period given recent trends. As the chart shows, both Lithia and Sonic have still had exceptional runs despite some used car setbacks. Lithia has been especially aggressive in investing in online used car retail. Industry used car leader CarMax is also showing some wear and tear. CVNA is squaring off with some large well-capitalized players.
The track record looking back a year tells the story for CVNA. The same for the 6 months period. The company bounces off lows occasionally with big percentage swings, but that is for a company that hit a $370 handle in Aug 2021. As with the earlier commentary on Anywhere Real Estate, some business lines in Auto Retail are going through rapid changes in distribution and ecommerce initiatives that require a lot of investment to compete with upstarts. In some cases, those investments are “just in case.”
Every edge will count in the competitive game for the major retailers, and the online players have been badly battered. Those sorts of setbacks for squaring off with large asset-risk incumbents is hardly a new development. It was true in online trading for bonds, in online retail banking, in online retail generally, in online stock investing, in online residential brokerage and in online used cars retailing. We see a trend in there somewhere. The trick for some (not all) of the incumbents is to neutralize the “new guy’s” strategy, take them on head-to head (or enough to make them feel it and dilute some of their innovator and disruptor gamesmanship), and exploit every advantage you have from your legacy business.
The problem for Carvana is that the incumbent auto retailers have a long list of legacy business advantages and most notably a natural source of vehicle supply on trade-ins and lease returns. They also have materially higher credit quality, established parts and services operations, established F&I business lines and deep management teams.
Asset protection helps when a company is expanding and needs to keep investing to serve its geographic reach for more customers and vehicle sourcing. The legacy auto retailers also have a ready source of new revenues and geographic expansion through the recurring M&A and estate planning of so many privately owned small dealer groups. The large public dealers just keep growing and have a growing supply of new and used vehicles to run through their own channels.
If this were Howard Cosell, he would be screaming “this fight must be stopped” (add his distinctive voice over). For CVNA, the super voting stock and recent moves to protect tax benefits as a defensive measure will keep this fight going. The franchise has value as an operation, but the debt-heavy balance sheet against consistently negative EBITDA is not an aphrodisiac for a bidding war.


