
Footnotes and Flashbacks Week Ending Feb 17, 2023
We look at multiasset returns; 2Y-30Y; the bear UST flattener, energy laggards, car rental, auto dealers, cap goods, and BDCs.


This Week’s Macro: Broad index returns; index laggards and the underlying; ETF benchmark 1-month and 3-month returns; running bear flattener differentials since ZIRP ended; 2Y-30Y slope update.
This Weeks’s Micro: Automotive Services: Avis in another universe; Auto Retail: AutoNation, Lithia, and Sonic weigh in; Capital Goods: Deere on a roll; Business Development Companies making a mark in secular trend.
MACRO
For new readers, in our Macro section we look for notable economic releases or trends signaled by bellwether industries from the top down. “Macro” is one of those flexible terms, and I have often used terms like “Macro from 10,000 feet” (like SAAR) or “Macro from 30,000 feet” (like inflation). We would use terms such as “Micro Macro” to refer to areas such as oil prices and commodities cycles or housing sector demand. In this publication, we will stick with one word: Macro.
Comparative Asset Returns

The chart above updates the broad benchmarks for fixed income and equity return over a range of trailing time horizons. The running 1-month is seeing a bit of a fade in fixed income returns on the yield curve action and some spread widening in credit the past week after the very impressive rally we saw in January (see Footnotes and Flashbacks: Week Ending Feb 3, 2023). For the IG market, we see ICE reporting a negative total return (-66 bps) and negative excess return (-21 bps) on the week on the UST curve and slight spread widening. In US HY, the negative action was slightly higher at just under -1% total return and just over -60 bps negative excess returns.
The inflows into IG bonds are getting a lot of airtime as investors try to adjust to the idea of IG corporate yields in a range that begins with a 5% handle after seeing so many HY bonds printing 2% and 3% handles for so long. We had seen a rare 5% handle even on a CCC here and there over the years. Those times are when the term “relative value” is more like “need to invest.”
For those in multi-asset class frameworks, the idea of an IG bond well above a higher yielding dividend play in equities (e.g., REITs) makes any combination of cash holdings and short to intermediate IG bonds something to consider as a core holding as the variables get sorted out. The foregone coupon has some relief in 4% handle cash yields (and heading higher). The market is still working out the moving parts of inflation, cyclical fundamentals, the last round of earnings season guidance, and amorphous but very real risks of heightened geopolitical turmoil, trade spillover, and the crazies in Washington sending the UST past debt ceiling brinkmanship into an actual event of default.
The longer tail of names in equities frames the risk rally…
We added the chart below this week for a more comprehensive view of the equity landscape across investment flavors (growth vs. value) and in terms of broad sectors in financials, industrials, energy, and real estate. We wanted a chart with the full run of large to small caps. The chart shows that after a serious body slam in 2022 for growth and tech, the “worst shall be first” rebound is bolstering growth and tech of late despite the yield curve’s upward pressure (see below for the curve action).

The performance of growth and “long duration equities” has been a source of debate around how counterintuitive that rally has been in the face of more yield curve pressure. The problem with long-dated, forward valuation models are not new. Even arguing about the proper discount rates in the usual bear view is hard to resolve. Sometimes the commentators just throw out “oversold” and “dash for trash” among the usual terms, but those terms amount to “who knows” with so many wildcard variables ahead.
The value subsectors and mature industry sectors are where we spend our time generally, but even many of those are also going through rapid evolution of secular industry changes from autos to energy. Sectors such as auto manufacturing, capital goods, car rental, and auto retail are all touched by aspects of the growth market business line trends.
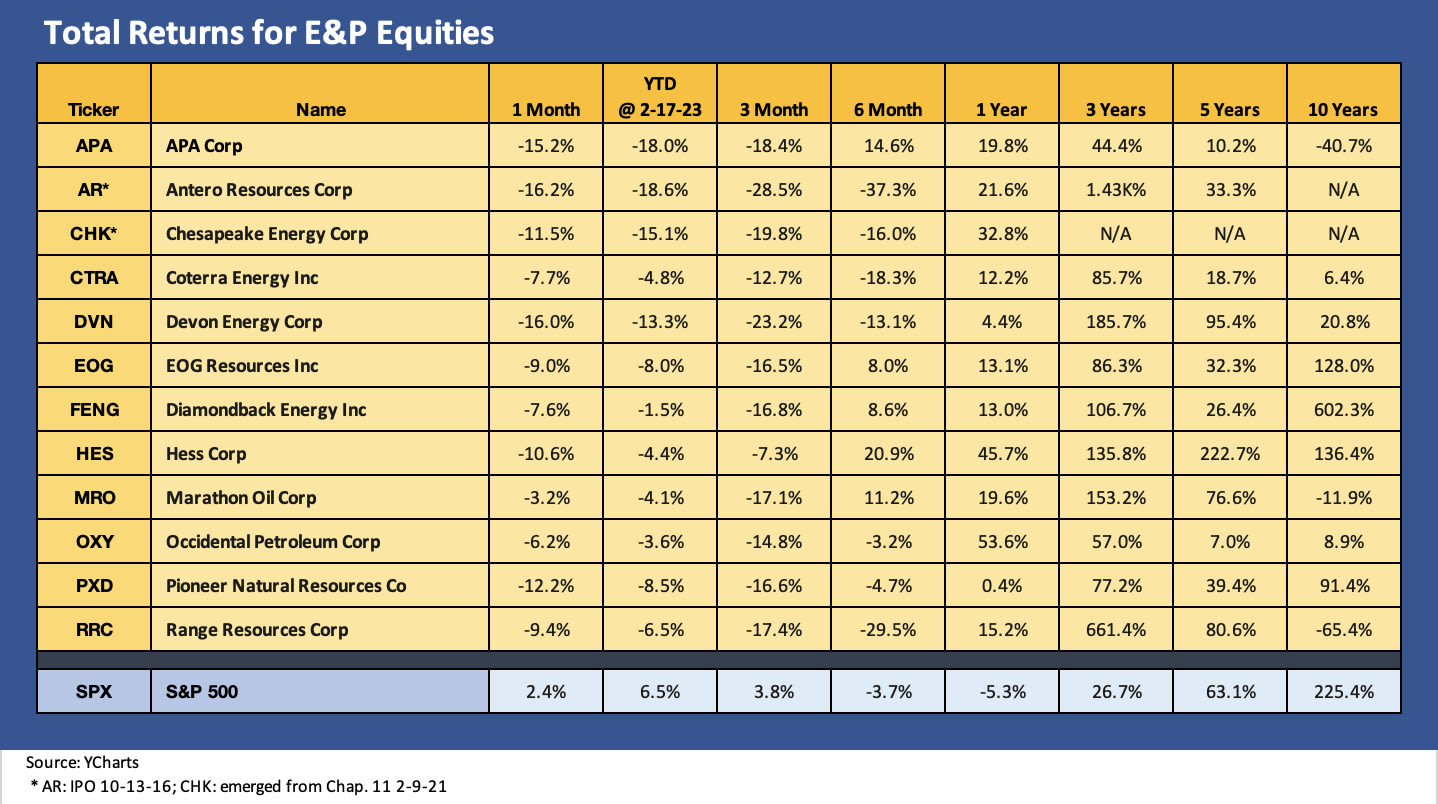
The YTD total returns are very solid for almost all risky assets after an outsized positive performance for so many subsectors in January. In contrast, the Energy story line is coming down off its highs as oil and natural gas prices see pressure and forecasts get notched down by the street and many industry watchers.
E&P equities have seen numerous bellwether names take a beating YTD with negative returns (DVN, APA, CHK, PXD, EOG, OVV, etc.). Those names are intrinsically volatile, and the price action has been down. For now, weather is hurting natural gas coming out of its peak demand season while “oily” upstream is getting rerated by various street watchers on the commodity supply-demand themes. We detail some major E&P upstream names below.
The Midstream is still putting up very strong free cash flow after scaled down capex. The results have left the majority of the major midstream names well ahead of upstream in stock returns YTD and also ahead of the broad market in total returns. Refining bellwethers still tell a positive story line. Downstream has been more mixed but bellwethers such as MPC and VLO have outperformed the Energy sector and the broad market YTD.
ETF subsector returns show some differentiation…
The next two charts highlight returns for a range of ETF subsectors by industry group. We update these each week for trailing 1-month and 3-month periods to smooth out the short-term volatility. We mix in some broad index benchmarks with the ETFs.
The 1-month time horizon….
Below we frame 1-month returns for a group of 21 ETFs and broad market benchmarks that cut across a wide range of narrow industry subsectors and asset classes, including equity and debt (AGG, LQD, HYG, UST).

Energy has been the running loser with XLE and XOP on the bottom of the list. We see the Midstream ETF AMLP barely in positive territory over the 1-month time horizon but numerous constituents in that group are well above the ETF portfolio YTD. In YTD returns, we have seen strong total return numbers out of Plains (PAA), Western Midstream (WES), MPLX (MPLX), Enterprise Products (EPD), Magellan (MMP), and TC Energy (TRP) among others. Some of those such as TRP are posting modest rallies, but this is set against a negative LTM period in equity performance.
Numerous MLPs and Midstream C-Corps have been generating favorable total return performances vs. the market over the past year and scored double digit total returns in weak markets LTM. Those performances came on favorable fundamental and high (and safe) dividends for income added to price returns. We generally view the risk profiles of Midstream energy names as materially lower than the E&P names with less downside and less upside.
The chart also shows the BIZD ETF performing well in the ranks for 1-month and 3-month returns. Floating rate leveraged loans managed by top managers offer interesting choices for the income oriented given the upward move in the yield curve, the quality of the firms involved, and the idea that the cycle is holding in better than expected. The dividend yields are double cash returns in this market and there is a healthy divergence in price action across that peer group. We break out some of the BDC sector names in our Micro section further below.
In the interest of disclosure, I have been active in a number of the Midstream and BDC names in a retirement dividend portfolio. I have no near-term plans to add or reduce exposure in any names in the coming weeks. None comprise over 2% of my overall portfolio. We are comfortable with higher risk credit and the cash flow and earnings fundamentals of those names.
The 3-month time horizon…

The 3-month numbers continue to show the old winners of 2022 as the new losers of early 2023. Energy has the main victims YTD after a banner 2022 as discussed earlier in this report. Risky equities have trumped more defensive names. Unsurprisingly, equity beats credit in a risk-on market with HYG, LQD, AGG, and UST lagging even if performing well in a fixed income context with the UST curve feeling some pressure in Feb 2023.
Yield Curve Migration
The chart below is one we update in each weekly as a reminder of how far the bear flattener and upward UST shift has moved since early March before the Fed exited ZIRP. Each week we update the differentials vs. March 1, 2022 (the month ZIRP ended). This past week, we saw more action along the curve that hurt duration and gave bond total returns a haircut. All maturities broken out in the vertical lines in the chart moved higher from 5 to 10 bps since our last weekly. The prior week edition had seen the UST curve move even more with 5Y-10Y-30Y all moving higher from our last version by around 20 bps.

The combination of positive or some more favorable fundamental economic releases (e.g., retail sales, industrial production) and bellwether revenue and earnings guidance in reporting season is leaving the market seeing a more resilient economy. This runs from steady demand and strength/stability from the consumer sector and also extends to industrials (see Capacity Utilization: Tailwinds Return 2-15-23 ). The stubborn inflation metrics indicate a protracted policy battle (see CPI: January Big 5 and Add-Ons 2-14-23). We have seen more street handicapping pushing out the timeline and edging up on fed funds terminal rate estimates.
The 2Y-30Y is back to a duration play, not a yield comp for an extension trade…
The chart below updates the 2Y-30Y slope as we saw that inversion hit a new multicycle high this past week. The -79 bps inversion eclipsed the -77 bps that we flagged on the chart back in May 2000. Back in the spring of 2000, the market saw the infamous inversion that sent the street scrambling trying to figure out a way to hedge their inventory. The problem then was not only new issue UST supply fears but also a sense that some major investors were cornering the 30Y. As a reminder, the audacity of the US government to balance the budget with bipartisan action in an election year was causing the UST supply problem. Those were the days…

The inversion dialogue has been going on for months as the Fed rolled into its tightening cycle, so the phrase “inversion as a recession predictor” has been more than a little overused. The 10Y to 30Y slope is a slight positive while the 5Y to 30Y was slightly inverted to end the week. The main action is on the short end of the yield curve with the 6M UST and 1Y UST cracking 5% this past week. Usually, all eyes are on the 2Y as a critical maturity as numbers come out. The 2Y is sitting closer to 5% than 4% (4.62%) as we go to print.
In terms of asset returns, the interest rate risk vs. credit risk debate is alive and well with cyclical question marks looking at below-median spreads and recession fear reduced (but hardly forgotten). The interest rate risk equation leaves investors staring at a yield curve backdrop not seen in decades given the inflation factor. The forward view on UST rates is starting at a much lower absolute UST level now than in those bygone years of the late 1970s and early 1980s when it was running alongside inflation fears. In contrast to those earlier years, we have FOMC members today who stand in line to give speeches on the topic. That keeps the market on a razor’s edge in trying to read policy minds.
MICRO
Automotive and Related Services
Avis earnings and cash flow boom reconditions the credit risk profile…
Avis reported record revenue and EBITDA the past week with the benefits of a larger base of earning assets (rental fleet), materially stronger pricing in 2022 and 2021, and plunging costs per unit that came with the soaring value of used vehicles. During the past cycle, a lot of investors got familiar with the concept of vehicle depreciation as a cash cost to a car rental company (i.e., to reimburse the vehicle fleet funding operation). The upside of the cash benefits for Avis shows up in the metrics we detail below. The mix of moving parts (spiking prices and much lower fleet costs) falls into one of those small buckets (shot glass?) that contains “six standard deviation events.”
The car rental industry is going through many changes beyond the legacy business of airport rental as car ownership patterns change, “mobility” becomes a multi-layered services sector, fleet management becomes a more crucial business for the future with changing technologies, and the next generation of auto tech creates a need for more operational plans to exploit the revenue opportunities from EV to AVs.
The customer and operational sides of car rental are both intertwined with the rise of connected vehicles, new revenue models and fleet analytics used to optimize fleet (size of fleet, model mix, geographic distribution, etc.), and pricing strategies (how much to charge for what and where to charge it). The whole story gets more complicated the more you look at it, but the tech strengths flow back directly into revenues and costs.
Avis and Hertz are now a distant #2 and #3, respectively, behind investment grade Enterprise with its much more efficient use of capital to fund fleet (i.e., not a HY rated ABS funder). The new industry lineup is now showing Hertz as #3 behind Avis. Avis and Hertz have been on a wild ride in recent years with Hertz obviously in a class by itself given its adventures in Chapter 11 and its brinkmanship around the auto fleet lease structures that are the cornerstone of fleet financing for both Avis and Hertz. We will review that history at another time in other research, but the ending was good for all in the industry and salvaged the fate of bondholders for those who stayed the distance in the cash markets (see Not Your Father’s Hertz 2-7-23).
Avis and Hertz are two of those names that touch upon mobility services nuances, travel volumes overall, the evolution of auto technology, and the potential for more dramatic shifts in car ownership practices. The customer channels will make car rental service providers crucial linchpins in raising customer awareness of EVs as an option for a “tryout.” Hertz has already jumped into EVs with a lot of fanfare, and Avis and Enterprise will be on the job in EVs as well.
Given that broad reach of car rental, we throw Hertz and Avis in with a hybrid peer group for stock watching. We include travel and leisure and some mobility services. We include Carvana even if just as a used car proxy that is also involved in car rental fleet remarketing with Hertz. The used car remarketing channels continue to face challenges in the volatile used car market given a constantly changing lineup of the players.

The running stock returns above underscore that Avis has been the place to be since the Hertz Chapter 11 exit date at the end of June 2021. The last 6 months and 1 year time horizon show a wide range and dispersion across the group. For the YTD period, Avis still holds down the total return derby vs. all but CVNA, who gets an asterisk for a drop in the stock from $370 in 2012 to an $11 handle as of Friday. For equity holders looking to be in this space, Avis has established itself as the safer way to play the next stage of evolution in car rental and the strategic offshoots into integrated mobility. Both Avis and Hertz will be one of the “showrooms” for the next generation of EV and AV technologies.
While there will be a lot of equity valuation exercises going on from here given a recent history that is such an outlier from “normal” industry conditions, the credit story for Avis remains very much intact. Avis showed prudent liability management actions taken across the period of industry turmoil into 2021 as Avis then rode soaring profits and cash flow into a $4.1 billion EBITDA line. That EBITDA run rate was not too far off from its total corporate debt of $4.6 bn and on top of its net corporate debt. The EBITDA was overwhelmingly concentrated in the Americas segment (mainly the US) with $3.7 billion in segment EBITDA in 2022 vs. $2.4 bn in the Americas in 2021. International segment EBITDA was $560 million. The $87 in corporate elimination brings the consolidate corporate EBITDA for 2022 to $4.13 bn.
Below we highlight some of the relevant operating data that drives the numbers. We include these as a reminder of the main ingredients of the operating performance: fleet size, fleet costs and pricing (Rev per Day). The sensitivity to pricing in this business is exceptionally high on the flow-through effects, and the chart shows the $50 handle pricing of 2020 and early 2021 soaring to $80 and $70 handles.
Meanwhile, the strength of the used car market sent unit costs plunging to $10 by 3Q22. That has helped build equity cushions in the ABS structures for the next round of fleet expansion. For a pre-COVID example, per unit fleet costs for Avis were $309 in 2017 and $308 in 2016 for the full year. That offers some sense of how distorted the used car market was in 2021-2022.

Avis is still very much focused on shareholder returns as evidenced by its $4.8 bn in stock buybacks during 2021-2022 including over $3.3 bn in 2022 alone. The operating statistics covered in the chart above really hammers home the stunningly positive influence of risk earnings variables during 2021-2022 as Avis bounced off some near fatal threats during 2020 that had sent Hertz into a liquidity crisis and bankruptcy.
There are still all the same moving parts to monitor as Avis enters a new period of shifting variables across supply-demand balances in the broader industry rental fleet and what that means for pricing and used car residual risks. There is also what the SAAR rates and production challenges might mean for pricing given changing relationships with the OEMs on new car prices.
There is also the travel flow and whether leisure vacation will stay so strong and to what extent the rebounding commercial business will continue a comeback as Avis cited on its call. The pre-COVID challenges around customer services and management fleet remarketing risks and bringing more technology solutions to all aspects of the business are all still there to be wrestled with.
The EV revolution is further along now than in the COVID crisis, and EVs as a factor blew past all the AV hype of 2017-2018. EVs are now a front burner planning item for activities in 2023-2024. Car rental will be an industry to watch closely for many reasons including how companies such as Avis team up with OEMs, charging infrastructure providers, local utilities, airports, and local officials. Avis discussed some of these issues on their earnings call.
Automotive and Related Services
Auto retail and franchised dealers: the rest of the Big 6 weigh in…
The past week the remaining 3 of the Big 6 franchised dealers posted their earnings as AutoNation (AN), Lithia (LAD), and Sonic (SAH) reported after the prior releases earlier in reporting season from Penske (PAG), Group 1 (GPI), and Asbury (ABG). The week included two of the remaining top 3 players in Lithia and AutoNation. PAG is #1 by market cap and based on quarterly revenue run rate for 4Q22, just edging out LAD on 4Q22 revenue but more comfortably ahead based on PAG’s market cap of $11.0 bn, ahead of LAD and AN who hover around $7.4 billion in market cap at last count.
The franchised auto retail business is still smoking hot after the supply chain delays and shortages of new vehicles. The disruptions to operations and supply chain issues had created many inflation distortions in used car valuation on supply-demand imbalances between available new and used cars. We had looked at Penske and the peer group in our last weekly as well. We also looked at the backdrop of SAAR rates with the sharp sequential move higher in January (see Footnotes and Flashbacks: Week Ending Feb 10, 2023).
Earlier we took a look at GM and Ford as they enter capex-intensive years including outsized investment in EVs. That comes after two years of near recession-level production volumes on the supply chain problems and notably in chips (see Footnotes and Flashbacks: Week Ending Feb 3, 2023). In other words, a lot of moving parts is not a new condition for the auto and related services story lines.
Auto retail sees very strong demand but a mixed picture in new vs. used…
The auto retail sector is running alongside a virtuous cycle of supply-demand that drives pricing power at a time when the consumer sector had shown solid demand for both new and used cars. The rapid shift had sent inventory management into total turmoil but strategic plans cannot turn on a dime as seen with Carvana and used car strategies at Lithia and Sonic. The good news is high demand with unemployment recently setting a new 50-year low at 3.4% or the lowest since the late 1960s (the all-time low was 2.5% back in Eisenhower’s first term).
Demand is stronger for new vehicle dealers than used right now on a relative basis. On the other hand, the more cars that get traded in, the more used cars the dealer can resell or, alternatively, that they can recondition as certified and sell at higher price with warranty programs. The timing is all, and the midyear stretch of 2023 will hold a lot more clues on how some of the names in the stock charts herein will react.
The lurking headwinds are higher financing costs and concerns around recession risks. The intermediate and longer-term risks that the industry chatter debates is changing car ownership patterns that might direct business away from dealers, the potential for EV start-ups to reject the dealer model, EVs as a rule needing less parts and service work (a high margin business for dealers), the theoretical threat of changes in Federal laws that overrule state franchise laws, and shifts in laws at the state level that threaten traditionally protective laws that support dealers.

The total return stock chart above tells an impressive story about recent returns on franchise dealer stocks. The recent earnings season and YTD numbers show franchised dealers trouncing the broader market. The franchised used car dealers are very strong free cash flow generators and have both organic expansion opportunities and the ability to “buy revenue” by continuing to roll up successful private dealerships of various sizes. The vast majority of dealer entities are private, but the market share and revenue share of the majors just keeps on growing.
The boutique banks operating in the car dealer M&A space show up a lot in trade literature as that business promises to keep on growing as dealers reassess the future and their estate planning for so many family-owned operations. There will be a lot of opportunity ahead in the space but also a lot of challenges in product strategies, risks of shifting business models (notably around EV growth), and uncertain variables around legislation and OEM game plans. The generational wealth factor is likely to lead to sustained M&A ahead as one of the capital allocation strategies to drive stock value.
The stock chart also highlights the recent struggles over in used cars as trailing 6 months and 1 year show the carnage for Carvana as loss generating digital retail channels were repriced. Since 2021, the crypto-esque journey from a $370 stock price in Aug 2021 to the current $11 handle at Friday close is something you don’t see very often. The used car operations of the highly profitable franchised new vehicle dealers also showed the setbacks for used car profitability but were overwhelmed at the revenue and earnings line by the strength of other dealer operations whether new vehicles sales, parts and service revenues (“P&S”), or finance and insurance operations (“F&I”).
A quick summary of the latest auto retail earnings wave…
We highlight some of the specifics in the earnings releases to help draw the picture on the moving parts of results that saw the word “record” used in abundance.
AutoNation: AN lit up the screen Friday with its results and saw a +11.4% pop in its stock to over $157. The full year and 4Q22 record in revenue and earnings went along with record free cash flow of $1.7 billion. The cash generation allowed AN to reduce its share count by 25% on buybacks. The share count has been reduced by around half since the pre-COVID period. The EPS number was +30% YoY so AN has been making sure the shareholders stay happy in a space where the Big 6 are all doing well. The past two years has seen AN buy back more than $4 billion in shares.
AN is doing all it can to take advantage of conditions that are extraordinary in terms of demand and pricing power for the OEMs. Such numbers are not sustainable, so AN just keeps on reducing the share count. The SAAR lift we already saw in January is before the spring selling season has even arrived. The near-term demand outlook remains positive subject to production rates and supply chain consistency in what could be a vulnerable year with China that leaves the auto supply chain on edge.
The new vehicle volume increase feeds the used car supply for trade-ins at what will presumably be more attractive inventory carries that will reflect that market shifting into deflationary mode. AN’s used car operations “self-sources” around 94% of its vehicle acquisitions. Used vehicle revenues rose 12% for FY 2022, but gross profit per unit declines by over 12%. Total gross profit for used vehicle declined by almost 20%, but the gross profit of $553 million was still a material contributor in total gross profits of $5.26 bn for FY 2022. Parts and Service brought in $1.9 bn in gross profit and F&I $1.44 bn in a reminder that the auto retail story is about a lot more than new car sales.
Lithia & Driveway: Whether you still call the company Lithia Motors or Lithia & Driveway, LAD has been one of the most aggressive in expanding its operations via acquisition and via investment in online channels and its Driveway operation established in 2020. LAD stock had been flying high on its growth plan across its businesses including a more ambitious set of online retailing plans. The company printed cash acquisitions as detailed in its cash flow statement to the tune of $5.1 billion across the period from 2020 to 3Q22 with $2.7 bn in 2021 and $1.5 bn in 2020 before just under $1 bn through 3Q22. In revenue terms, LAD acquired $3.5 billion in annualized revenue through deals done in 2022.
The hectic growth strategy is reflected in LAD results with record revenue and material increases in used vehicles sales (+29.9%) in FY 2022. Gross profit per vehicle was +7.6% and F&I per unit was +12.3% so growth has been successful even if unnerving for some shareholders given the relatively greater focus on M&A vs. buybacks such as at AutoNation. Driveway has been aggressive in finance operations, and that will require some monitoring ahead with a portfolio now over $2 bn.
Sonic Automotive: Like the peer group, SAH posted up very strong 4Q numbers with record quarterly revenues and gross profits that added to a record full year for 2022 in revenues and gross profit. Looking back across the trailing time horizons from 1 year, 6 months, and 3 months, SAH was somewhat like Lithia in seeing its stock underperforming peers as those two were among the most aggressive in pursuing expansion in used and pre-owned.
For Sonic, the EchoPark unit generates negative EBITDA, and the Carvana headlines are not friendly to those companies pushing used car online retail. Pressure on used industry leader CarMax and its strategy is not supportive of Sonic in picking the best positioned dealers to stay the course. CarMax is well established in the space and is massive in scale. Away from the valuation debate in any given quarter, one school of thought is that there are better positioned names in franchised dealers to play this sector and stronger more established operators in used vehicles.
EchoPark has dialed back its goals as used car supplies were tight and as the dynamics of new vs. used has been shifting quickly into 2023. The expectation of more volatility and headwinds that will preclude the originally planned growth trajectory is something the equity markets are wrestling with at this point as rates rise, inventories stay lean, and used cars seek an equilibrium level vs. new.
Capital Goods
Agricultural equipment stays solid with strong numbers from Deere…
We have been keeping an eye on the major cap goods companies during earnings season for signs of cyclical guidance. Companies such as CAT and DE are bellwethers in any market. They are also major OEM factors downstream just given their scale and how CAT and Deere serve as a buyer from a wide range of suppliers. The tonnage significance of the cap goods sector for freight and logistics providers is a major driver of revenue for many related services subsectors. Similarly, Deere’s financial services operations provide critical credit services that run deep into the farm community and beyond just the equipment sold by Deere.
We had earlier reviewed CAT, CNHI, and CMI in our weeklies over the prior two weeks. The guidance on balance has been steady with more business segments offering outlooks for growth than contraction. The capex planning and adjustments to order books in key end market (notably in construction and mining) come at a lag, and there are more than a few signs that demand will remain strong.
The most common top-down variables cited included oil and gas investment, the expectation of solid metals markets on China recovery, the energy transition capex programs tied to climate initiatives, the infrastructure bill, and the IRA for clean energy investment incentives. The ag sector has its own distinct set of cyclical dynamics, and DE just reaffirmed those are looking good.
Revenue growth, margin improvement and favorable guidance from DE…
Deere posted its fiscal year results at the end of October (10-30 for FY 2022) with favorable guidance. Now with F1Q23 results, DE has raised earnings guidance for FY 2023. DE saw margins expansion in its main segments in F1Q23 on a combination of favorable volume and price variances. For segment 2023 guidance, the color provided was strong with the largest segment (Production and Precision Ag) calling for +20% in revenue and material operating margin expansion from just under 20% to a range of 23.5% to 24.5%. The two smaller segments are also looking at better numbers for 2023. Construction and Forestry is looking at +10% to +15% higher sales and wider margins from 16% to 17%-18%. Small Ag and Turf is looking at flat to up 5% with minor moves in margins in a 14.5% to 15.5% range provided.
We break out the fine details to clarify that Deere is one more major equipment maker voting against recession for its core business lines. Of the recent major cap goods companies that reported, Deere has more in common with CNHI than CAT, but Cummins serves the highly volatile US Class 8 markets and medium duty commercial vehicle markets. For its part, PACCAR (considered the leader in the premium heavy duty truck market) reported record revenue and earnings in late January. PCAR posted a favorable forecast for US Class 8 markets, which is a common indicator of cyclical trends. PCAR indicated Class 8 volumes will be up modestly in low single digit % to a midpoint of 290K units from the 2022 actual of 283.5K. PCAR also cited a capex and R&D program that nears $1 bn on the high end of the range.

The above chart updates equity returns in the peer group, and Deere’s F1Q23 earnings report and guidance put it right back in the game with bullish numbers and guidance after DE lagged YTD. The +7.5% bounce in its stock Friday pulled DE back into positive territory with the other bellwethers.
PACCAR is the performance leader with its strong position in commercial vehicles and Class 8 trucks specifically. Freight and logistics had gained a lot more focus this past cycle than it usually would get, and truck markets are a big part of that story. The investment by all players to keep pace with the propulsion revolution (for PCAR, EV and AV investment) is a self-fulfilling prophecy in economic activity and planning.
The commodity end markets broadly have kept investors focused on what investments will need to be made in Machinery and Equipment for energy, agriculture, and mining. There are also investments to be made around clean energy and climate initiatives that are supposed to mitigate recession risks on the equipment line of GDP. For DE, it is more narrowly about the ag sector as the key driver since they are the unequivocal global leader.
Business Development Companies
BDCs just keep on growing and reflect the broader private credit secular trend…
The BDC market has been a growing area of focus for more investors in both debt and equity markets, and the earnings trends and dividend actions have not disappointed. Whether it is the secular rise of private credit, or pension and personal accounts looking for cash income as well as yield, the BDCs are seeing expansion initiatives from most of the top dogs in credit AUM. The longstanding leading legacy players in the space (the Golub Brothers et al) have been joined by a slew of private equity brand names (e.g. Carlyle, Ares, KKR, Apollo) and HY and loan players (e.g. Oaktree, Barings, BlackRock, GSAM) among others. As a reminder, BDCs have been around for quite a while (1980 legislation gave them a big lift). The current market offers a multiplier effect growth opportunity.
Many BDCs have been active in the unsecured bond markets and preferred stock markets as well as issuing new common equity as part of their growth plans. We will be looking at various single names in more detail in future commentaries. These names have a lot going on across the peer group with respect to industry and portfolio mix “flavor” and in terms of how they have configured their balance sheets. There have been more than a few roll-ups of smaller players into bigger players.
I already disclosed that I have been a buyer and occasional seller (for some long term holds and income generators) in late 2021 and earlier 2022 as I rebalanced a retirement portfolio. I prefer to hold the BDCs longer term with so many double-digit dividend yields, but sometimes when you want to build cash on market uncertainty, you let go of some good positions.
The names in the chart below average around 10% dividend yields that are possible from their loan holdings income. The interest margins generate income flows that are still strong even when compared to a materially repriced HY market and loan fund alternatives. The assets are risky by definition, but the value proposition of secured and structurally senior loans still get us back to the same old relative value debate on loans, the credit cycles, and fixed vs. floating relative risk and value.
As an investment, BDCs and their equities are part of legally distinctive structures supported by US legislation back in 1980. The structure is one of those “pass through” vehicles that sends income and gains through to the shareholder (thus the high dividend yields). There is no shortage of primers on the subject floating around the web.

The above cross-section of names highlights the income generating attractions of BDCs during a period of protracted ZIRP and low absolute all-in yields for fixed income. The range on the dividend yields above run from a high 6% handle on Main Street (one of the rare monthly pay major BDCs) to 13% handles on FS KKR. The history of special dividends is one aspect of these investments that cater to those who want income but also are comfortable with leveraged loans and buyout related credit exposure.
These are high risk assets, but so are equities with no earnings and no free cash flow. Income is a prime component of total returns, so it makes for a complex set of variables. Our view on the BDC equities is that we see many correlate highly with the stock market on the price side (some less so) given the buyer profile, but the earnings and income trends behave as one might expect in a market with rising floating rates in a resilient (or soft landing) economic backdrop. The asset generates higher income on the floating rate assets. In a market where the Fed is fighting inflation (but not going to the Volcker Doomsday Device), the coupon is biased to the upside in 2023. The run rate in earnings is tied to asset growth, net interest margins, and prudent management and reserving of loss exposure for the loan book.
The trick for owning such stocks or their unsecured bonds or preferred stock is fine-tuning the monitoring process by watching the numbers and having some faith (trust but verify, etc.) in the managers. Those managers are in the high end (in some cases the highest) of their trade and they have a vested interest in performing well via fees. They also need to watch the expectations of a lot more asset gathering across their families of funds from the retail (stock buyers of their BDCs) to the institutional level (committed AUM to loan investing outside the BDCs). In some cases, it is easier to have them on your side than blowing up IG holdings with leverage LBO deals. To be clear, many BDCs include some equity and equity linked holdings that feed the special dividend flows.
Low dividend yields in equity markets also made this sector a hot one for the wealth management crowd and self-directed investors. The natural evolution of the balance sheet of the BDC was for more layers (unsecured bonds and preferred stock), and that is just what unfolded. For those BDCs that could get their story told to the rating agencies and win some BBB tier ratings (from enough of the NRSOs to generate demand from IG bond investors), BDCs such as ARCC had been able to layer in unsecured bonds at interest costs you will not see again any time soon after the dramatic UST yield curve shifts of 2022. As an example of a nice capital structure carry, Ares has a range of 2%, 3% and 4% handle unsecured bonds in their capital structure at low BBB tier ratings. That is corporate term debt stacking up to an average below short term UST.
We will be looking in more detail at the individual names in future commentaries.