Existing Home Sales: Still in Freefall
Existing home sales continue on a deep dive YoY but unit inventory posts an uptick sequentially.
Realtors gather for planning meeting.
The same themes are still in the January 2023 existing home sales numbers despite a small sequential uptick in total inventory units.
Buyers and sellers are still in a stunned state of mind as inventories stay low and the barriers to affordability still drive many to the sidelines.
The major swoon YoY is par for the course, but the median price still showed a YoY uptick after 12 straight months of declines and 7 months of declining, single-digit price increases down to 1.3% in Jan 2023.
The beat continues for bad YoY comps in all aspects of housing even as the markets take a forward-looking approach to framing where this might all stabilize for builders. The latest Existing Homes Sales headline from NAR shows the 12th straight month of YoY declines in existing home sales but also brings yet another YoY increase in the median sales price at $359K (+1.3%).
That median sales price marks the seventh month of lower single digit price increases after the initial drop from the last double digit increase in June 2022 at +12.8%. Next month could finally start to post negative price variances if more home sellers decide to capitulate on the trend line for prices. Those price medians always come with the asterisk of mix and region.
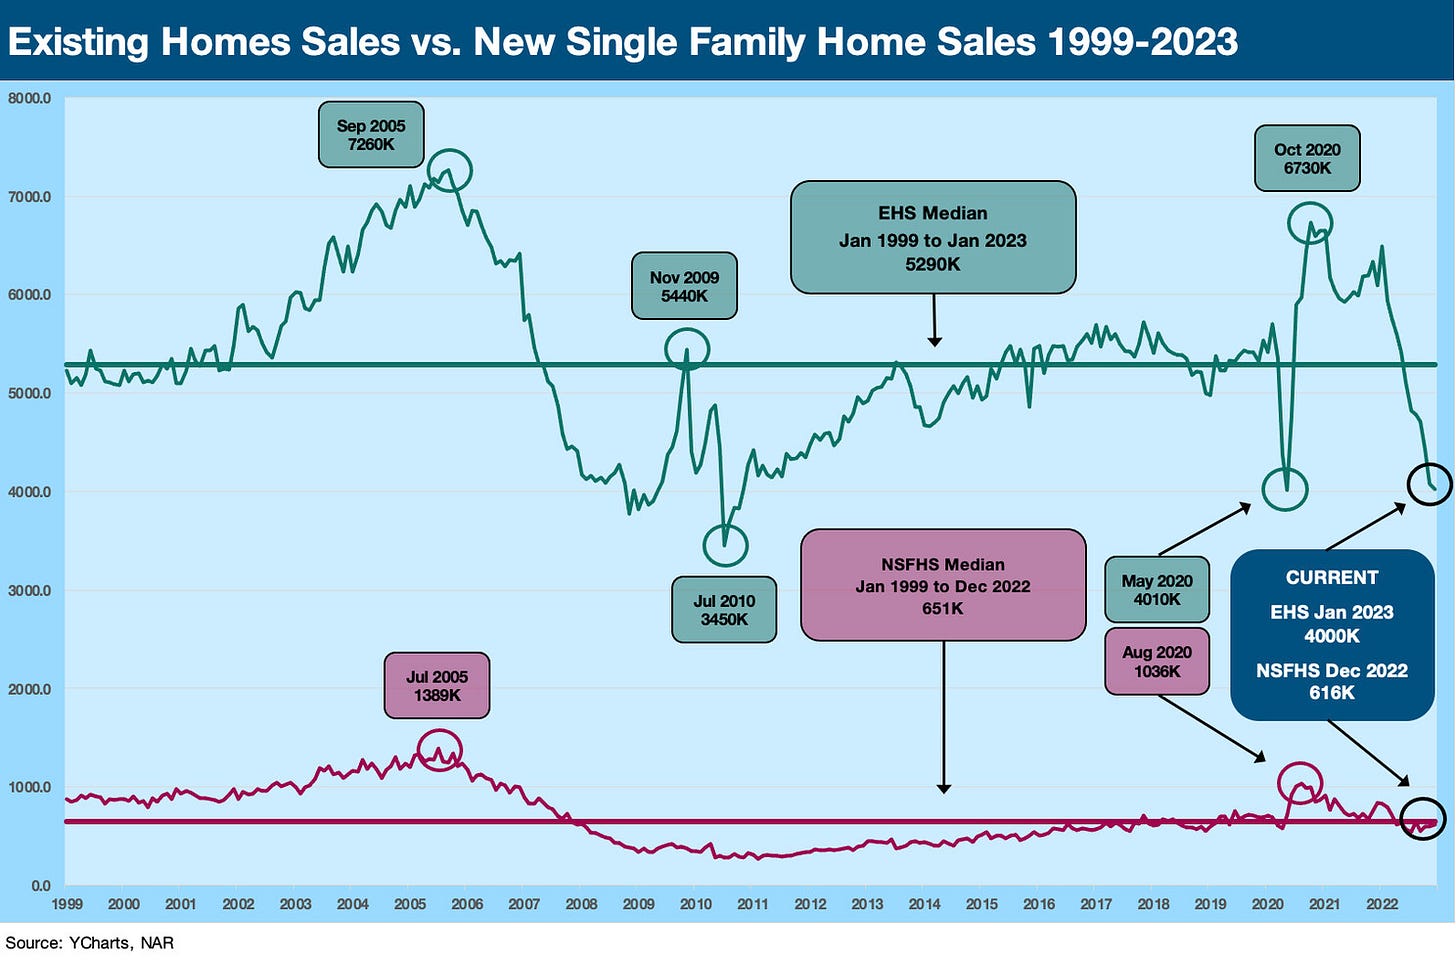
We update the above existing home sales vs. new home sales time series more for perspective on the relative scale of “existing vs. new.” The new sales release lags the EHS number. We detail the highs and lows and the medians since 1999. We prefer the two-sided chart and scales in the next chart so we can see the moves in new home sales better, but the above makes a point for housing sales and what existing home sales can mean to the services chain and retailers when an existing home gets sold.
Existing home sales adds up to a lot of houses that bring a wide range of related industries into play from finance and furnishings to movers, etc. The high volume dictates the earnings of more than a few brokers and public companies (Anywhere, Compass, RE/MAX, eXp, etc.) in addition to the mortgage lending business. The above trend is clearly doing some damage to some industries in that mix.
The above chart just tweaks the prior chart into a two-sided time series for better visual granularity on new home sales and the timing of lows and highs across two wild decades. The sequential moves vs. the YoY declines refine the debating points somewhat, but there is no question that existing home sales are in the tank.
The $1 M+ bucket is down by -41% this past month while the price range ($250-$500) where the overall median resides is down by -31.4%. We don’t see many new themes in the numbers this month. Sustained declines in existing home sales offer some more hope to builders in their planning. The question is where to build and in what product and price segment. The earnings season detailed many are still building on spec and notably in starter homes and the first time segment.
Interestingly, homebuilder equities have done well and beaten the overall market after the early 2022 pounding (see Housing Starts: Pressure On But Holding Together 2-16-22). The first wave of major builder earnings (Footnotes and Flashbacks: Week Ending Feb 3, 2023) helped give some ground level clarity on how the builders are reacting to the next stage of community planning. The slow and steady building process and liquidation of inventory on completions is a cash flow generator, but the game plan of the builders is still unclear in many cases around controlled lots and the next stage of starts. They have detailed a lot of flexibility given the increased use of options this cycle and the experience with incentives (including mortgage buydowns).
The 30% handle declines seen in each of the past 3 months (see Existing Home Sales: Inventory Radar or Sonar? 1-21-23) make a clear statement on the affordability challenge tied to mortgage rates. It is hard to see much relief there near term with the curve edging higher into the high 6% handle range again on 30Y mortgages the past week. The inventory wildcard and mortgage rates still rule the near term trends in prices. There is a lot of positive home equity in the market that gives sellers room to maneuver on price. That decision comes down to need and greed, two factors that are not always on the same page.
The economic activity in housing for now is more about homes under construction running at very high levels in historical context (see Housing Starts: Pressure On But Holding Together 2-16-22). That means the peak spring and summer seasons will be about running down inventory and gauging how to plan the next stage of community projects. The supply-demand imbalances and general housing shortage are not new topics in our commentaries on housing, and the latest existing home sales data stays in line with the theme of many buyers and sellers on the sidelines.
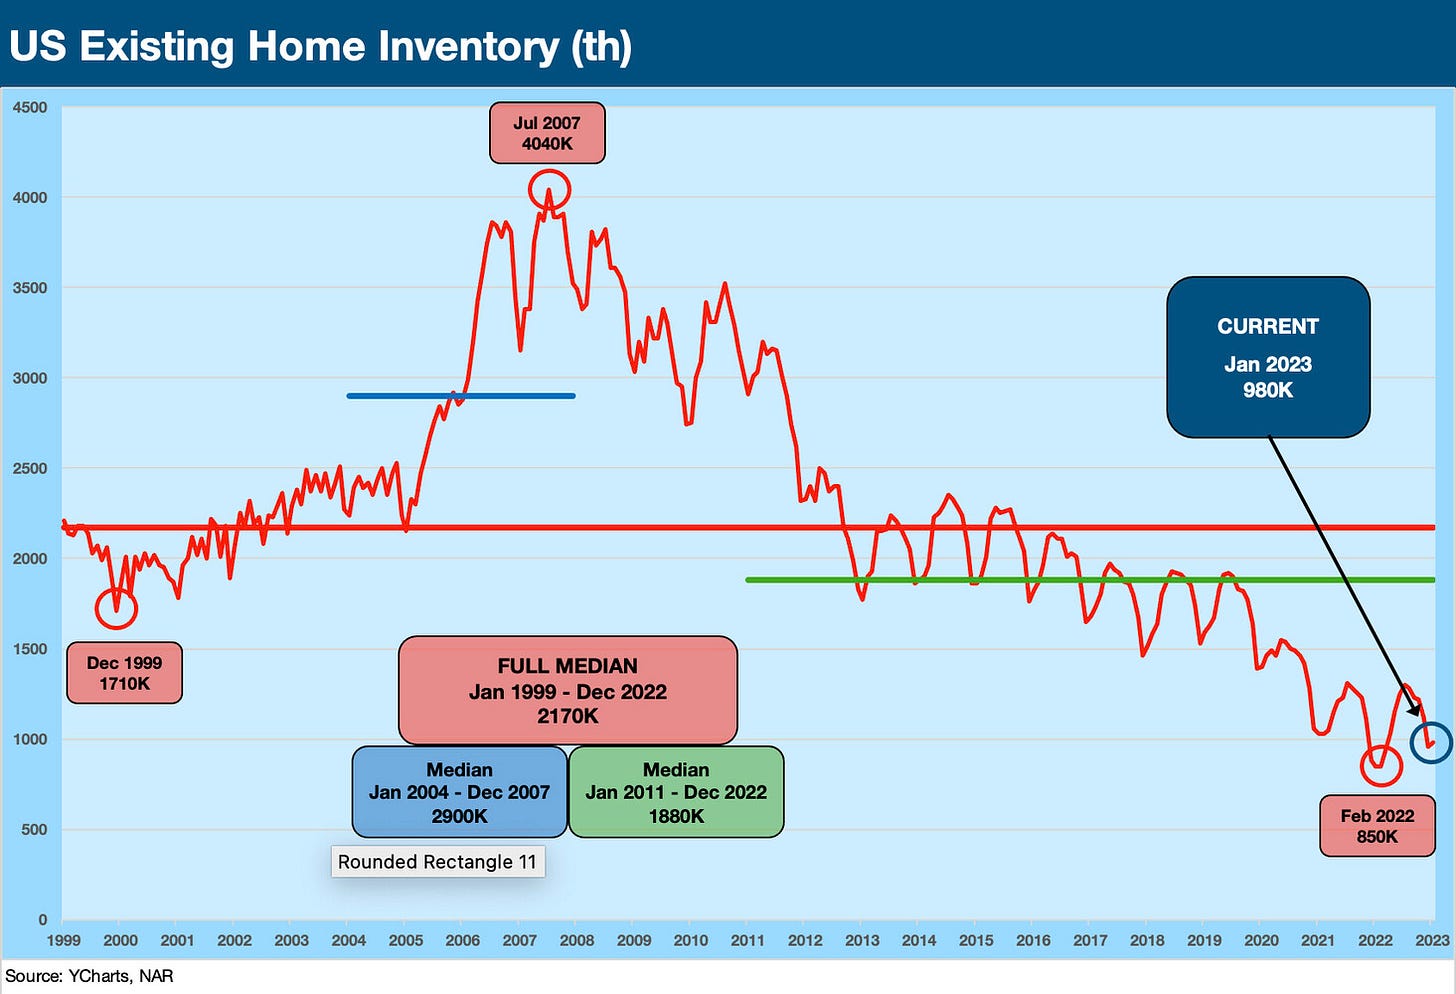
The inventory for existing home sales is detailed above, and it actually ticked up sequentially from 970K in Dec 2022 to 980K in Jan 2023. The inventory calculus is tricky since there are the trends in existing home sales on the market now, those decision makers that might be in the discovery or in the internal debate process, the new homes expected to be completed or that are in the stages of development, the condo/coop mix, and the rentals and multifamily units in process. Then there is the not-so-small matter or “where” and “at what price” or “the cost to rent.” Record payroll counts in the jobs market, the ever-expanding base of boomer retirees (or not retiring and working longer), and the question around existing homes that are ripe for scrappage all factor into the supply-demand handicapping for later 2023.
There is a market clearing price for a home in any given regional or metro market and for a reason. The potential home seller and buyers have likely been feeling the “deer in the headlights” effects given how quickly the home buying market has been shocked since 2021. From minimal inventory at high demand and record prices in the summer of 2021 and less than 2 months of supply of single family homes to start 2022, the inflation and Fed fallout on affordability has been intense. The current 3.4 months of single family (from 1.9 months on Jan 2022) and strained affordability is understandably causing a stall among decision makers on both sides of the transaction.
The seller has the added stress in many cases of a low mortgage rate that will get dramatically repriced on the other side of his home sale if he is looking to trade up. High levels of home equity will ease the pain, so the decision comes down to what is on the other side of the transaction for the seller. Being employed with a high home equity cushion is not a bad state of affairs for many households. It is not illogical to just wait for mortgage rates to come down for both the buyer and seller.


