Footnotes and Flashbacks: Week Ending March 26, 2023
Another week of bank turmoil while the Fed split the difference on rates and Powell and Yellen juggled very sensitive, subjective topics.
“Run, run, run, but you sure can’t hide…” - Depositors’ Theme Song
This Week’s Macro: Banks impact on the yield curve still drive the top-down action; 3M to 5Y new peak inversion; Asset class and ETF sector returns.
This Weeks’s Micro: Another week of banks since those are driving the securities pricing of most industries of late; Regional banks still waffling despite reassurance; SVB and the loan carry question; A “CSFB morning after” AT1 panic.
MACRO
Industry and company headlines occur with great frequency, but the type of yield curve action we have seen takes a lot of fear and a lot of moving parts to hit the yield curve segments in the manner seen over the past two weeks. The gathering risks go beyond some bad industry headlines and are now flowing into low confidence in banks and the regulators grasp on the issues. Then there is the “politicization of everything” that colored initial reactions to the epicenter of the panic. A bank starting with the words “Silicon Valley” did not help, but the geographic reach of the regional bank pressures is not as easily dismissed now.
The curves don’t lie…
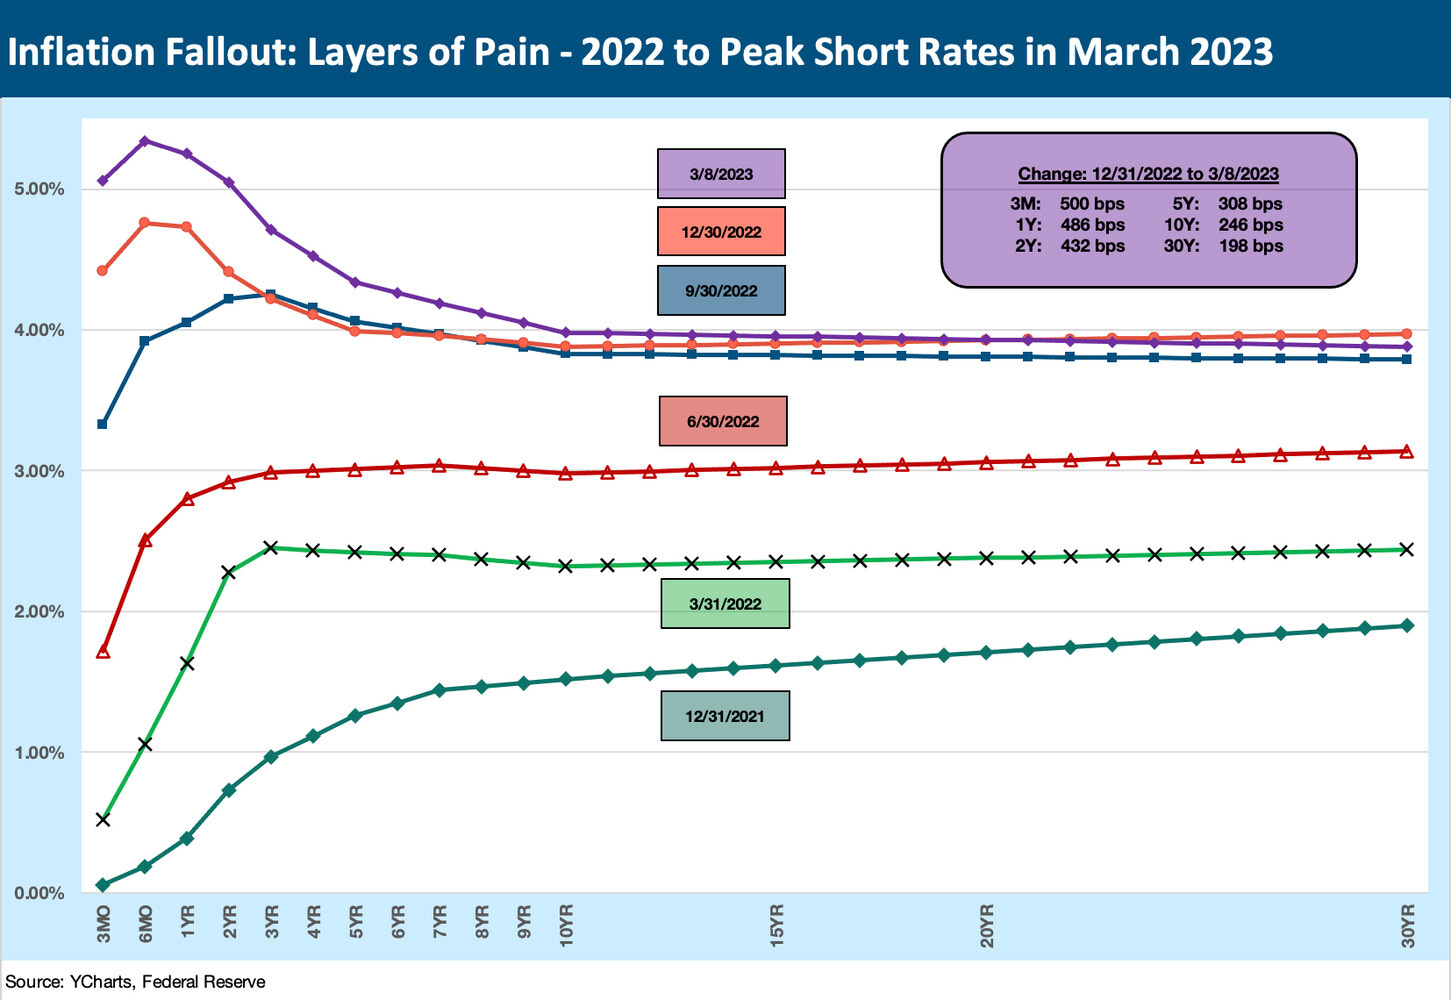
The chart below revisits the duration pain seen with the shifts across 2022. The upward migration of the UST curve eventually saw a short end peak around March 8, 2023, on the way into the SVB meltdown and ensuing bank tailspin.
In one chart, we post each quarter of 2022 on the way to the March 8, 2023 3M UST highs. The story of that chart is how duration pain was the dominant theme and one that contributed heavily to the SVB blowup given how it managed its securities portfolio risk factor and the unrealized losses (i.e., negligent and incompetent).
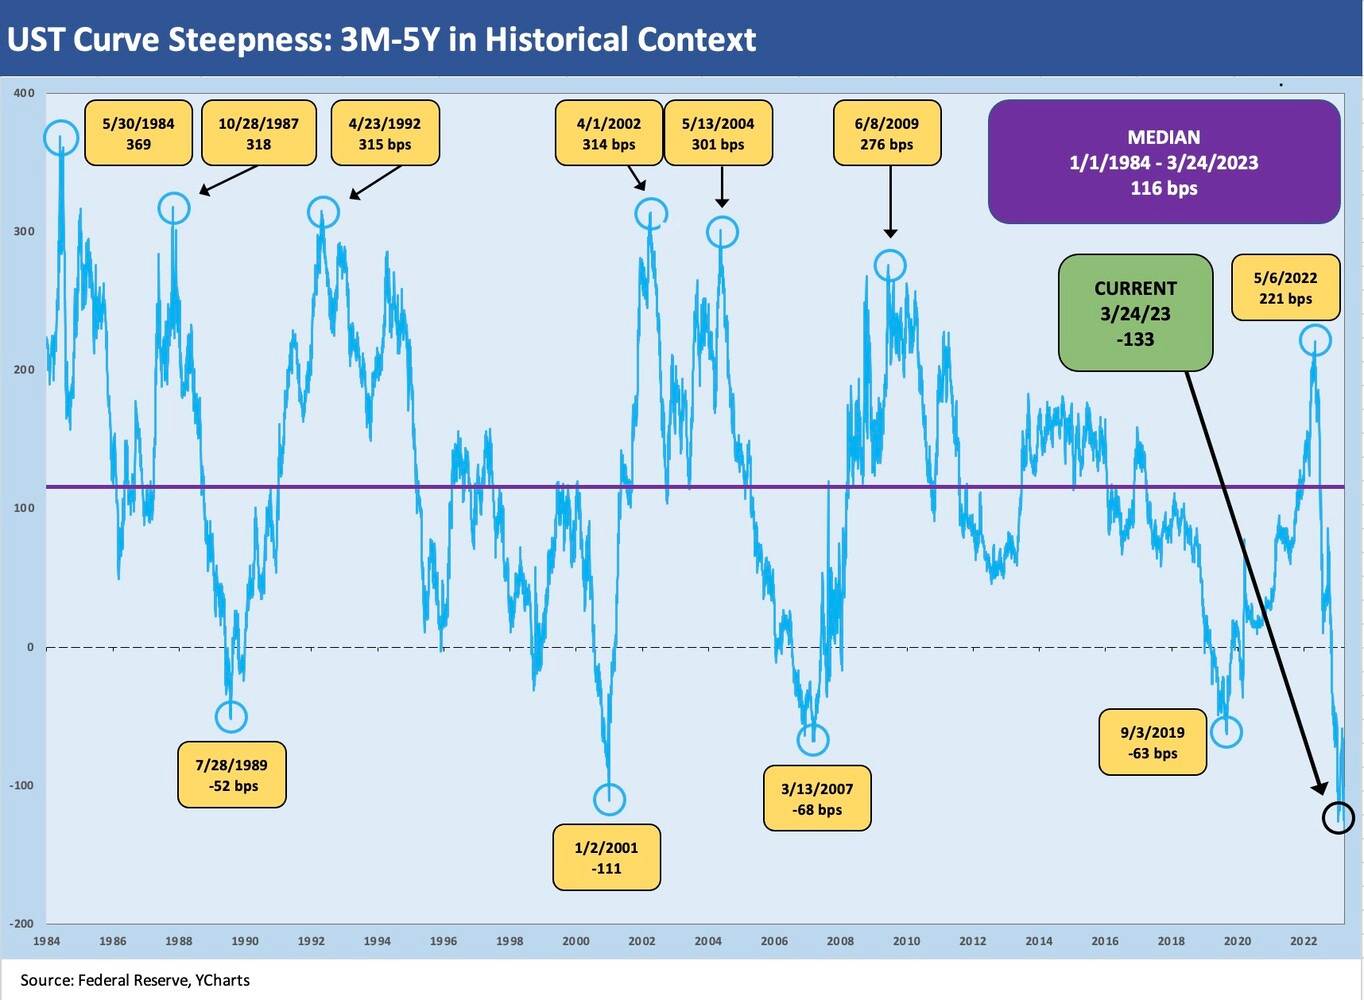
Another chart details the migration since the month that saw the end of ZIRP. A third chart shows the new all-time high on the 3M to 5Y inversion. Away from the constant reminder of inversions and recessions, that is a bad signal for NII and profitability and a reminder of the UST and Money Market Fund alternatives for depositors.
We use March 8 as a key date since SVB stock started tanking badly the next day, depositors were fleeing on a dramatic scale, the stock stopped trading, and the bank was closed by Friday (see Silicon Valley Bank: How did the UST Curve React? 3-11-23, Footnotes and Flashbacks: Week Ending March 19, 2023).
The chart above shows the upward migration of the UST curve across the quarters from the end of 2021 to March 8. The next chart shows the move from March 8 down to the March 24 close. That period cuts across the SVB and CSFB headliners and all the deposit flight and the Fed/UST support actions/comments between those dates. The shocking moves in the UST curve have been covered in a lot of details by everyone (“X standard deviations” and “most since…” headlines, etc.) as interest rates kept sliding and did so even against a backdrop of inflation.
The chart above also shows the upward shift since March 1, 2022 or since the month that ZIRP ended. With the Fed raising fed funds by 25 bps to an upper target of 5.0%, the Fed’s dot plot was a mixed bag for confidence. The midpoint dot plot has only 1 of 18 dots below 5.0% by the end of 2023 (note: one FOMC participant did not submit a forecast). The median projection for Dec 2023 is 5.1% and 4.3% for 2024. We see a big spread in the 2024 dots from 3% handles to 5% handles. We see 10 dots in the 4% handle range, 4 dots with 5% handles, and 4 dots with 3% handles. That tells a story by itself.
The transmission mechanism of fed funds out the yield curve is still more tied to the expected fundamentals with the market controlling the longer end. The markets turned more bearish and rewarded duration.
For the near term, the market panic seen around banks and deposit flight risk arguably leaves the market controlling the front end of the UST curve beyond fed funds. The deposit flows are being tracked and commented on in a way that we would not have expected with constructive capital stories and decent asset quality indicators.
As detailed below, we even hit a new peak in the inversion for 3M to 5Y UST last week as the UST has been rallying and the front end still cannot get too far away from fed funds.
Vicious cycle: deposits flee, risk appetites go defensive, loan quality erodes…
The upward pressure on the curve in the rearview mirror is not the main event now, but those unrealized losses are what lit the fuse at SVB and set off waves of depositor outflows. That outflow pattern has picked up speed and now sets the table for recession. That risk element drives the threat of credit contraction that in turn sets off the vicious cycle that could infect loan portfolios by undermining fundamentals. For SVB narrowly, the market fallout slows (or kills) some IPO opportunities that loan quality was tied to. Tech equities have rallied somewhat with lower rates, so the window is not closed. That will still be a problem for many.
One way for regional banks to protect portfolio quality is to get defensive. That means financial conditions get tighter. Lenders are less flexible on setbacks. That defines credit contraction. Then the focus turns to that dynamic and depositor worries pick up again as the liability side (depositors) of the balance sheet starts worrying about bank earnings and asset quality.
While asset quality then gets questioned, banks will need to compete for depositors against UST and Money Market Funds. Then Net Interest Margins get squeezed even as loans see credit loss reserves boosted. The “only” bad news from there then is asset quality and earnings will be under pressure for the regionals and small banks. They may be fine in terms of capital, but the cause-and-effect sequencing does not inspire confidence. This is what potential bidders on SVB loan assets could be working through as a thought process.
Comparative Asset Returns
Asset class struggle cuts across debt and equity, flight to quality …
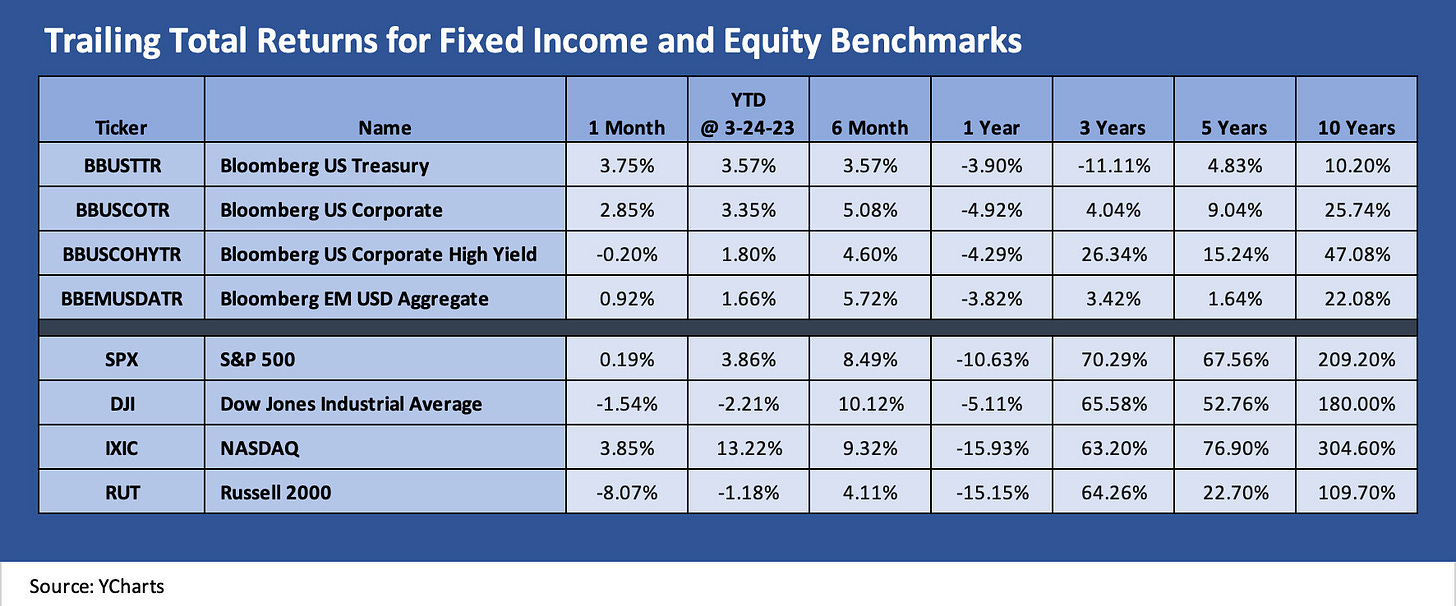
The above chart frames the lead bellwether benchmark asset classes for UST, corporate bonds and HY, and the broad equity benchmarks. For all the scary headlines around banks and depositor trauma, we see 3 of 4 debt categories still in positive range for the trailing 1-month period despite the material credit spread widening of the bank turmoil (see IG Corporate Spreads: Tough Pathway, A Few Doors Ahead 3-19-23, US HY Spread Histories: Weird Science, New Parts 3-19-23, Spreads Across Tiers: Decompression + Volatility 3-18-23). The past week saw small widening in HY and slight tightening in IG credit (Per ICE).
The equity side is part logical and part illogical. The logical part is the sharp sell-off in small caps since the bank worries will have a direct impact on those borrowers. The greater risk of a more broad-based, multiregional recession is also now on the table if banks (regional, small, and community) do in fact pull back. So the reactive (but understandable) shift in sentiment is more tied to those small cap and mid cap segments in credit.
A negative view on small and midcap borrowers (HY, BDCs) is very much in evidence. For US HY, the credit spreads are still below levels seen in Sept/early Oct 2022 and July 2022. July 2022 saw ICE HY OAS just under +600 bps (vs. current 520 bps area). So even with the widening, HY OAS does not reflects today’s bucket of risk factors.
The other side of the equity equation is more illogical where we see tech-centric benchmarks rallying on lower interest rates. The always troubling term of “long duration equities” has taken on the life of bond math (low rates, higher price) when the growth expectations are filled with questions around revenue and earnings targets and the relative risk of achieving them soon enough. IT budgets are also in part secular and in part cyclical, and sorting out those factors is no easy exercise for tech followers. There are a lot of consumer spending questions and corporate budget challenges in the services side of tech. Those are topics for other days.
The longer tail of equities feeling the pain of contraction risks…
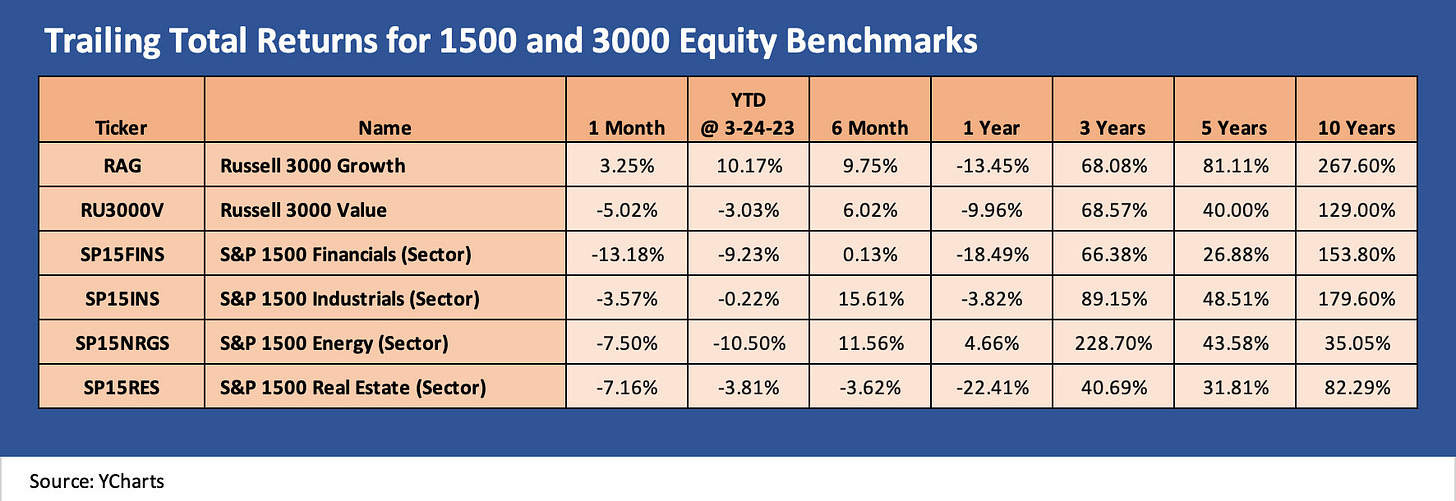
The above chart includes the “1500 and 3000” equity benchmarks that cut across a broader swath of equities including small and midcap banks. This is where the Financial index is really showing some pain with less ugly (but still unsightly) performances by Energy and Real Estate this past month. We would add that a lot of regional banks have very high real estate exposure and in some banks very high energy exposure. As noted earlier in the large cap benchmarks, the Growth category has posted up decent rallies and materially outperformed Value in this more cyclically bearish market.
ETF returns as industry and asset class proxies…
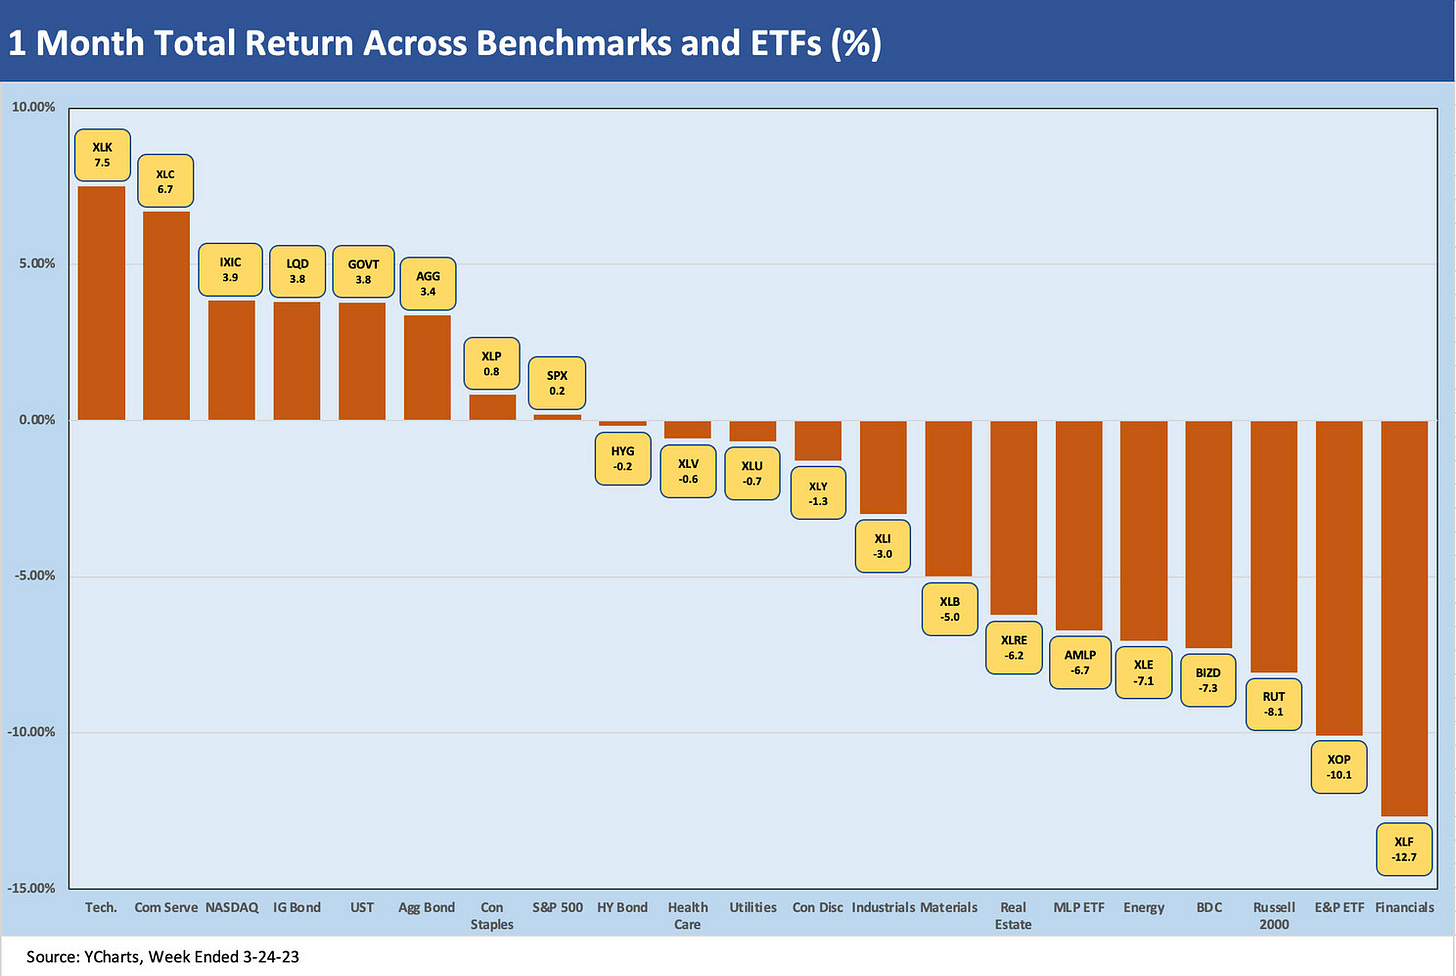
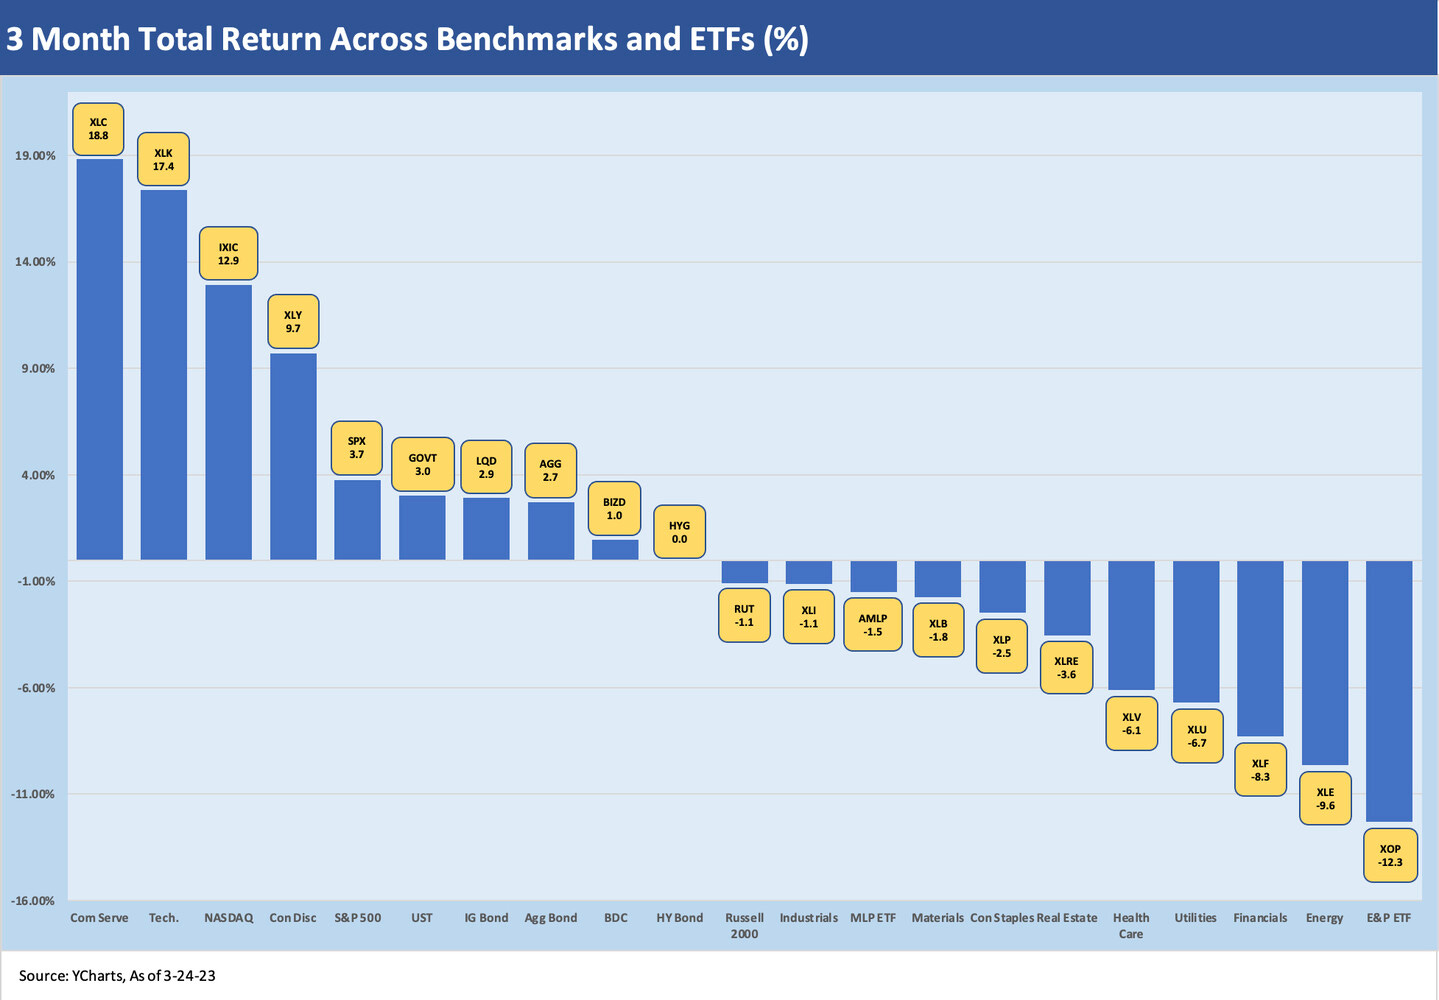
In the next section, we look at a broad mix of industry ETFs, some asset class proxies, and broad equity benchmarks. We look at 1-month and 3-month time horizons through Friday’s close. Of the 21 equity benchmarks and ETFs we look at, we see a little better scoresheet this week than last. The trailing 1-month shows 8 positive returns and 13 in the negative zone. The 3-month shows 9 in positive range, 1 at zero, and 11 negative.
It seems like a long time since the Jan 2023 bull run when we saw 18 positive and 3 negative through Feb 3, 2023 for each of the 1-month and 3-month. For the Jan 27, 2023 weekly, the score showed only one negative over 3 months, and that one was the E&P ETF (XOP). The scoresheet can change quickly during periods of cyclical transition and monetary policy uncertainty.
The saying “the Fed will hike until something breaks” has been making the rounds. A lot of things broke even with real fed funds in the negative zone across those periods. In SVB’s case, risk management did not break. It was abandoned. The bank problem strangely started with the low risk assets with long duration and not the loan books (yet). That is a strange sequence.
1-month ETF and Benchmark Returns
The 1-month returns show a lot of pain in Financials (XLF) over on the right at -12.7% with E&P (XOP) also down by double-digits. Small caps (Russell 2000) is the third line item off the bottom with BDCs (BIZD) just ahead of small caps and then Diversified Energy (XLE) next up the list of those with negative total returns. AMLP rounds out the swings in Energy with Midstream also feeling the sell-off in Energy despite high yields and intrinsically lower volatility tied to commodity prices vs. the names in XOP and XLE.
The positive return categories show a combination of tech and growth with high quality fixed income and duration-heavy assets on the winning side. Tech, Communications Services, and the NASDAQ (IXIC) hold down the Top 3 slots followed by IG bonds (LQD), GOVT, and AGG. We see Consumer Staples (XLP) and the S&P 500 closing out the smaller list of positive returns. HYG is just across the line in the negative zone before we transition into a mix of defensive and cyclicals in what are loosely bracketed in the “third quartile”.
Real estate is going to be one to watch with a lot of negative noise painting a category (Real Estate) with a broad brush even though that category is extraordinarily diverse now. Office Buildings are on the least wanted list right now, but there are a lot more categories and functional roles in the real estate asset mix.
3-month ETF and Benchmark Returns
The 3-month tally shows fixed income and credit more resilient with duration winning and supporting GOVT, LQD, and AGG. Interestingly, the Tech, TMT-heavy names and NASDAQ are back in the lead after their sharp sell-offs as interest rate relief was a key driver and some sell-offs were seen as overdone. Cyclicals have been rallying through Jan and Feb but have stumbled with the bank problems shifting the needle on recession risk more into the red zone again. Consumer Discretionary, Industrials, and Materials faded in recent weeks on that now-reinforced cyclical bearishness.
BIZD hung in on the positive side but has been coming under pressure since the bank chaos as that borrower group is very much about small and microcap sized companies with some midcaps in the mix also. The floating rate feature of the BDC asset mix also lost some allure with rates being perceived as at a peak and recession threats looming that could undermine asset quality.
In the interests of disclosure, I have positions in BDCs, and I was somewhat active in managing positions across 2021 and 2022. On an individual basis, no single name was material and were all less than 2% of my retirement portfolio. The high cash yields had been a source of support for total returns in 2022 and into 2023 with a notable divergence across good and bad performers on price.
The solid head start for US HY (HYG) in Jan 2023 kept HY on the zero-return dividing line. The HYG issuer mix tends to have a higher mix of larger, more liquid and higher quality names as reflected in dividend yields materially lower than the quoted HY index yields. For example, the US HY index has an 8.9% YTW as of Friday (ICE BofA index), but the HYG dividend yield was quoted at 5.6%.
MICRO
The bank sector brings another week of crazy and anxious…
The bank turmoil started the week with a new crisis as holder of AT1 bonds were bailed in and zeroed out by the Swiss regulators. Meanwhile Deutsche Bank was drawing the next round of headlines but for nothing specific other than it is a major European bank that had some similar bouts of volatility during times when CSFB was feeling the same heat (notably early 2016). German leaders and Deutsche Bank made a good enough defense. The French were also talking up their banking system health.
The bank chaos leads into a more straightforward path to credit risk repricing ahead in 2023. The mental gymnastics exercise of debating what “kind of landing” was ahead for the US economy was still a real battle before SVB. That was why 50 bps was suddenly on the table (but was gone after SVB). As we said back on 3-15-23 after the regional pain was rolling in: “The fundamentals left the soft-landing crowd with a solid hand, but bank system stress is usually the time to go from “hold ‘em to fold ’em” on balanced cyclical thoughts and expect repricing of credit risk over the coming months” see (Risk Appetites Get Bloodied 3-15-23).
Whether it was 1989-1990 or 2007-2008, when the banks/brokers face funding pressure, bad things happen. The 1989-1990 years have been discussed in other commentaries (see Greenspan’s First Cyclical Ride: 1987-1992 10-24-22). That does not mean we see this as 2007-2008 at all (see Greenspan’s Last Hurrah: His Wild Finish Before the Crisis 10-30-22, Wild Transition Year: The Chaos of 2007 11-1-22) and we would argue it is not in the same hemisphere let alone the same zip code given the behavior of the banks and brokers at the time. 1989 has more than its share of parallels now that depositors have been spooked and the inflation and rate backdrop is clearly a headwind.
The regional bank problem is stubborn….
Below we update the same mix of regional banks we looked at in the last weekly (see Footnotes and Flashbacks: Week Ending March 19, 2023). We add a trailing week time horizon to the mix. As noted in the earlier commentary, we selected a cross section of banks based on a few different metrics, and the mix was weighted toward banks in single digit billion market caps. We line up the bank equities in reverse order of performance in a “worst first” list for the 3-17/3-24 period.
The period since March 9-10 when SVB took over the screens has been a wild one given that the mass deposit outflow was sparked by one very unusual bank. That systemic anxiety by depositors probably was not on most short lists (or long lists) for a risk-off trigger to start the year. Geopolitics, inflation, energy, asset quality, fear of recession and other scenarios were there for debating, but a push-button run on regionals was not in any discussion I read or heard.
The one-week price action was mixed, but at least we see some of the regionals were able to post a positive week. First Republic was in a class by itself at -46% with a very distant second place for Comerica at #2. The trailing 1-month pain still tells the bulk of the story. We include the Russell 2000 in the mix, and that small cap benchmark was slightly positive on the week but a high single digit negative for the trailing month.
In trying to frame how successfully the week went after regulator jawboning and implementation of the liquidity backstops, we still see market commentators continuing to try to “isolate the virus” of SVB and highlight its distinctive features. We would say the results were still overwhelmed by the deposit fear and the wave of alternative facility use by the banks and a mixed review for Powell/Yellen jawboning. In addition, the 25 bps hike in fed funds gave some more excuses to consider using T-Bills as a cash substitute for uninsured deposits or even Money Markets (despite bank exposure in some of those funds).
Those trying to stake out the position that SVB was uniquely bad in many ways did not help as much as more evidence of government support. The SVB yardsticks on securities exposure and unrealized losses vs. capital were defensible differentiators. The growing base of evidence that the regulators had warned them (and Blackrock had offered their services before the blowup) added to the pile of evidence of negligence and incompetence at SVB. The fear is still pervasive given how many bank equities have been pummeled. CSFB certainly did not help as regulatory seizure was played out in brutal fashion on the AT1s.
The macro checklist of worries from the regionals…
As soon as SVB collapsed and was soon followed by Signature with First Republic starting to hit the skids, the extrapolation of negative scenarios began in logical fashion. SVB was followed immediately by the UST move we detailed last week (see Silicon Valley Bank: How did the UST Curve React? 3-11-23) and that rolled into this past week as the Fed tightened by 25 bps. Tightening and fighting inflation is the top priority for the Fed but now it has a financial stabilization juggling act to do. That could conflict with the QT side of the game plan at a time when banks need to shed some assets such as MBS at SVB.
As investors started to list the ingredients, the checklist of worry kicked in as follows:
Fear of credit contraction by lenders: If banks have worries about depositor nerves and outright depositor flight, the banks certainly cannot afford to get too aggressive in the loan book whether in loans or in unfunded commitments. That means credit contraction, tighter terms, and a need to potentially build liquidity. That hits the corporate sector (services and manufacturing), household balance sheet flexibility, and targets consumers and small businesses alike.
Lower demand for credit: Real estate worries are already here in the commercial real estate sector, and that has been a major asset concentration for small and midcap banks as well as community banks. That could be more an asset quality problem than a loan demand problem, but other areas could see recession game plans revised by potential borrowers as well. If there is worry around recession, inventory management becomes a major priority. That means less economic activity, potentially shelved expansion plans, and perhaps the threat of less aggressive working capital, capex planning, and headcount appetites. Credit contraction is the Econ 101 path to recession.
Self-fulfilling prophecy on unfunded committed lines: Our favorite old expression of “balance sheets main, liquidity kills” fits in with “balance sheets don’t kill people, bankers do.” The stress on lending and liquidity for customers at SVB is still somewhat murky as was the strategic plan there (e.g., asset sales, merger, or liquidation, etc.). The plan remains unsettled. The carrying value of the SVB loan book at year end is more likely to get called into question in a transaction whether on pricing or quality or structure. The same could be true generally if the desire is to do a transaction with a tightening cycle underway, tighter financial conditions generally in the market, and higher odds in the bidding process around a recession.
Questioning carrying value of loans and reserve adequacy: The SVB situation has triggered more second-guessing on the loan book of almost $74 bn as banks and private credit players pour over the opportunities to grow their base of earnings assets in the SVB loan book. Doubts on the cycle might color the view of other regionals who might look to get defensive on balance sheet needs and grow their liquidity by shrinking the left side of their balance sheets while also reducing contingent demands on their balance sheet in the form of unfunded commitments. The risk to easing depositor and stockholder anxiety for the broad bank universe is that interest is low for the loans, and that could make confidence in quality of the asset coverage even lower.
Federal Reserve: 25 bps is not making life easier for deposits…
After all that pressure on deposits from the SVB scare and noise around uninsured deposits, another 25 bps on the short end could find its way back into the money market and T-Bill rates if the market anxiety eases up after driving a rapid front end rally in from the 5% area on short UST bills. 4.5-4.7% on short UST paper is down from close to 5%. In the context of higher yielding equities and many of the CD products out there, the bank-phobic have plenty of options.
For those in the truly panicky category, the inflows out of banks and into money market funds might still be tempered by the bank exposure in many money markets (prime funds). The MMFs tend to be UST-centric now, and that is just a matter of checking on the asset mix. A pure UST strategy is also a viable option. We also have seen the wave of products that are out there that disburse cash into the necessary number of funds that are at the FDIC $250K limit or less based on the entity. Whatever the game plan, there is room to realign deposit holdings near term. It will lead to a lot more action in deposits ahead if we see more seizure and bank volatility.
The European megabanks pile on with AT1 and counterparty anxiety…
The European bank madness of the past two weeks also did not help as investors are now going to start to question the value of AT1, potentially being sellers over time or just staying away from adding. That means more major banks in Europe will need to evaluate plans for the left side of the balance sheet if an important layer of the right side of the balance sheet goes on the “no fly” list for more institutional investors.
The theories will be bounced around and debated, but the middle market and small business lending in Europe is already getting some adverse headlines. Since many of the major European banks have substantial roles across the US credit markets (loans, securities, and derivatives) that also fits into the credit contraction theme somewhere. Just take a look at the signature pages on so many loan documents.
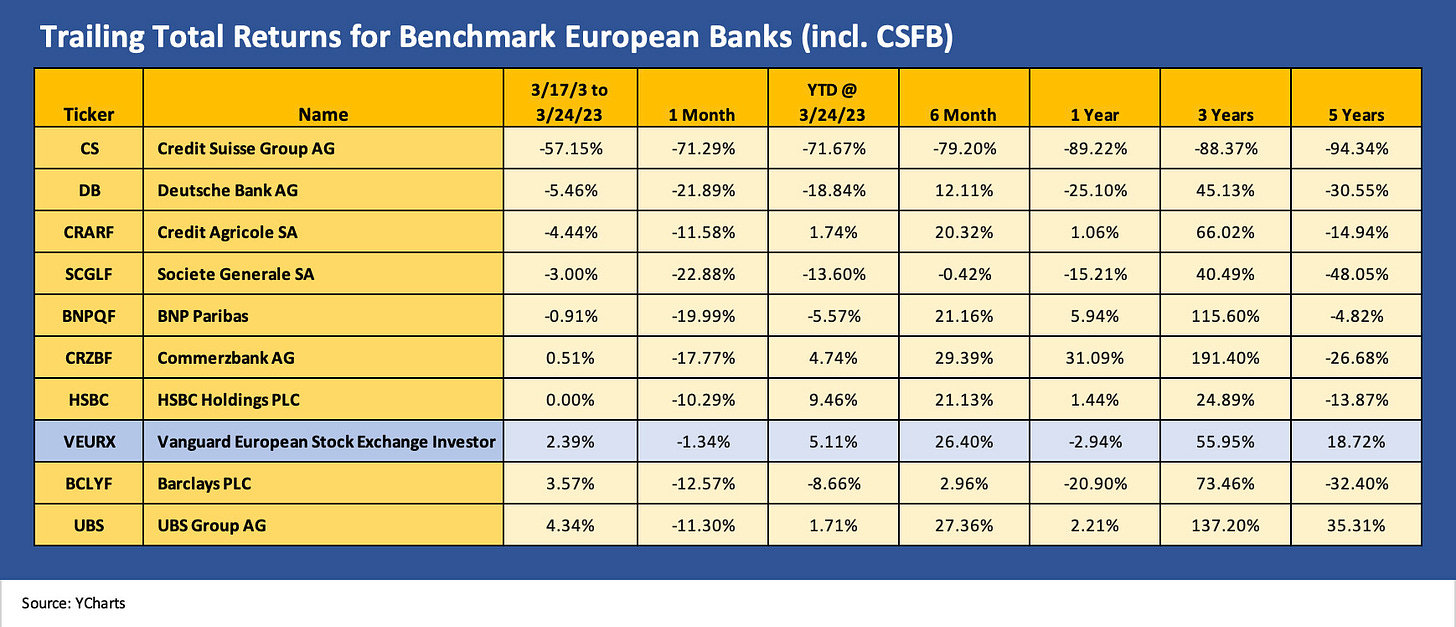
Below we add a trailing return chart for a major peer group of European banks. We stuck with the Germans, French, UK, and Swiss for the sampler (including Deutsche Bank, my employer in the late 1990s). Some of these banks have gone through extraordinary changes over the years and continued to revamp business mix priorities and strategic ambitions.
The shifting strategy was most notably the case with CSFB, but the overhaul got sucked into the undertow of some high profile setbacks. For European banks, here we are with a new headache in the form of an AT1 confidence crisis. CSFB and Deutsche have had their share of volatility down the capital structure with the AT1 turmoil also in the headlines back in early 2016. This one was not only more severe, it was in fact fatal for AT1 holders.
The CSFB implosion over last weekend and carnage in the AT1 sector roiled the credit markets. We would argue that CSFB was a much scarier potential outcome than SVB in that a bank with the business line exposure of a CSFB brings to mind the overriding risk of bank interconnectedness. This would feed the flashback domino fears that come with that counterparty profile. The Swiss made sure that such a contagion was headed off.
The good news as you peruse the stock returns above is that the stock market reaction was mild in the context of the CSFB and AT1 headlines and the attempts by bears to tag Deutsche as a “me too” CSFB. In very general terms, investors tend to have deep faith in the expectation of government intervention in Europe to provide support on the credit side regardless of their protestations that there will not be bailouts. This latest event made a clear distinction in the case of AT1s and used them as bail-in bonds for loss absorption securities as they were designed to be (in theory).
The controversy around preserving some equity value while zeroing out the AT1s has raged in the press all week and the threats of litigation we assume will be acted upon. From a macro standpoint, the effect of the CSFB implosion is to take a big slice of capital support out of the bank system not only in the reduction of credit risk from CSFB but also the retrenchment that will inevitably unfold in the AT1 market in the future. In the case of UBS+CSFB, the sum of 1+1 will not be 2. That again is credit contraction on a global scale.
The focus on keeping banks safe and inflation lower was also on display again the past two weeks in Europe with steady rate hikes continuing to run alongside reassurance by bank regulators and politicians. (We don’t believe the market will be overly convinced.) ECB President Christine Lagarde made clear the two parallel priorities last week of fighting inflation and being vigilant around the banks. There will not be an “either or” plan in the battle against inflation vs. supporting banks.
Generic counterparty fears and domino risks…
Another factor that gets little airtime but which has weighed on bank risk in past periods of extreme volatility is counterparty risk credit exposure. Those counterparty risks get heightened during periods of extreme volatility and especially by major leveraged bets on underlying markets or instruments that move against a trade in dramatic fashion.
CSFB itself had a major blowup with Archegos and Viacom stock on breakdowns in risk management on what was a plain vanilla transaction that had been extended to an “other worldly” scale in early 2021. Another management shakeup ensued. Hedge fund losses have also been on the screen of late around the bank stock pain and bond market volatility. We have a hard time believing we will not be seeing more headlines around hedge fund losses or parties falling down on counterparty exposure.


