Risk Appetites Get Bloodied
We look at the asset pricing and curve gyrations around the SVB and CSFB dramas.
“Et tu CSFB?!”
We regroup on how a range of assets have reacted to SVB, CSFB, and the ensuing yield curve reaction as the return numbers moved around for the fundamentally driven vs. the duration exposed.
The fear of credit contraction from small and midsized banks to regionals or even sources of private credit will heighten the sense of recession risk and that in turn hits cyclicals and energy.
Recession fears and market volatility means more defensive lending may be underway regardless of what the Fed does next week.
The fundamentals left the soft-landing crowd with a solid hand, but bank system stress is usually the time to go from “hold ‘em to fold ’em” on balanced cyclical thoughts and expect repricing of credit risk over the coming months.
The asset pain checklist…
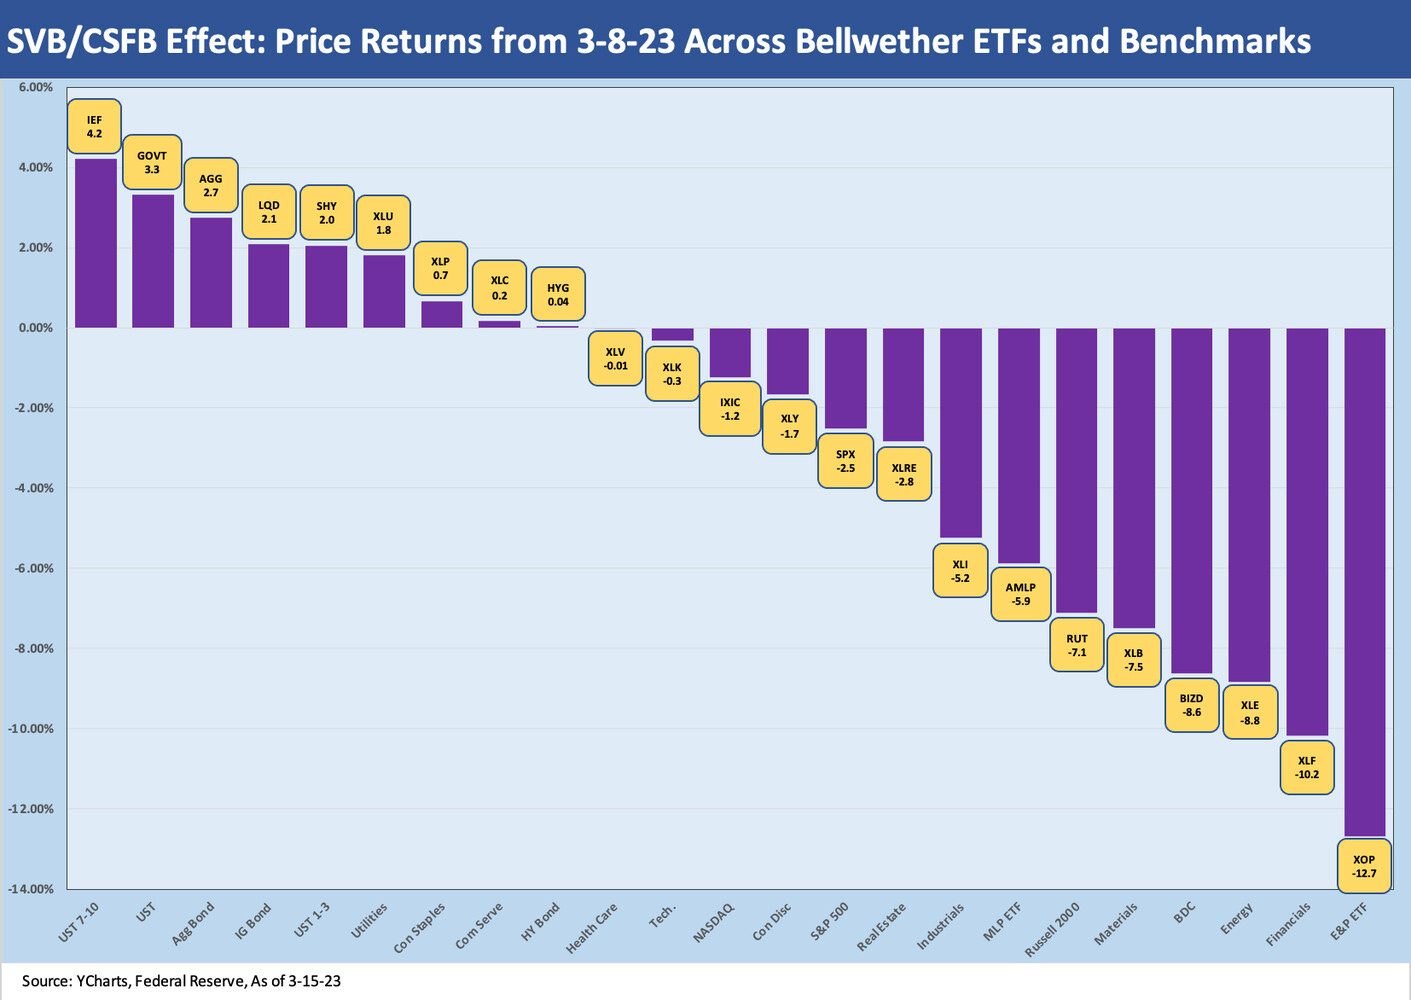
In the chart below, we post returns since the Wed March 8 close through Wednesday close (March 15. Yes, the Ides of March). Headwinds got much tougher as the SVB meltdown gave way another collapse (Signature Bank) over the weekend. The bank failures set off a mad scramble by the Fed, FDIC, and UST to offer liquidity support to assure depositors that they are protected and can get their money out. Then came CSFB. While the headlines of support came quickly there also, that will ease panic but make the question list longer and more worrisome.
The SVB parent has stayed busy as have the parties tied into the bank under the regulators. A range of potential buyers are looking for opportunities, but the new CEO (Tim Mayopoulos) was open ended on what the end game would be (recapitalization, sale, or liquidation) according to accounts of his client Zoom call. The main point is that the aftermath of a wild weekend is not total chaos relative to what might have transpired.
The rights and contractual requirements of the SVB borrowers remain murky at best based on what came out of a Zoom call. Apparently, his statement indicated the credit lines are in effect as he asked for more deposits to return. The accounts made clear he waived no rights around exclusivity for anyone yet. Most of us are working second hand on that area of the analysis. It is likely no decisions have been made until the scenarios are explored.
The above chart plots the return since March 8 for a range of ETFs and broader benchmarks. The winner was duration on the UST declines, and we see fixed income ETFs in the Top 5 spots with HY barely edging into the positive zone after ending March 14th on the negative side. As part of this update, we added two more ETFs to our usual list vs. what we do in our weekly (see Footnotes and Flashbacks: Week Ending March 12, 2023). As a reminder, IEF is the 7-10Y UST ETF and SHY is the 1-3Y UST ETF. Way over on the right side of the bar chart we see XOP on the bottom as oil plunged. Meanwhile, Financials were hammered by developments in the bank sector and most notably SVB and CSFB. The more diversified XLE was 3rd from the bottom. BDC saw the strain of recession fears, less upside from the floating rate feature, and concerns around small and microcap loan quality under the scenario of tighter credit and softer demand for a range of markets.
The Financials have plenty of reasons to sell off with fears around losses in securities portfolios and pressured interest margins ahead. In a plot twist, the UST curve rally would reduce the unrealized losses in high quality long duration fixed income holdings but then raise a lot of questions on loan asset quality and the direction of credit losses.
The SVB outcome helped ease the risk of a deposit panic spiral and immediately reversed much of the thinking on the UST curve. After the SVB drama, the market faced the return of CSFB back into its latest crisis stretch. The bank tried to defend its metrics but was facing the reality of a low trust factor in the markets for so many banks right now. The situation is always highly tenuous when confidence can drive counterparties to pull back credit lines (theoretical or otherwise in swaps). There are the usual concerns around prime brokerage retrenchment by clients that can hit liquidity. Most have seen this movie before.
Some news to end the day is the Swiss National Bank restated “that there are no indications of direct risk of contagion for Swiss Institutions due to the current turmoil in the US banking market.” The “due to…turmoil in the US…” was artful language (i.e., is contagion risk “due to” something else?). The SNB statement on market uncertainty also noted that “if necessary, the SNB will provide CSFB with liquidity.”
As the evening wore on, CSFB announced that the Swiss National Bank will be lending CSFB CHF 50 billion (over $US 53 billion) to “pre-emptively strengthen liquidity.” The scale of the loan underscores the turmoil and is as tangible as it gets in a financial market that is seeing a severe confidence problem.
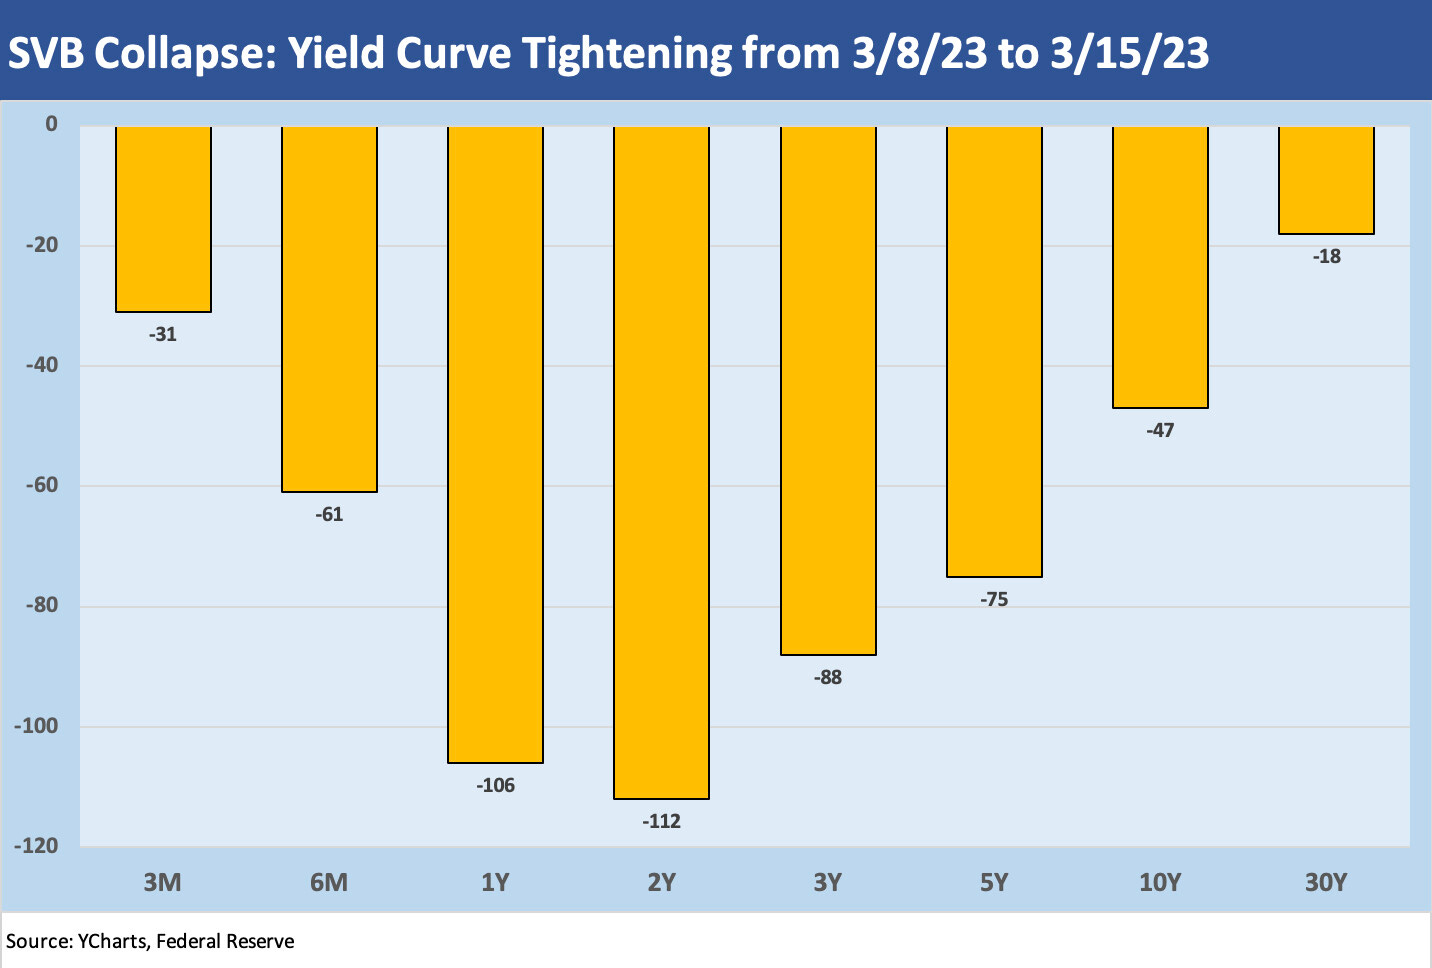
The above chart details the change in UST yields from 3M out to 30Y, and the story speaks for itself. The signals from 1Y to 2Y are telling you recession and trouble ahead as the year proceeds and credit contraction slowly flows into recession effects, deterring investment, and some reassessment of capex and hiring. Those signals imply the Fed will start to backpedal and weaker demand will also support inflation trends in theory. The easier YoY math in the inflation numbers will add something to inflation metrics relief as we get into mid-2023 when it gets compared to the worst stretch of 2022.
The front end and shape of the curve will do some morphing, but for now 3M and 6M might stall until the Fed offers some clarity after the 1Y and 2Y plunges. We are seeing a bull steepener (short rates declining faster than long rates) taking shape as 1-2Y plunged faster than the 5Y to 10Y. Calling the current UST move a steepener when the curve is still inverted is a bit of lingual murkiness around how to talk about “lower inversion.”
We had been constructive on the consumer to this point, and the fact of very low unemployment is still a mitigating factor on the hard landing chatter. In historical terms, interest rates are low in multi-cycle context, and some sectors will see some relief such as housing and homebuilders.
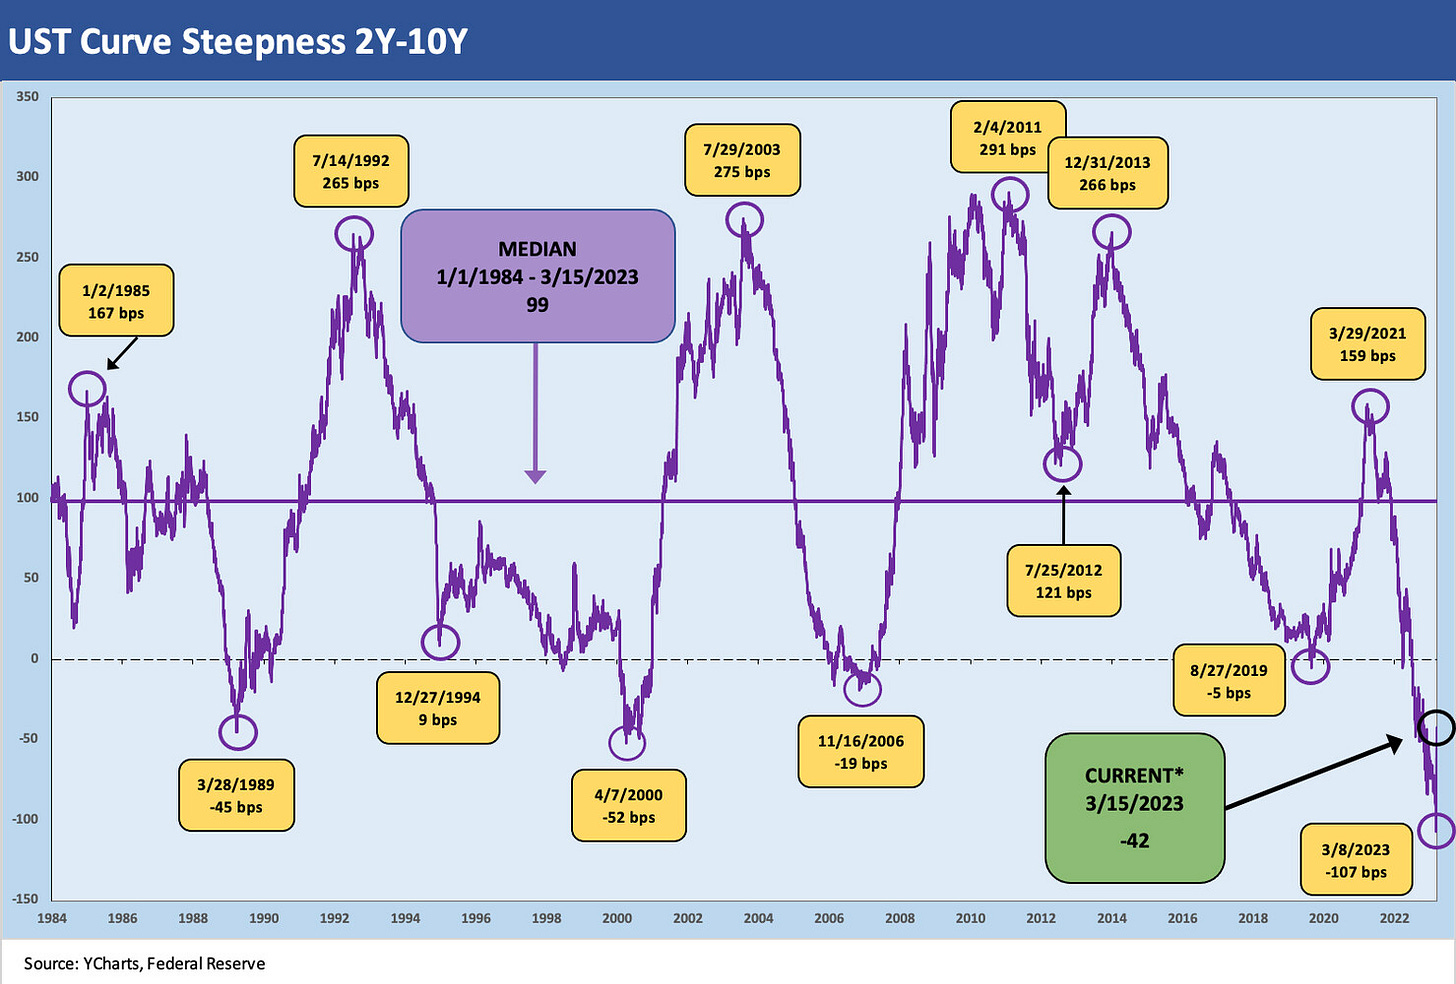
We update the 2Y-10Y slope, and we see how much the inversion has been reduced in a few trading days with the 2Y-10Y down to -42 bps from -107 on 3/8/23. The -42 is eerily close to the April 2000 -52 bps and the March 1989 level of -45 bps. The late spring of 1989 saw plenty of serious problems in the financial systems that brought a lot of regulatory seizures and credit contraction (see Greenspan’s First Cyclical Ride: 1987-1992 10-24-22 ). The spring of 2000 was already into the post-TMT default cycle and was only weeks after the NASDAQ peak. Then came the Fed’s hyper-easing across 2001 and the second leg of the credit cycle whipsaw in 2002 (see Greenspan’s Last Hurrah: His Wild Finish Before the Crisis 10-30-22).
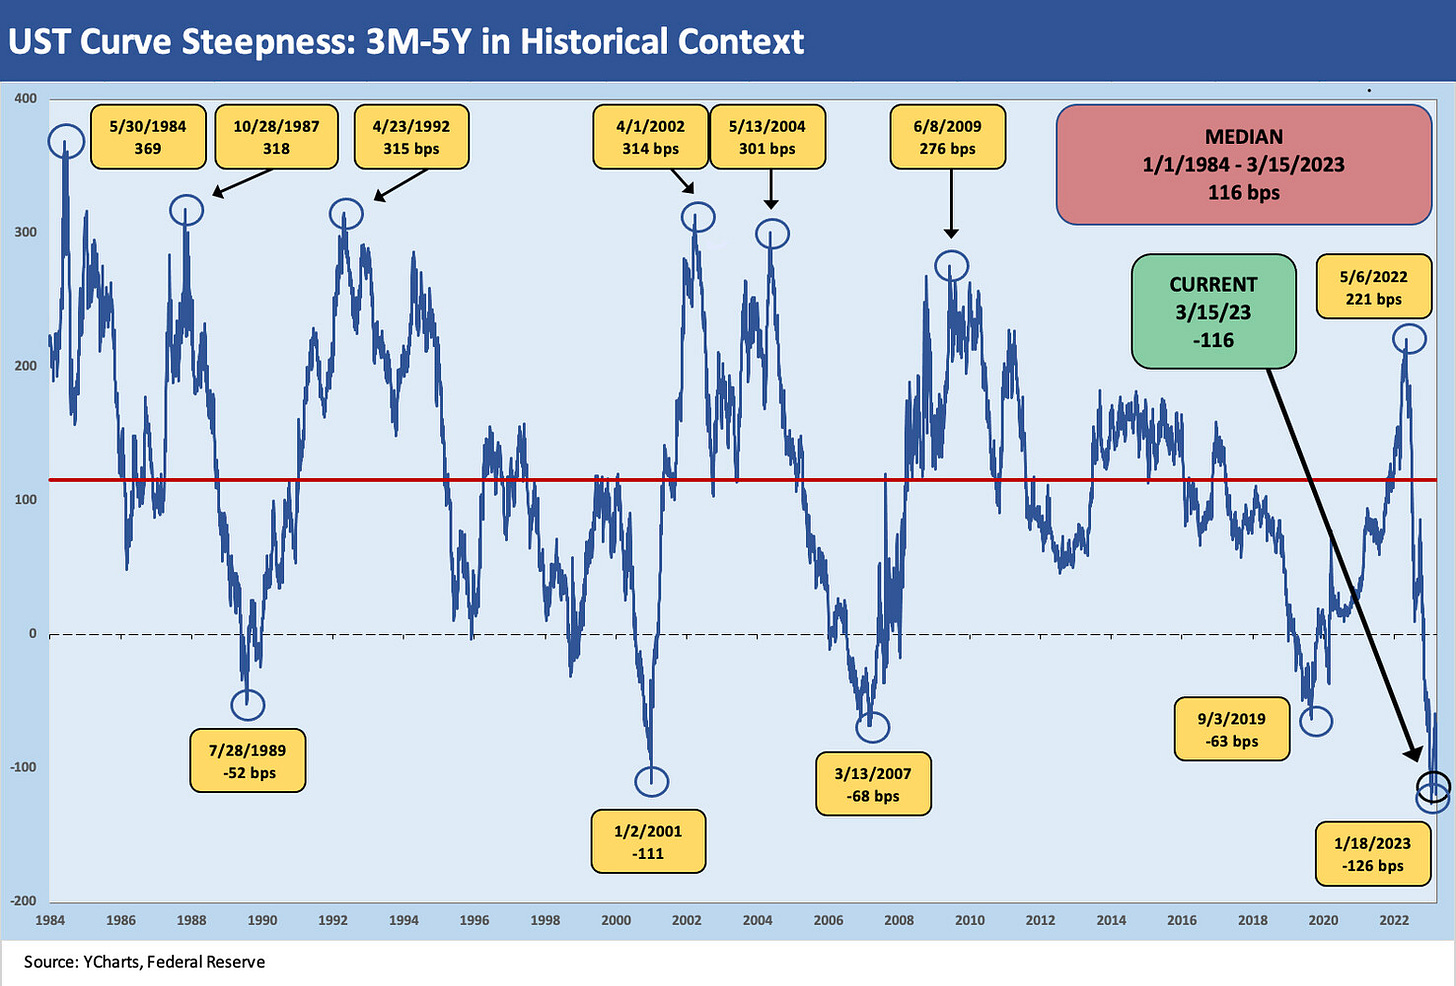
The 3M-5Y has not quite moved so much with the 3M UST more resilient and still somewhat wrapped around the Fed’s policy on the short end. The 5Y UST has moved quite a bit, however, as noted in the earlier bar chart, and the inversion is hanging around just below the sharpest inversion since the Volcker inflation fighting years (not shown here). The 3M to 5Y negative slope still trumps the Jan 2001 peak inversion of -111.


