
Dec 2023 Housing Starts: Slow 2023 but Speeding Up
The sequential and YoY pace is picking up, but the full tally for calendar 2023 was down -9% for housing starts (NSA) over 12 months.


The Dec total housing starts shows a decline sequentially by -4.3% but posted a solid +7.6% YoY with single family up +15.8% YoY and single family at -8.6% sequentially.
Single family housing starts for Dec were running strong YoY in the critical South region (+17.8%) and in the West (+48.2%) with the Midwest at +37.6% but the small Northeast market was down -46.8%.
Permits were up modestly YoY in total but very strong YoY in single family at +32.9% even as Multifamily permits were down sharply by -26.6%.
Multifamily starts are down in Dec 2023 by -9.5% YoY but 5+ unit completions are rolling in at +33.6% with a high rate of multifamily still under construction and supply coming on line slated to keep up a sustained increase in 2024.
The end of the calendar year weighed in with a not seasonally adjusted total 2023 starts number for the year of 1413.1K units or a -9.0% decline vs. 2022. For permits not seasonally adjusted, the 1469.8K for 2023 was down -11.7% vs. 2022.
Total homes under construction for Dec 2023 came in at 1679K SAAR vs. 1696K at the end of 2022. The builders are getting ready to ramp up their newly enlarged order book in 2024 after the weakness in orders in late 2022 rebounded as 2023 wore on.
Completions ended the year on a strong note at +13.2% SAAR to 1574K with single family at 1056K or +6.1%. Multifamily completions weighed in at +33.6% SAAR while “not seasonally adjusted” multifamily completions (5+ units) were up +22.1%. The builders have plenty to build into the new year.
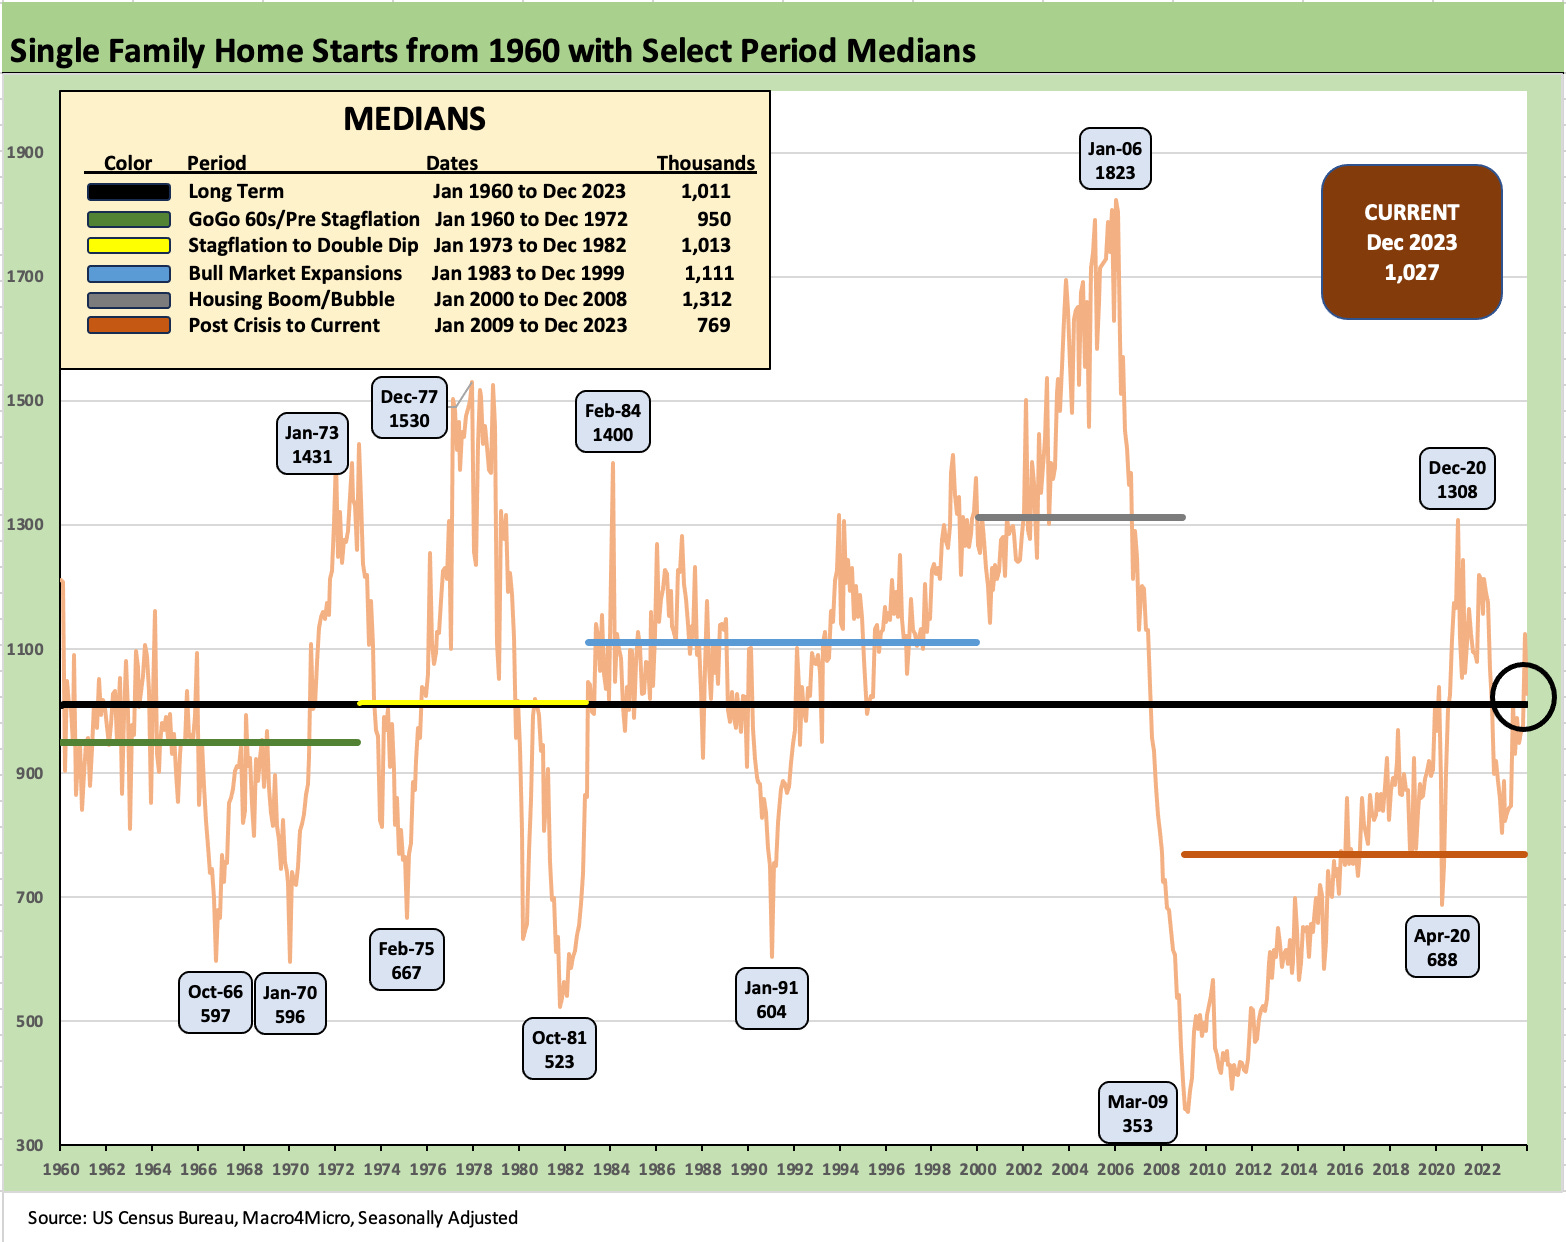
The above chart shows a good finish to 2023 for single family even if total starts are down sequentially. Last month was the first 4-digit month in 2023 for single family starts and December is now the second. Getting back above median was overdue and notably in the context of a very different demographic backdrop to end 2023 than the earlier cyclical peaks shown in the chart.
We break out a range of timeline medians in the box, and we are now running well ahead of the post-crisis median of 769k and close to what was seen in the bull market expansion medians of the 1980s/1990s. Demand outpaces supply, and these numbers could move much higher in order rates and backlogs with a friendlier mortgage rate environment.
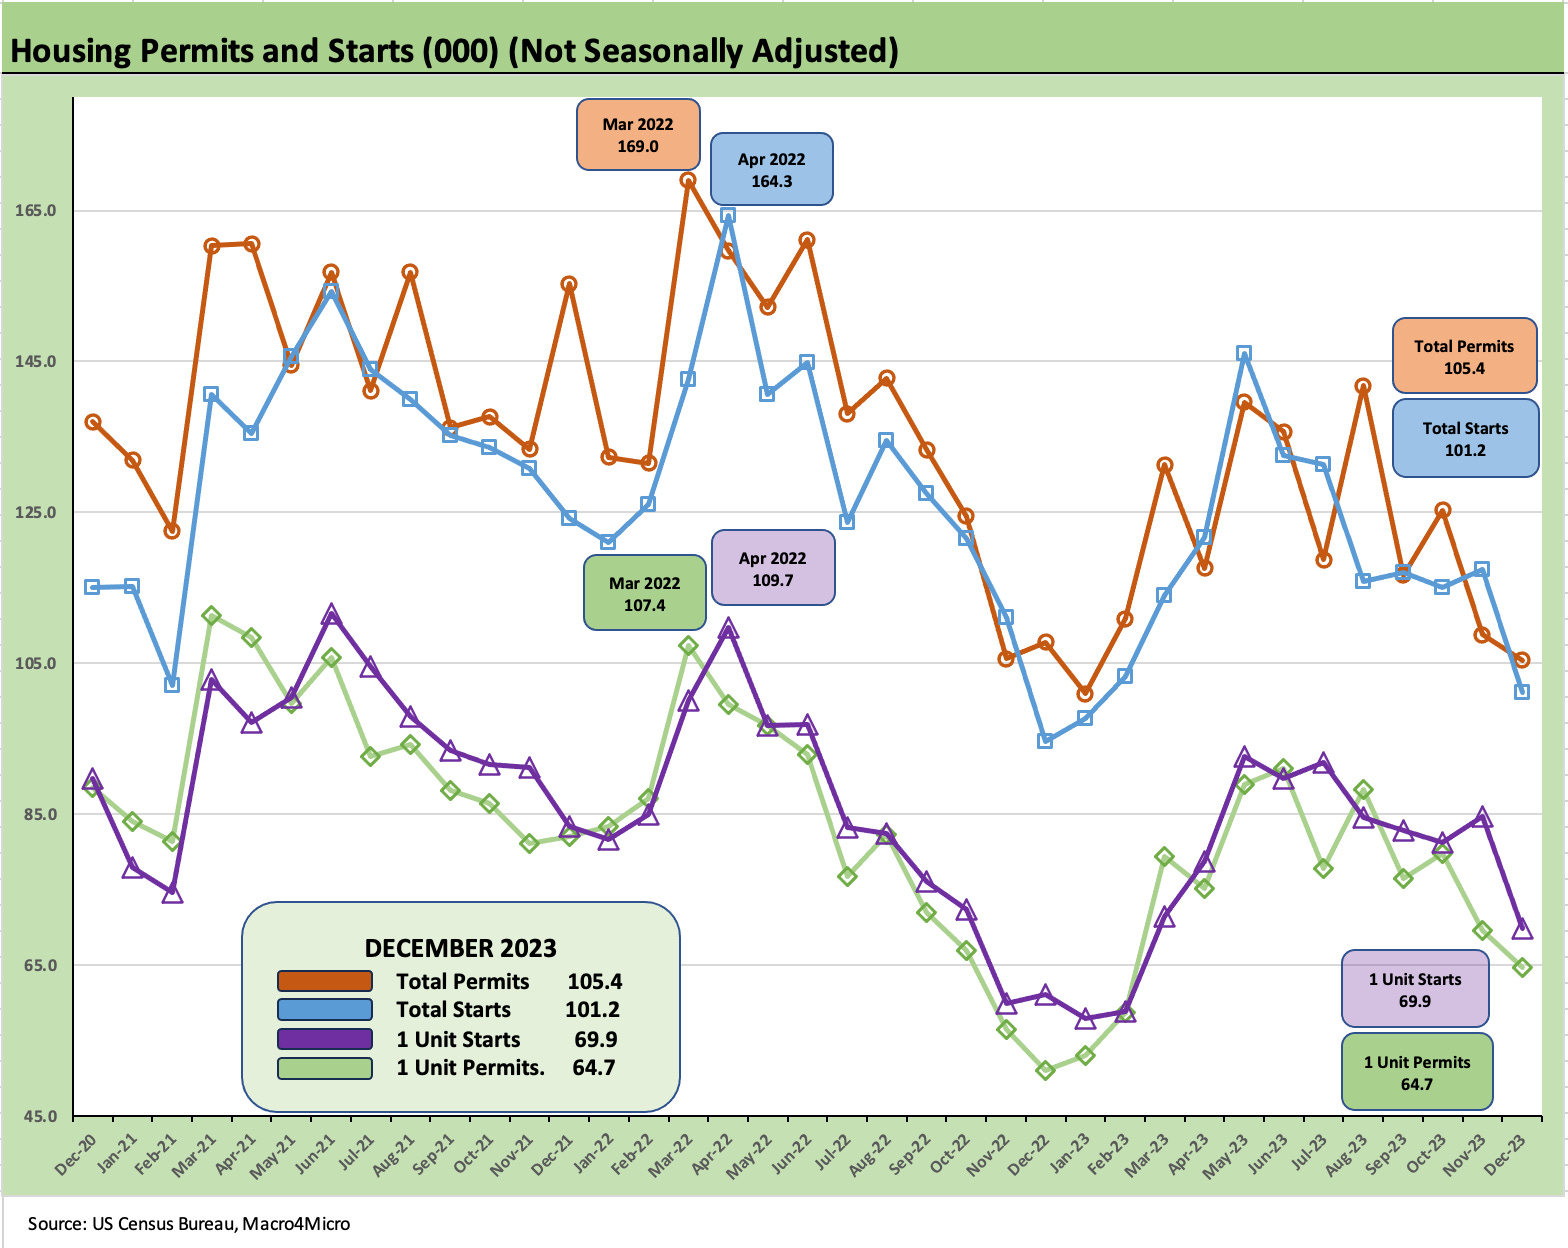
The above chart updates the permits and starts trends broken out in total and for single family on a not seasonally adjusted basis. We addressed the moves overall in the bullets and intro text above. The main pattern to see is that the builders have been very successful in managing their working capital and the pace of sales/deliveries and starts.
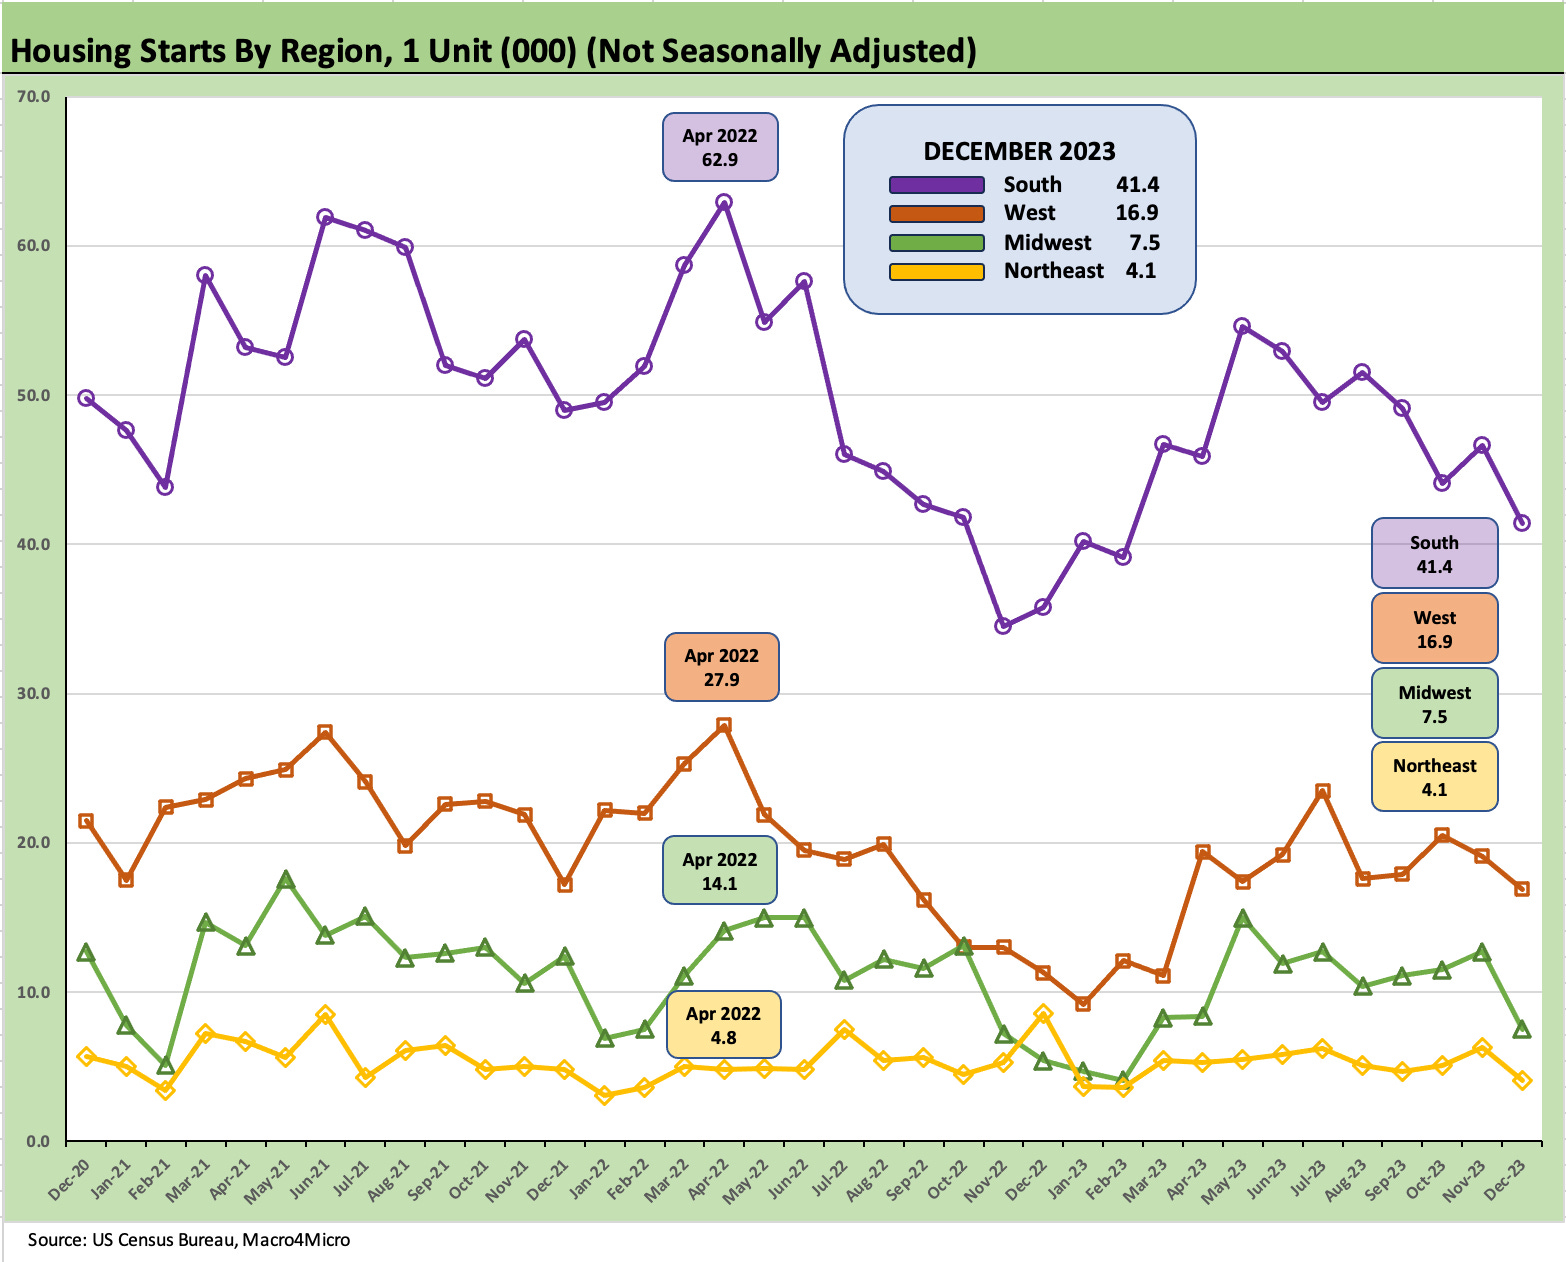
The above chart details the regional moves on a not seasonally adjusted basis. The South is by far the largest market since it includes Texas and Florida in the Census categories with the West next on the list. The upswing YoY for single family in the largest regions make the case on momentum moving into 2024.
We have covered the multifamily significance in past commentaries, and the focus on CPI and Shelter inflation has given multifamily a much more important role even away from the housing supply-demand issues.
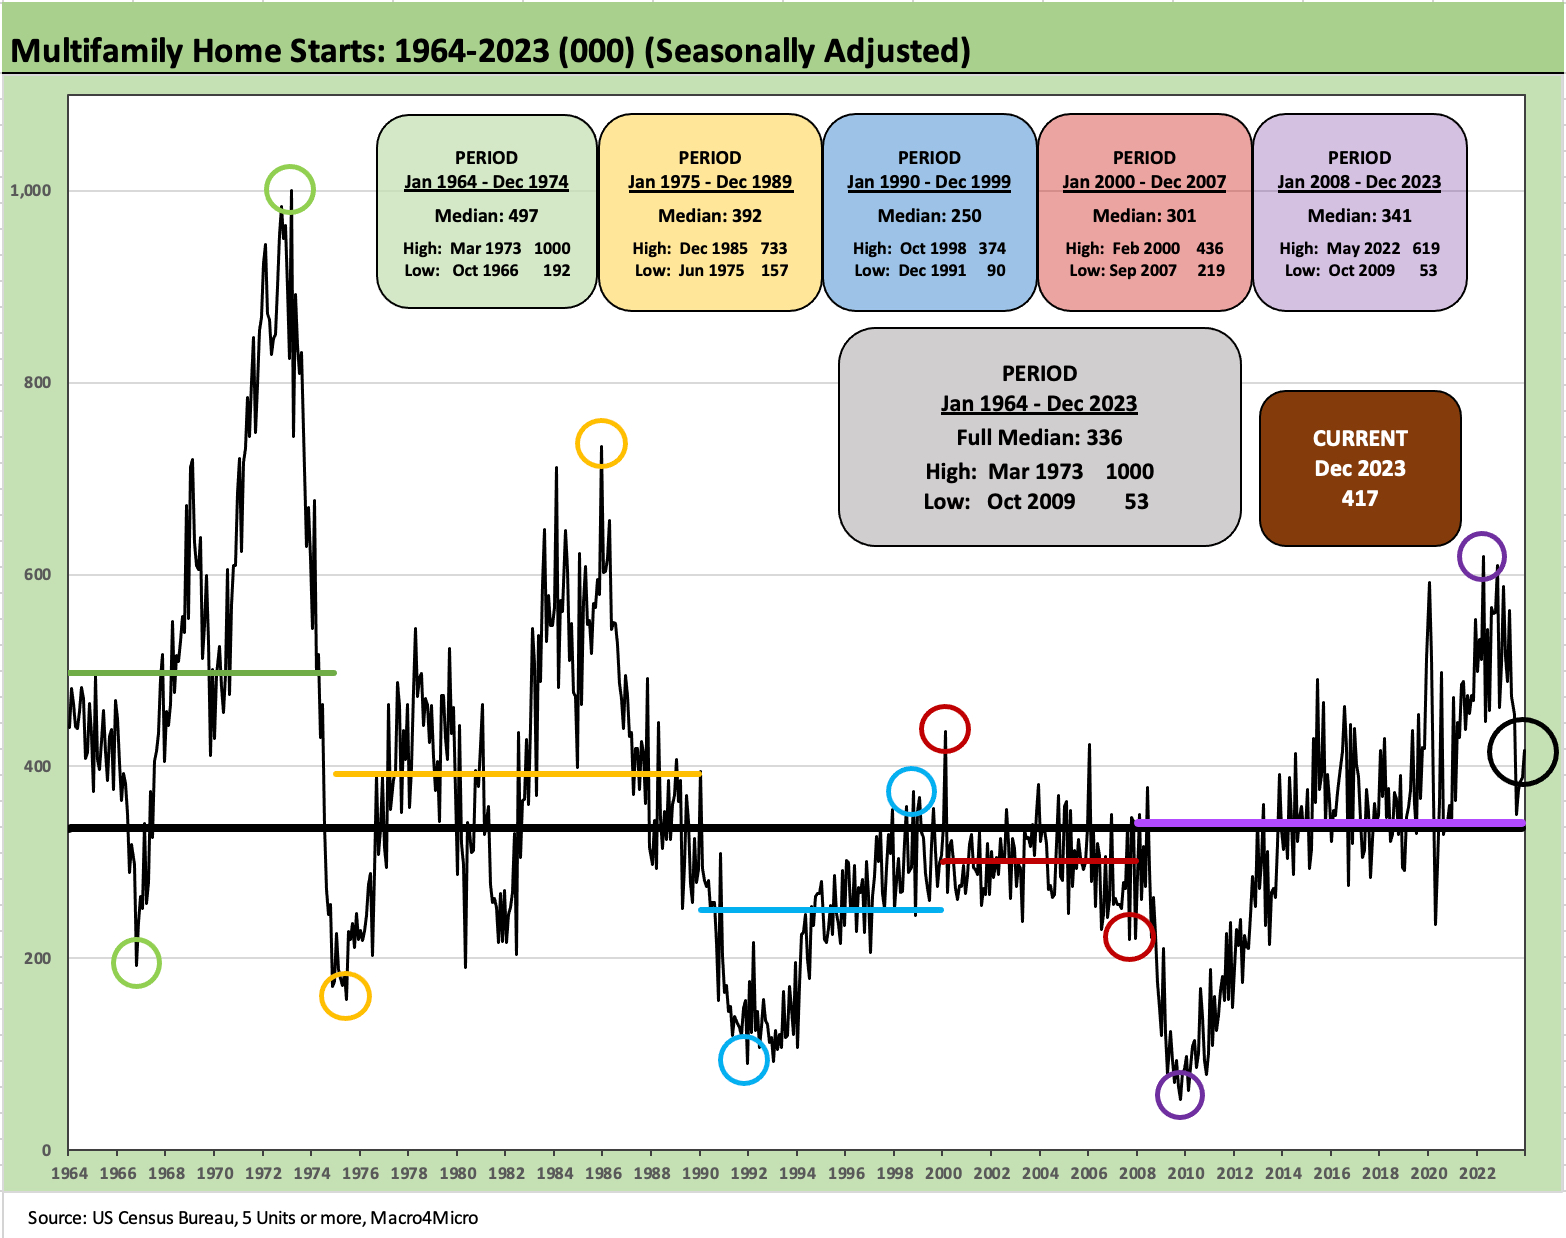
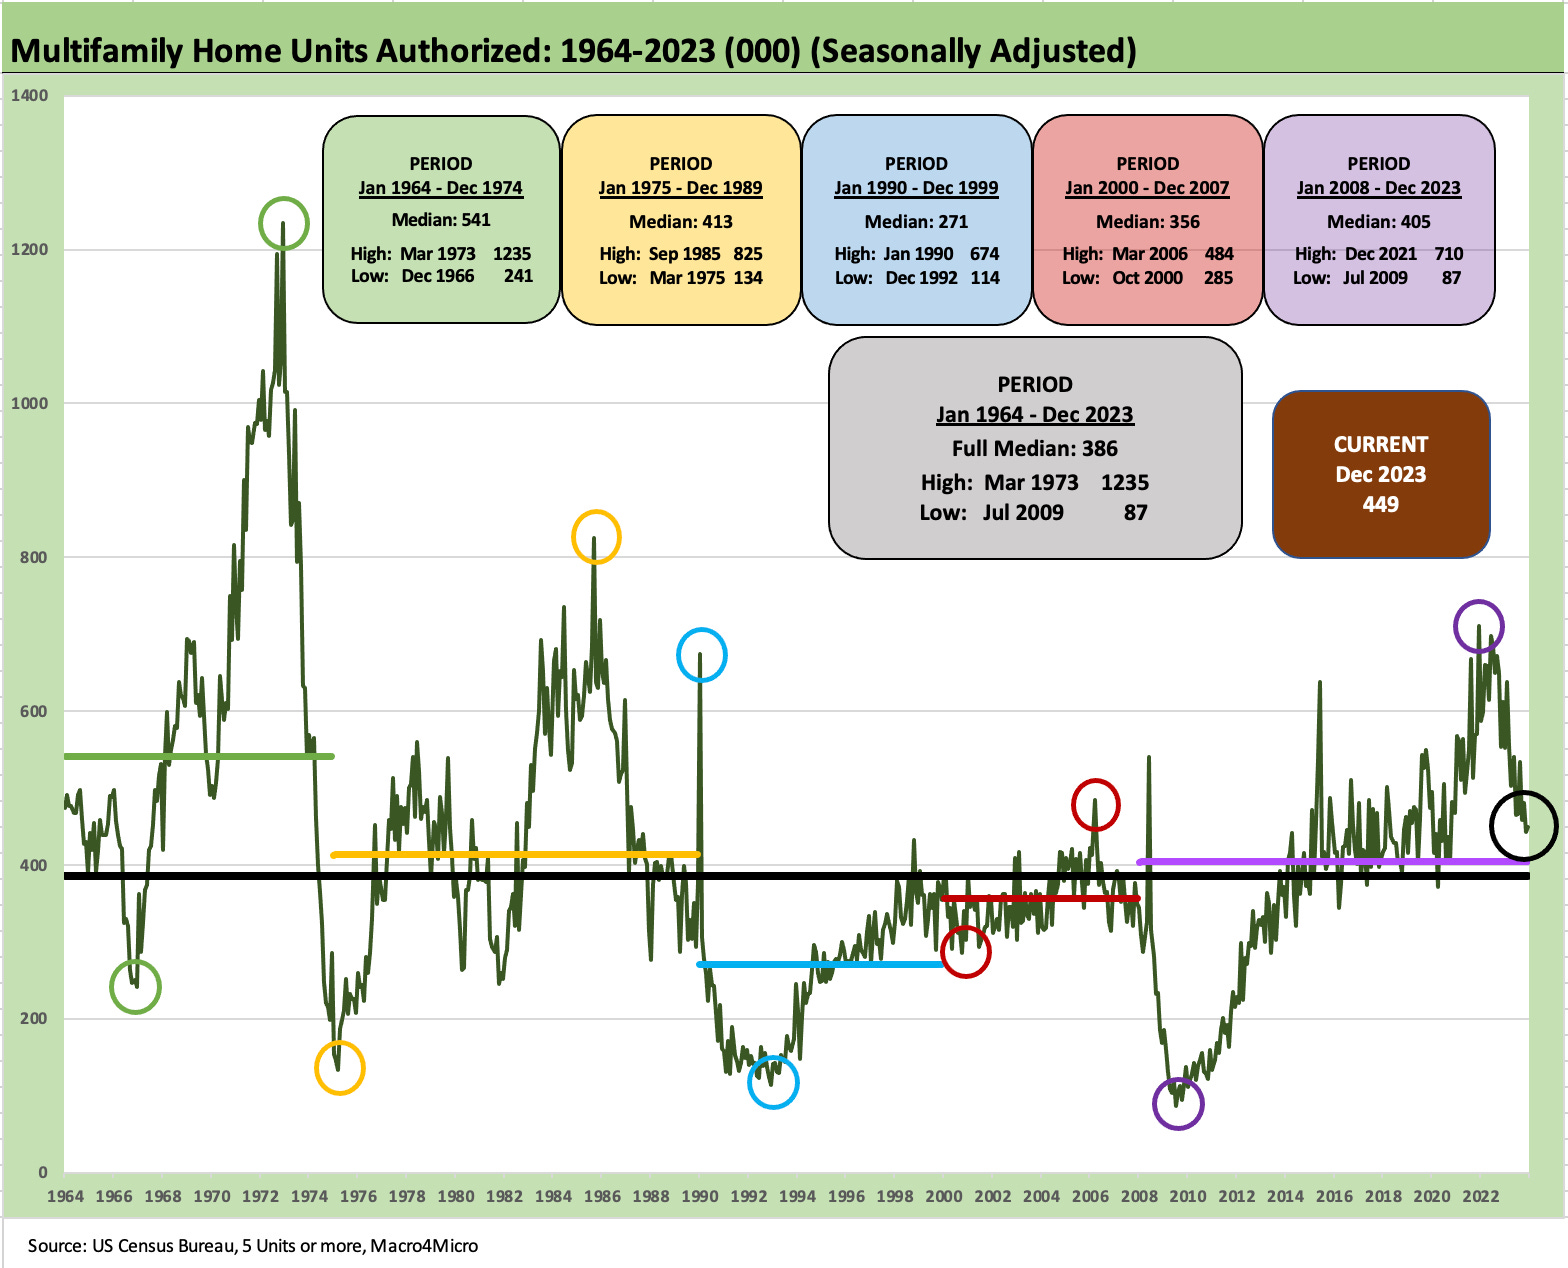
The market has been witnessing the biggest multifamily cycle since the early 1980s as shown in the chart. The current run rate is still strong and above the post-crisis median and most of the medians detailed in the boxes above except for the mid 1960s/mid 1970s median. Multifamily starts are down YoY but up sequentially, so the multifamily sector remains quite busy.
The above chart shows multifamily permits tailing off as the high rate of units under construction and high rate of completions bring more units onto the market. There are a lot of “lease vs. buy” decisions that need to be made as potential homebuyers wrestle with affordability and the timing of potential purchases. Meanwhile, UST bulls hope more rental supply will take the somewhat dubious “Owners’ Equivalent Rent” inflation metric lower.
See also:
KB Home: Wraps Industry Rebound Year, Exiting on Upswing 1-14-24
Nov 2023 New Homes Sales: Feeling the Volume Fade 12-22-23
Nov 2023 Existing Home Sales: Avoids New Lows 12-20-23
Housing Starts Nov 2023: Foot by Foot, Row by Row 12-19-23
Lennar 4Q23:Buyer Buzz, Curve Support 12-15-23
Credit Crib Note: Lennar (LEN) 11-22-23
Pulte: Relative Value Meets “Old School” Coupons 11-15-23
Credit Crib Note: PulteGroup (PHM) 11-15-23
Credit Crib Notes: Toll Brothers (TOL) 9-11-23
KB Home: Credit Profile 6-24-23
D.R. Horton: Credit Profile 4-4-23