
CarMax FY 2024: Secular Neutral? Or Cyclical Gear Shift?
We look at CarMax and used car market color as a lead-in to the wave of auto earnings and guidance in a shifting consumer sector.


CarMax (KMX) earnings and guidance last week were met with a thumbs down in the equity market (-9.2% stock reaction), but the financial risk profile of KMX remains healthy and the balance sheet solid even if the intermediate term growth expectations are getting scaled back on end market fundamentals.
The competitive position of KMX in used vehicles is hard to challenge as the market share leader in a fragmented market given that KMX can sustain investment in its footprint (stores), its omnichannel capabilities, and expansion of its service offerings from warranties to finance.
KMX results show the pressure on volumes and pricing in a used vehicle market facing affordability challenges tied to higher financing costs and materially higher used vehicle prices since the post-COVID repricing of both new and used vehicles.
Watching trends in the steady and profitable CarMax Auto Finance (CAF) unit offers an additional window into the customer base in used cars and a reminder that used vehicle buyers run the full gamut of credit quality with a heavy mix of prime and near prime borrowers.
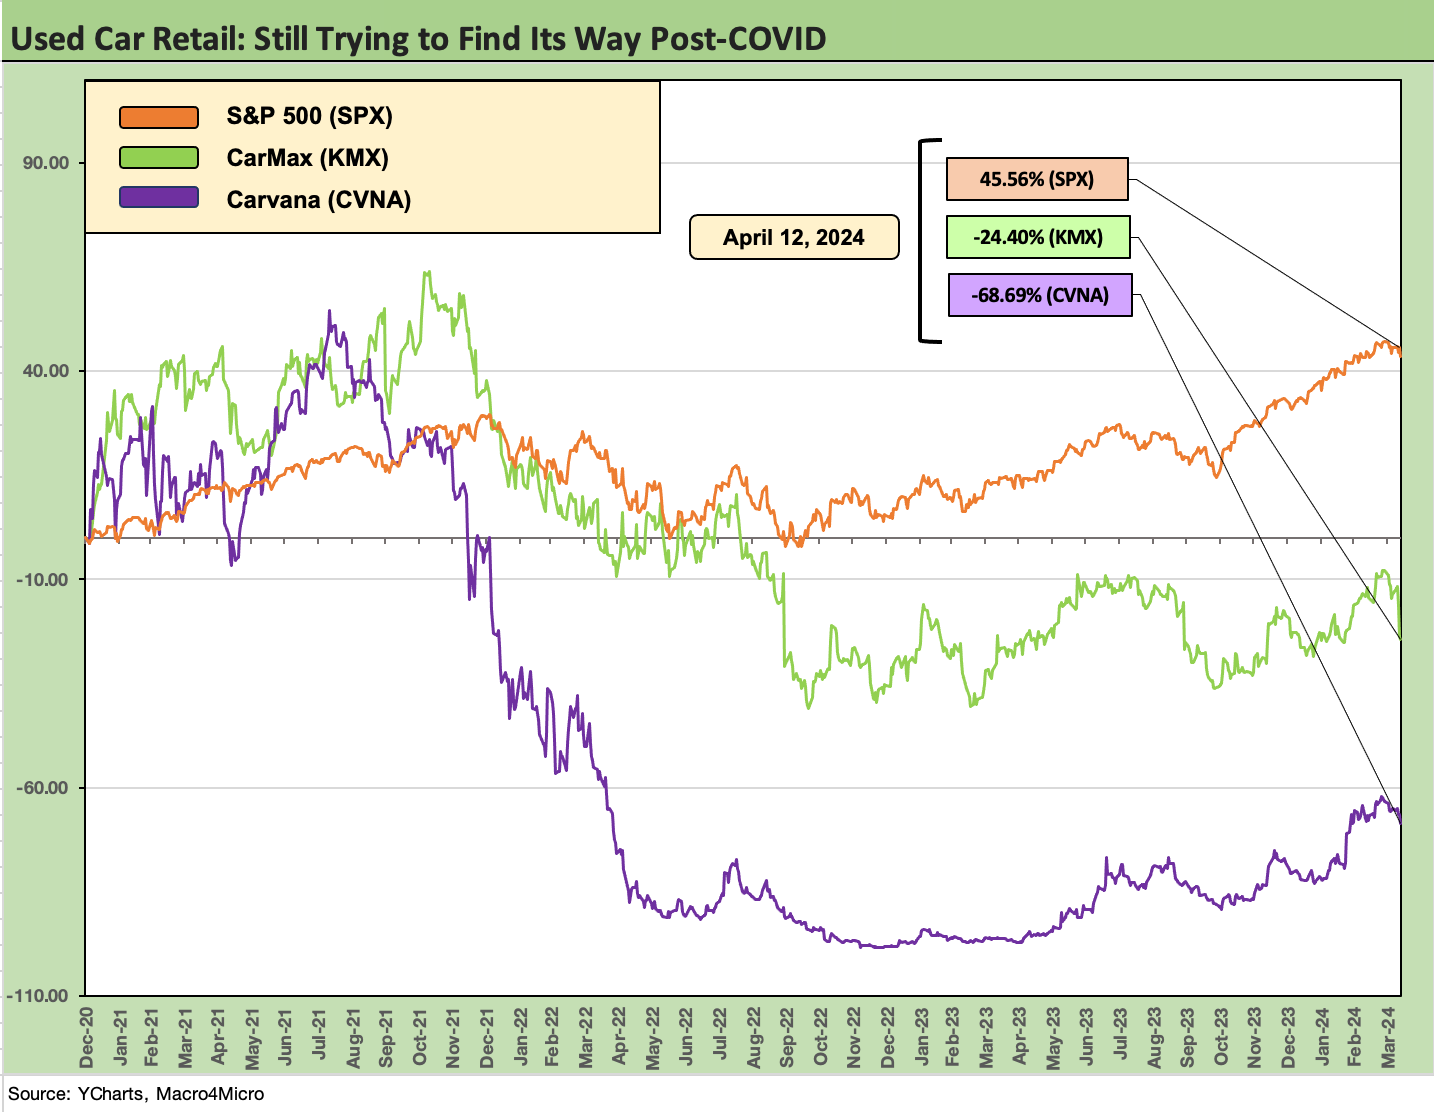
The stock chart at the top tells a wild story around major used car equities. KMX and Carvana are the main events in the used car space, and the digital retail market still captivates this business despite some IPO bombs.
CVNA is the main event in digital now with its outsized valuations and has clawed back to #1 in equity market cap in auto retail with KMX at #2 and Penske (PAG) at #3 from the dealer subsector. KMX has been a poor performer in equities across the post-COVID rebound with CVNA collapsing before a recent partial retracement. The dealers have been steady in the auto retail space as we detail further below.
The market is comfortable with the franchised dealers and KMX at low multiples but is still taking leaps of faith on a lot of top-down handicapping on how the auto retail subsector would evolve beyond the traditional dealers and the dedicated leaders in the used car space (KMX). CVNA and its excess forward valuations are reminiscent of the TMT bubble years of the late 1990s, and that is a separate story (see links at bottom). We will revisit that one with earnings season.
KMX as a useful bellwether…
We like to watch KMX in part for indications on used car risk (flows through to Avis and Hertz), for a read on how the franchised dealers are faring in competition, and for a sanity check on CVNA (yes, CVNA valuations are insane, but that is not the first or last of such cases).
The focus here is KMX with some industry and peer group perspective to go along with its struggling growth story as volumes have faded. KMX underperformed the franchised dealers with the lower business risk profile inherent in the dealers’ more diversified mix of sales across both new and used, F&I products, and higher margin Parts and Services offerings. The dealers have the luxury of guaranteed product flow across their lots from the OEMs, and an established replacement cycle from a massive population of vehicles on the road ripe for trade-ins and lease roll-offs.
We have looked at the trends in used cars at some length over the years given how the used car retail business has changed. There has been a lot of activity from M&A to IPOs and debt issuance. The digital retail space gets a lot of sell side equity airtime. Recent work we published includes commentary on CarMax (see Credit Crib Note: CarMax 2-21-24, CarMax: Credit Profile 7-9-23) and Carvana (see Carvana: Credit Profile 3-5-23). CarMax is a very actively followed equity and a major ABS issuer, but it has no publicly rated and traded bonds even if it is a major credit counterparty with the banks.
The earnings season is getting warmed up for the broader array of auto-related earnings releases and guidance from the supplier-to-OEM chain, the public franchised dealers, and related used vehicle services from retail to remarketing and auctions. For CarMax and used car retail, the revenue and pricing has been weak for FY 2024. We dig into those details in the tables below.
KMX offers color on consumers and changing business models in used cars…
We update KMX as a prism that can be used to view numerous angles in the market for used cars. With 35 to 40 million transactions per year, used car purchases and related financing tell a story of what is going on in a big-ticket consumer sector. We also look at how the auto retail equities have played out across time relative to one another.
With its February fiscal year (FYE 2-29-24), KMX warms up the process as a microcosm of what is going on in used cars and how that relates to the new vehicle markets, automotive finance asset quality, and the used car market challenges facing the major franchise dealers. Used car trends also have a great deal of significance for Avis and Hertz with earnings heavily wagged by vehicle depreciation as a de facto cash expense.
KMX telling a tale of headwinds for used car market fundamentals…
In the case of CarMax, the growth optimism that called for 2 million units (retail + wholesale) by 2026 (FY 2024 posted 1.3 million) and north of $33 billion in annual revenue (FY 2024 $26.5 billion, down from $29.7 bn in FY 2023) is off the table with the timeline now looking out toward 2030. The target for a 5% US market share of the 0 to 10 year used vehicle market is also now on hold subject to update.
KMX indicated they would update their timing on achieving their bullish revenue, unit, and market share targets at the end of FY 2025 (the current fiscal year). That color from CarMax as industry leader pushes back on the near-term growth opportunity for used cars whether that be KMX or CVNA or the used growth ambitions of the dealers including some with stand-alone used car store brands and heavy investments made in digital and omnichannel.
The COVID impacts go on giving (headaches mostly) as LV sales tanked to an 11 mn handle low in the spring of 2020. When we think back to 17-handle light vehicle SAAR rates in stretches of 2018-2019, we need to keep in mind the lag times to replacement cycles. Supplier chain and consumer stress flowed into the weak 2021-2022 SAAR rates with a mix of 12, 13, and 14 million handle SAAR quarters.
The supplier chain issues set off a wave of used car inventory hoovering and crazy inflation in used cars. The hangover on inventory and supply is still being felt but has been slower to correct on the affordability pain of the tightening cycle and 11% handle used car financing rates.
This is not a KMX-specific problem since we see all the major players overestimating where volumes, revenues, and margins would head as prices and financing rates undermine demand for both new and used vehicles.

The above chart updates the stock performance across the various auto retail and services names as food for thought. Looking back at the 1-year and 3-year horizons, we see two of the more used-car-focused names in Lithia and Sonic lagging the other franchise dealers. Meanwhile, the used car focused names at the top of the chart lagged badly looking back across 3 years. VROOM was one of the digital used car retail flops.
KMX equity has been a major disappointment the old-fashioned way with weak growth and sliding revenues. CVNA has impressively bounced off its liquidity crisis with the help of the bondholder group and debt restructuring that operated like a zero-sum game between CVNA equity and the face value of debt and interest payments. From here, CVNA bondholders can mind the store and feel confident that they have par protection in the event of a fresh crisis in CVNA’s business that leads to another cash flow shortfall and distressed exchange. The theory is CVNA can be “Hertz Part Deux” on par plus restructuring with new debt plus CVNA equity.
The secular shift to used slowed down in a hurry…
The expectation of a sea change in consumer habits in their car buying has not worked out as planned in scale or as rapidly as expected even with waves of changes in technology and digital retail practices (customers, dealers, sourcing, inventory management, etc.). Supply and demand can ruin sound theories with economic reality. Used car inflation had gone off the charts for a while and new cars faced strained production chains.
The good news for KMX is that the free cash flow and balance sheet strength leaves KMX as a rock-solid credit risk to deal with whatever the market throws at them. They just don’t have as much room to pitch a growth story for now. Total debt is materially lower since FY 2022, and KMX is well inside their long-term target leverage range (35% to 45%). KMX could opt for more leverage and more shareholder enhancement, but they have historically run a tight ship on financial risk. They have shown a willingness to buy back shares on a major scale as we cover further below in this piece.
KMX has a solidly profitable finance unit (CAF) that is doing well and remains a key strategic chip to play in attracting buyers and sellers alike. Their array of service offerings via online retail are showing progress and their extended protection plans are working as planned and accretive.
CAF boasts solid asset quality and provisioning has not been a challenge so far even if asset quality is seeing cyclical pressure. KMX disclosed its high weighted average FICO score (719, trending higher in recent years). CAF has even reduced provisioning in later FY 2024 although we would flag that as aggressive (if defensible) given the direction of credit loss experience and delinquencies. That will need to be watched for reasonableness in FY 2025.
Near term used vehicle strength face two headwinds: supply and demand…
The cyclical dynamics of used car retail can be broken down into a few main buckets to simplify the moving parts. The supply and demand balance for dedicated used car retail is highly dependent on addressing supply uncertainty (how many sellers can be found at the right price) while new car dealers have guaranteed inventory from a manufacturer for supply. That can make all the difference in business risk.
Tight supply can hurt volumes and undermine revenue as we have seen at KMX and CVNA. It can also lead to aggressive pricing in sourcing that undermines margins. You still have to battle with the dealers for the used car supply with their extensive customer data histories from past sales. That does not make life easier for KMX or CVNA. Pitching a growth story with declining revenues and volumes is tricky, but CVNA’s declining revenues and volumes have not stopped its stock from soaring back.
We look at the supply-demand dynamics in simple terms in what is a very complex business in execution:
Supply of used cars: Whether sourcing from the consumer or dealer online or otherwise, KMX needs to get used vehicles in higher volumes in order to resell those cars. Car buying has a multiplier effect on both the supply and demand side. Sourcing at the right price and in high volume is easier in theory than in practice. KMX’s Instant Offer process can be tied into KMX’s customer prequalification product for financing to drive sales at the same time. The ability to source and sell in the same sequence is the best scenario.
Sourcing has been tight, and that is a problem for KMX as well as for CVNA. KMX bought almost 11% fewer vehicles from consumers during 4Q24 while 21,000 were purchased through the smaller dealer sourcing (+45% YoY). The MaxOffer program has allowed for growth in dealer-sourced supply. The non-dealers don’t have the captive supply that many franchised dealers see with trade-ins and off-lease vehicles as well as from the car rental operators that buy in bulk from the OEMs and then remarket those into the late model used car market. Even the car rental players are trying to improve their direct to retail and direct to dealer channels for used cars. That is very competitive.
Franchised dealers have an intrinsic advantage in supply in terms of the low-hanging fruit of trade-ins and lease returns. They also have the ability to offer Certified Pre-Owned (“CPO”) vehicles after reconditioning with parallel F&I products (warranty and service plans). Vehicle quality and dealer service support is a strong selling and buying feature (sell the 8-year-old car, buy a 3-year-old car, etc.).
Dealer locations (“the local dealer”) together with Parts & Services operations all figure into the all-in economic decisions for dealers as well as the buyer. The dealer has multiple revenue streams. In other words, this is a competitive business with all subsectors in auto retail pursuing digital solutions while playing to their perceived advantages.
While digital is the megatrend, even the digital players in using auction technology need physical reconditioning facilities and qualified personnel as part of the same process for both new and used business lines. That means competition for labor as we see in the automotive inflation numbers for maintenance and repair employees.
CVNA’s debt-financed expansion in physical properties was a key driver of its cash flow crisis and debt restructuring. It took on too much debt. In the meantime, KMX can just keep investing with its healthy cash flow and strong balance sheet even if the market is slower. In terms of forward-looking prospects, who will be stronger in two years and be able to meet the investment demands?
Demand for new or used: The consumer decision point is only more challenging now with affordability the dominant variable. That challenge to demand also flows into supply since the affordability headwind slows down overall volume and the ability to source vehicles on the other side of the decision to get a new car or a “newer used car.” The higher new and used car prices after a few years of supply-demand imbalances and rising financing rates strained affordability but set the stage for volatility in used car depreciation (aka price swings). The depreciation volatility sometimes can be tied to how dealers address their inventories of trade-ins and lease returns (i.e. cut prices to retail as they unload stale used inventory).
The expectation of Fed easing and a lower UST curve on the front end just faced a stall after 1Q24 with June now in theory off the Fed table during peak new and used car season. Those short rates dictate funding costs for the buyer, so that could translate into car buyer decisions being postponed, lighter demand overall, and thus less opportunity to source used vehicles in 2024 – that is, tighter supply. That is a big deal for the pure play used car operators (KMX) and digital players (Carvana).
The decision to trade in a used car for a “less used car with less miles” or take the full swing of the bat for an expensive new car or lease is all part of the decision for the consumer who is already feeling the bite of inflation.
Watching used car price trends…
There are a lot of services watching used car prices and auction levels (Manheim, etc.) and high quality price transparency given the volume of transactions and the need to price ABS portfolios. Data sources are out there, but looking at what KMX sees in pricing as the #1 player is a good sea level gut check. The next two charts show the average prices at KMX for both retail and wholesale.

The above chart shows the used car retail prices experienced by KMX since the end of 2018. The big step up in prices after 2021 brings a meaningful affordability headwind to demand. The move from a $20K handle in 2018 to $28K annual level in FY 2023 and a dip only to a $27K annual rate in FY 2024 is no small move. For F4Q24, we see retail prices down to $25K handle in a sign of used car price softening.
Those price moves always come with an asterisk around mix, but it stings for the consumer that used to see $20K a few years ago. That is especially after considering the rising financing costs. For KMX, where the loan-to-value on its managed receivables book is over 88%, the contract rate is now up to over 11% and hit a new peak in FY 2024.
Still winding down the post-COVID new car/used car supply-demand imbalances…
One major theme driving a lot of optimism around the future of used car retail was that high new car prices in the age of student loans and post-inflation “expensive everything” would drive a secular shift toward used cars (especially late model). The differential between new and late model used had been spiking before COVID, but then the market ran into COVID and the supplier chain meltdown saw used car prices spike. The mere availability of the vehicle dominated the dialogue for a while.
We are now back at somewhat normalized supplier chain functionality and used cars are back in modest deflation mode. The disruptions in daily car rental fleets during 2020 and 2021 took some time to work through in those remarketing cycles. The COVID crisis that hit airport travel was a big event along the way, and then the Hertz Chapter 11 rattled fleet size and remarketing side effects as fleet liquidation unfolded.
The holding periods for daily car rental run a natural course as part of their normal business, so that undermined used car supply at a lag effect. We also saw that after the global financial crisis when lease volumes and new car sales plunged. The breakdown in the new vehicle supplier chain had the same effect of distorting prices and residuals, and notably in terms of the volume of new car leasing deals (and the supply lag on late model used car supply).
The timing of a rebound in new car volumes into 2023 after recession level volumes in 2022 saw an eventual lag in used car values running alongside sharp rises in new car purchases with high prices. For car rental companies, high per unit vehicle cost was a risk on the remarketing side as fleets turned over.
The supply of used cars for sourcing was still short of expectations as dealers, KMX, and CVNA all had big plans. Smaller digital-only players in used cars (VROOM) were eaten alive. That was just one subplot of new challenges for used car retail as some very unusual market pricing patterns for used car demand (new vs. used) all still added up to strained affordability and high borrowing costs.

The above chart tracks the wholesale price levels, and we see pretty dramatic moves there as well from $5K handle annual average in FY 2021 to high $9K range in FY 2023 and $8K range in FY 2024. For F4Q24, the average selling price was down to $8.03K vs $8.3K in F4Q23 as the trends level off a bit. That is down from a peak of $9.9K in FY 2023, $9.2K in FY2022 and only $5.1K as recently as FY 2020 (that is the last pre-COVID FY mostly comprised of calendar 2019). The peak quarterly wholesale price we see above is $11.5K in F4Q22 (the 2-28-22 quarter, which is just before the tightening cycle began).
By the numbers…

The above chart breaks out the revenue and gross profit numbers since the COVID outbreak and ensuing volatility in the vehicle sector broadly. As a reminder, FY 2020 (2-29-20) marks the last fiscal year without the COVID effects in the mix. We see gross margins in FY 2024 back in double digits and up sequentially from FY 2023, but F4Q24 was modestly below F4Q23.
The results make it clear that net margins are very low, and growth has stalled. CAF is a major profitability contributor, but the decline in CAF income to the lowest level since FY 2021 offers a reminder that the UST curve hit KMX from a few different angles. First, interest margins take a hit. Second, demand gets undermined by high financing rates with weighted average contract rates up to 11.2% in FY 2024 from 9.7% in FY 2023 (11.5% F4Q24 vs. 10.9% F4Q23). If demand weakens (for new or used) and replacement cycles slow down, the supply sourcing side of the equation is affected as well.

We have already addressed the volume and pricing issues earlier, and the chart above breaks out the KMX annual run rates and most recent quarterly comp. The “price x volume” exercise could not be more straightforward, and the reality is that retail volumes were down in FY 2024 and wholesale vehicles were also down.
The table shows the lowest retail level since FY 2021 (2-28-21), which was essentially the first full year of COVID. Retail volumes ticked higher YoY in F4Q24 vs. FY 2023. Wholesale volumes in FY 2024 were also the lowest since FY 2021 and F4Q24 wholesale volumes lower YoY.
When we look at average selling prices, used retail prices for FY 2024 were down sequentially from FY 2023 but above FY 2022. The FY 2021 retail prices were only at a $20K handle vs. the $27K handle in FY 2024. On the wholesale side we see $8K handle ASPs vs. $5K handles in FY 2021 and FY 2020.
That hike in retail price underscores the affordability challenge. An example of the the consumer payment burden came up in the Q&A on the conference call, and how lower rates and lower prices in a $20K period would be around a $400 per month payment vs. more current levels around $530 per month.

Gross profits were under pressure in FY 2024 and were down for the year in both Retail and Wholesale and well below FY 2022. The “Other” buckets for services were higher in FY 2024 in the revenue mix covering extended protection plans, but that declined in F4Q24. Total gross profits for the year and final quarter were down.
As we get into the Gross Profit Per Unit disclosure (GPU), we appreciate the value of gross profit per unit, but it is always worth restating the overriding importance of volume to make the stock story work or the credit fundamentals to hold up. As an example of too much highlight on GPU, we see that metric dominate the earnings releases of CVNA. The fact is that CVNA needs dramatic growth in revenues and volumes to justify its multiple in a way that KMX does not. The struggle in volumes, sourcing and affordability hurt them all at this point.
Steady growth in volumes and solid price and volume is the nirvana goal for KMX, a company that had been pitching material growth and much higher volumes and revenue by 2026. At this point, volumes are flagging while prices are softening after the distortion spikes of COVID and the supplier chain challenges.

The auto finance unit (CAF) is a profit center by itself and one of the two reportable segments (along with the Used Car sales operations). KMX uses the CAF unit to drive sales volumes while also building out a credit business that is ripe for expansion ahead. We see the base of earnings assets growing substantially on the managed receivables line above, and that helped cushion the blow from the interest margin pressure from rising rates.
FY 2024 CAF income is back to around FY 2021 levels on a doubling of interest expense and higher provisioning that comes with asset growth. Interest margins are the main event since that flows into vehicle affordability (the contract rate to the buyer) to the buyer and sets CAF margins. CAF pays more and charges more, but the margin is tighter.
The high contract rates bring a braking effect on transaction volume just to make life even more difficult for the volume-dependent and transaction-driven used car markets. A typical total used car market volume of 40 million dropping down into the 35 million range is still a massive market, but as noted earlier there are more market entrants and more mouths to feed in the face of diminished supply.
The income statement shows interest and fee income growing along with managed receivables, but rising interest expense saw interest margins lower in FY 2024 after a small rise in FY 2023. We see asset growth along the managed receivables line even if origination volumes are declining along with unit sales.
Total net income for FY 2024 declined as noted in the table above, but F4Q24 net rose by almost 19% on materially lower loan loss provisions. As we look at the asset quality provisions above, lowering provisions in 4Q periods always raises eyebrows. The bad news is that FY 2024 net credit losses are rising, delinquencies are rising, and recovery rates (on repossession) are declining.
The good news is the allowance cushion remains steady. Despite that, lowering provisions is a trend that is worth watching. Allowance adequacy will be an area to watch, but reserves % allowance has been in a tight range the past 4 years, more than doubling the allowance % receivables between FY 2024 and FY 2020.
KMX has cited tighter lending standards during its earnings call to support lowering its provisions later in the year. FICO scores are higher in the 700-handle area (719 for FY 2024 vs. 708 in FY 2023 and 703 in FY 2022), so the quality mix is respectable and better than many might assume for a used car operation. That comes even as KMX points at becoming a full spectrum lender in coming years. The aggregate loan-to-value was 88.7% at year end and the net penetration rate was just under 43%. CAF can grow this business and just needs to do it gradually and prudently.
The bottom line on CAF is that the operation is profitable and is a strategic asset. Like any financial lending operation set against a tightening cycle, the interest margin squeeze is a fact of life. In the case of KMX, higher rates are a headwind for volumes in its core business and is a threat to asset quality risk if jobs and the macro picture fade.
CAF still gives KMX an edge over CVNA and helps in competition with the major dealers. A $568 million income contribution is good by any standard against peers but could be better under other macro conditions. The $801 million net income in FY 2022 (primarily calendar 2021) will be rough to get back to as the ZIRP years are gone.

The balance sheet is the anchor for the long -term strategy of KMX to expand its footprint, omnichannel investment and its CAF unit. Capital allocation priorities historically have focused on investment in the core business and stock buybacks rather than big bang M&A or dividends. The one smaller scale acquisition (Edmunds in FY 2022) was a natural fit in terms of reaching dealers and consumers online and bringing more intelligence tools into its service offerings.
The comfort zone of the banks offers some reassurance on the strong credit quality of KMX with a $2 bn unsecured revolver fully available. The asset protection goes beyond the franchise values and strong cash flows since KMX owns a lot of real estate in its operations. KMX has 245 stores (110 for production and reconditioning activities with more acreage) with 162 of those being owned sites at year end and 83 leased. The largest concentration of stores is in CA, TX, and FL with a KMX footprint across 41 states.

The uses of cash flow across the liquidity lines are broken out above. We see heavy stock buyback activity over the time span of almost $2.7 billion since FY 2019. The running total is around 24% of current equity market cap. Capex is highly discretionary but has been steady and even hit a high in FY 2024, but that is less than 1.8% of FY 2024 revenue. At that level, KMX presents a low capital intensity profile.
The financial health, cash flow, and available liquidity presents a stark contrast with the financial flexibility of the recently restructured CVNA with its negative cash flow and adjusted losses on the bottom line.
The ability to deal with a recession is clear at KMX as the credit crisis and COVID period resilience drive home. In the event of a steep cyclical downturn (which we don’t foresee), franchise dealers might readjust their priorities and scale back the attempt to crack the code in dedicated used car retail sales. CVNA would face even more challenges in such a market.
For CarMax, see also:
Credit Crib Note: CarMax 2-21-24
CarMax: Credit Profile 7-9-23
CarMax 4Q23: Wacky Markets, KMX Stays Steady 4-11-23
The Used Car Microcosm: Industry Comment 11-29-22
For Carvana, see also:
Carvana: Solid EBITDA, but Does Not Cover GAAP Interest 2-25-24
Carvana: Quick Read, Long Road 11-2-23
Carvana and Uncertain Used Car Dynamics 10-5-23
Carvana: Smoke Signals Get Smokier 6-9-23
Carvana 1Q23: Company Comment 5-4-23
Carvana: Prisoner’s Dilemma, Used Car Getaway 3-22-23
Carvana: Credit Profile 3-5-23
Carvana: Wax Wheels 12-8-22
Glad my car with 151,000 just keeps on going since buying a car today (I did recently for a family member living away from home) felt like I was being mugged by the pricing...talk about junk fees wish Joe would tackle that one
interesting to see if the vulture community learned alot from saving Carvana thru the debt while simultaneously riding the equity up 700%...maybe that road map will be different in the future