

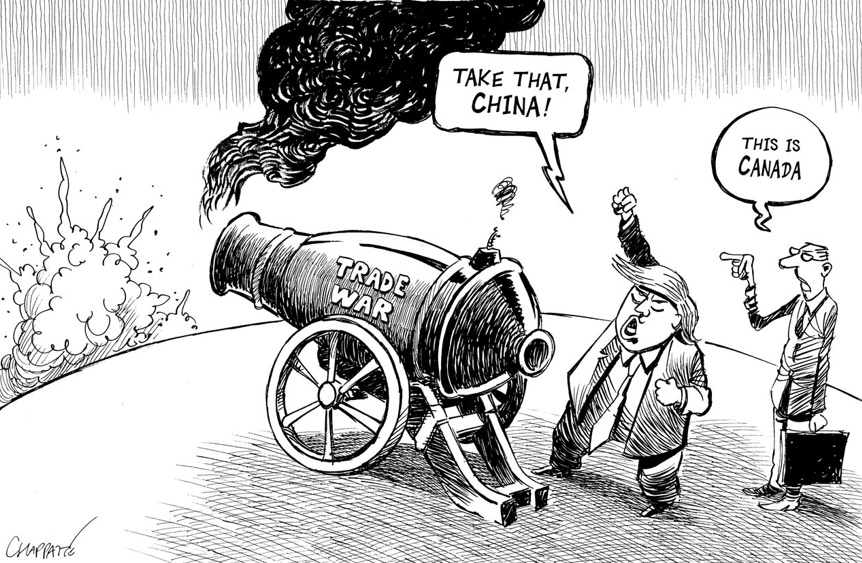
You know you have a goods trade surplus with Canada excluding oil, right? And a big services surplus? And they are in NATO? And we depend on them for numerous resources?
The weekly asset returns were biased toward negative, but last week is already “old news” as the weekend kicked off with a trade war crisis. The trade chaos from here is likely to escalate in directions that are very challenging to handicap with a top 3 trading partner.
UST rates were up this past week, and the “$40 trillion headline” was not helped by Bessent taking liability management action in the latest iteration of “Operation Twist.” It sent the wrong signals to markets about the root of the problem and prompted more than a few to reconsider if Bessent had his arms around the scale of the problem as geopolitics, disrespect, and trade aggression alarm allies.
Canada is the #3 export market YTD, and the export product mix is the highest value added of the major trade partners. Canada ranks as the top export market for many critical swing states in an election year.
The midterm election plot was thick enough already with the fears of Trump interfering with the voting process, and negotiations around USMCA with Mexico and trade tension with the EU also make for scenarios that might include more standing up to Trump tariffs. Having a backbone can get contagious even if Congress has been vaccinated.
A major X factor in the Canada battle is the threat of more supply-demand dislocations and upward price pressure to recover tariff costs. There is also no shortage of scenario spinning over US Canadian resource dependence even if Alberta (oil) and Saskatchewan (potash, uranium) are not inclined to support export taxes.
The disinformation campaign on the “cause” of the breakdown is already full speed ahead. Trump had more pressing issues this weekend (golf and the Freedom 250 Grand Prix in Washington DC), but the predictions for the economic side effects of a major escalation from here will be worthy of a Clubber Lang prediction – PAIN. (see US-Canada: Benches Ready to Clear 8-22-26).
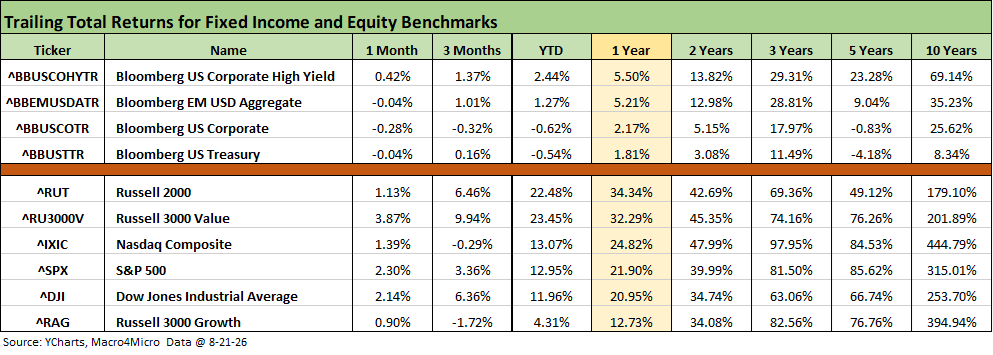
The above table updates various time horizon returns for major debt and equity asset classes. We see 3 of the 4 debt asset classes in the red for the 1-month period with only HY slightly positive. Looking back 3 months and YTD, US Corporates are in the red while the UST benchmark is negative YTD but very slightly positive for 3 months.
For equities, we see the struggles in tech and growth with NASDAQ and Russell 3000 Growth benchmarks in the red for 3 months. The YTD and trailing 1-year equity numbers remain impressive except the Russell 3000 Growth returns YTD. Double-digit returns clear the bar and qualify as outperforming the long-term annual returns on equities.
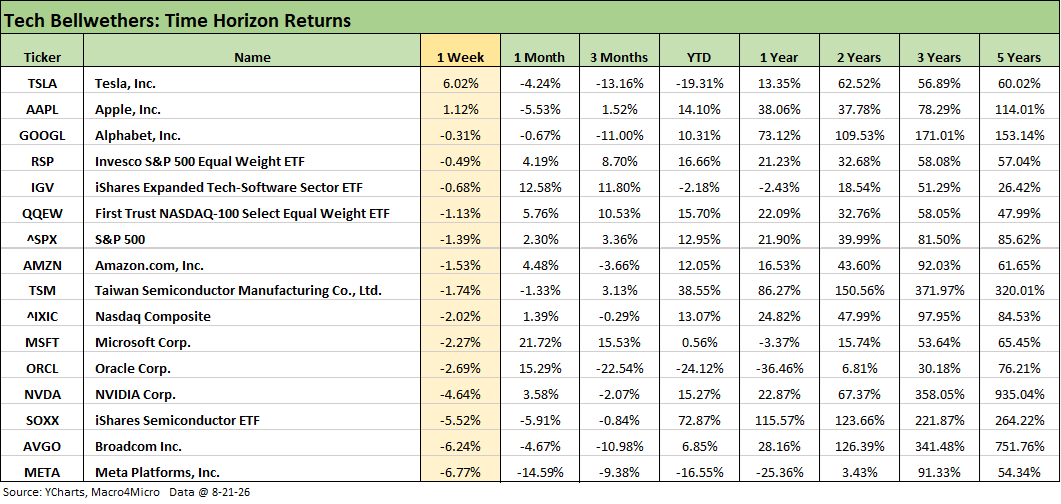
The tech bellwethers had a rough week with all lines negative except Tesla (TSLA) and Apple (AAPL). We see 5 of the Mag 7 in the red for the week and also 5 of 7 negative for 3 months. We see 5 of the Mag 7 positive YTD with TSLA the worst performer at -19.31% YTD and META at -16.55%.
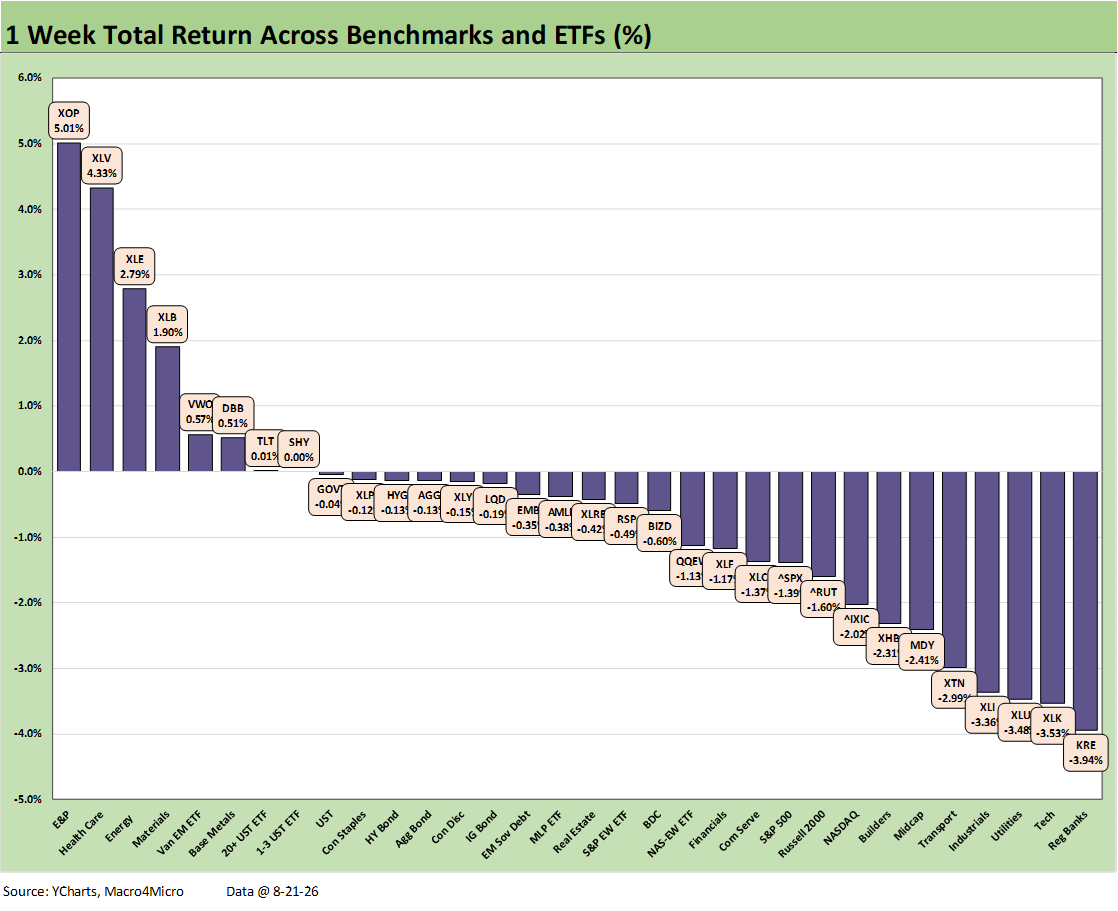
The chart updates the weekly returns for the 32 benchmarks and ETFs we monitor, and the score of 7-24-1 (1 at 0%) is a bad week at the office. The week saw the S&P 500 near the bottom of the 3rd quartile at -1.4% with only 3 of the 11 S&P 500 sectors positive. The S&P 500 was still the best of the 4 major benchmarks with Russell 2000 at the bottom of the 3rd quartile and the NASDAQ and Midcaps (MDY) in the upper half of the bottom quartile.
The week ahead will be no picnic with the need to handicap potential effects of an escalating trade war with Canada. The political unpredictability and human nature aspects of a betrayed ally are beyond challenging to frame. Canada is a trade partner that is much larger than China (by 2x in total trade) and YTD is #3 in exports (EU #1) and #3 in imports (EU #1). Team Trump better hope that courage and conviction is not contagious and another major trade partner piles on. The Canadian export mix is the highest value-added product line mix across the trade partners.
The UST curve noise was busy this week with an upward shift from 2Y to 10Y and the 30Y barely moving higher (+2 bps). The bond ETFs posted 5 in negative range, one at a 0% with the short duration 1-3Y ETF (SHY) and one slightly positive with the long duration 20+Y ETF (TLT). We will look at the UST deltas in a separate commentary, but the upward move in rates came despite Bessent’s ineffective UST “card tricks” exercise. Bessent tapped into a variation (imitation?) of “Operation Twist” in a throwback to the post-crisis years (2011-2012). That Twist tactic has a history back across the decades. Adding to short terms and handing off the FOMC rate decision to Warsh will get tongues wagging.
The asset line winners for the week include E&P (XOP) at #1 and Energy (XLE) at #3 with WTI moving above $87 and +$4.66 per bbl since the prior Friday. Health Care (XLV) was at #2 with Materials (XLB) and Base Metals (DBB) in the top tier also.
The bottom quartile reflects a poor broader showing with Regional Banks (KRE) in dead last joined in the bottom 5 by Tech (XLK), Industrials (XLI), Transports (XTN), and Utilities (XLU). Homebuilders (XHB) were in the bottom quartile with weak home starts posting a double-digit decline.
Retail earnings saw constructive numbers but were greeted with nervous and mixed stock market reactions even when guidance was revised higher. Walmart took a beating, but BJ’s rose. Target (TGT) rose, TJX was down, and Ross Stores (ROST) stock was off slightly. Consumer Discretionary (XLY) was slightly negative and ranked near the middle of the 2nd quartile. Consumers on balance are settling in as a mixed bag. We get the Personal Income and Outlays release this week and updated 2Q26 GDP data with revised PCE after that metric had recovered from an abysmal 1Q26.
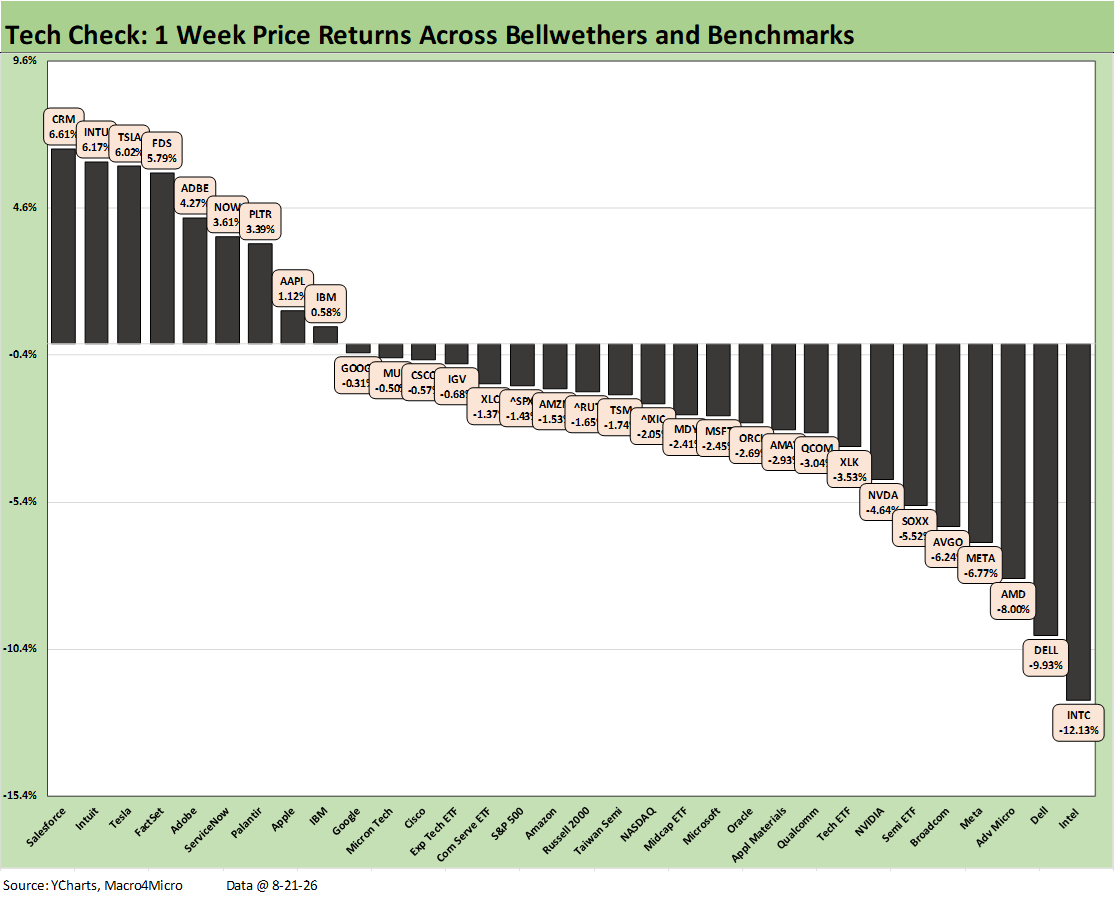
The tech check mix of asset lines this week posted a score of 9-23 in a poor performance that mirrors the broader group of 32 benchmarks and ETFs we look at separately. The Mag 7 posted 5 in the red zone with Tesla (TSLA) and Apple (AAPL) in the top tier, Alphabet (GOOGL) and Amazon (AMZN) in the 2nd quartile, Microsoft (MSFT) in the 3rd quartile, and NVIDIA (NVDA) and Meta (META) in the bottom tier.
The Semiconductor ETF (SOXX) posted -5.52% in the bottom quartile while the Software ETF (IGV) at -0.68% was near the middle of the 2nd quartile. We see a cluster of semi equities and AI ecosystem names in the bottom tier while the top tier saw a continuation of the comeback of the software/SaaS names.
This week brings NVDA earnings and Warsh’s grand opening at Jackson Hole, where he will demonstrate that he is the smartest guy in the room (and very well could be) while saying absolutely nothing specific yet with extreme eloquence. Tech is very sensitive to long-dated UST and Oil, so the UST curve will remain a highly qualitative but critical input for tech valuations.
This week’s tech check return rankings sees Salesforce (CRM) at #1, Intuit (INTU) at #2, FactSet (FDS) at #4, Adobe (ADBE) at #5, ServiceNow (NOW) at #6, and Palantir (PLTR) at #7 steadily recovering from the AI “SaaS-pocalypse.” Of those 6 software/SaaS names in the top quartile this week, only PLTR (+1.23%) and FDS (+3.35%) are back to positive returns YTD with the other 4 (INTU, ADBE, CRM, NOW) still deeply negative YTD. We look at those YTD details separately.
In the bottom tier, we see more of the semiconductor and AI ecosystem group feeling pressure with Intel (INTC) in dead last at -12.13% joined by Dell (-9.93%), Advanced Micro (AMD) at -8.0%, Broadcom (AVGO) at -6.24%, and NVIDIA (NVDA) at -4.64%.
As a broader Teck ETF, XLK is at the top of the bottom quartile at -3.53%, which is ahead of SOXX but behind IGV.
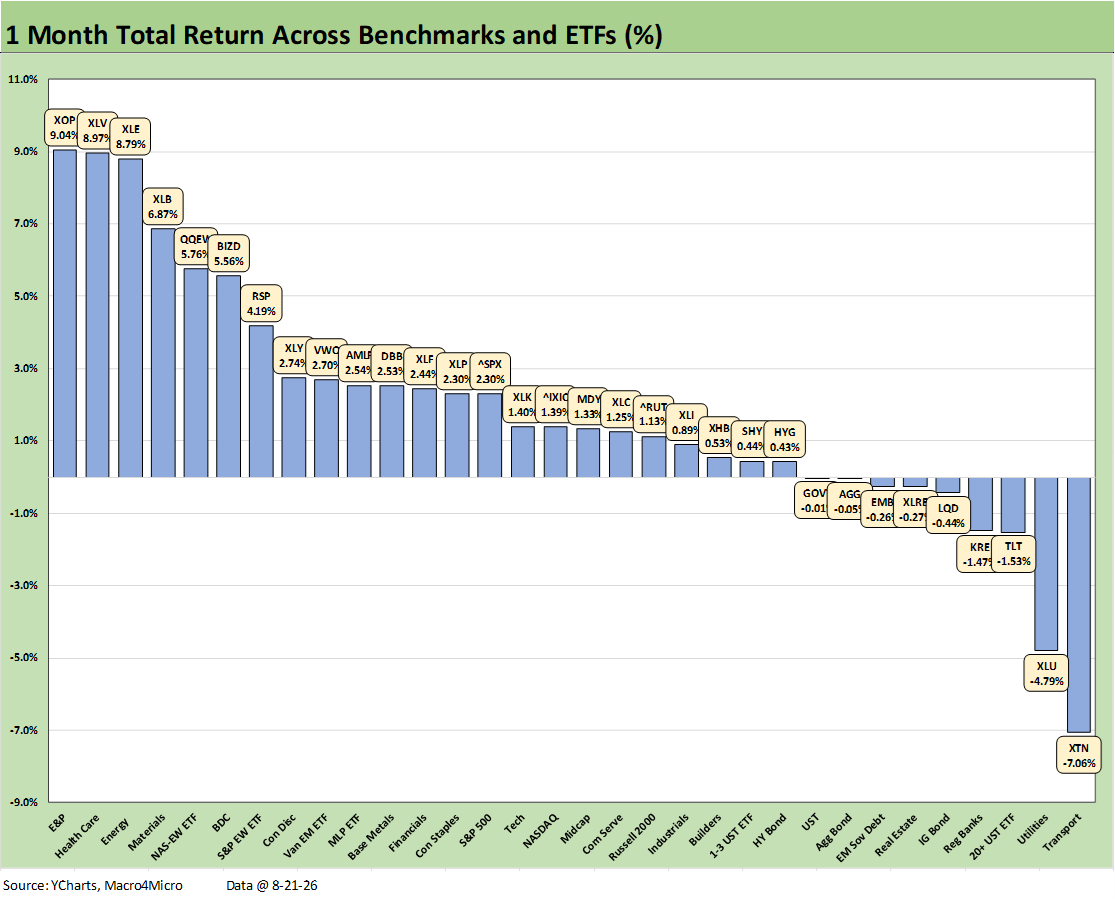
The 1-month returns for the 32 benchmarks and ETFs post a score of 23-9 but with the major benchmarks straddling the lower end of the 2nd quartile (S&P 500 and NASDAQ) and upper end of the 3rd quartile (Midcaps and the Russell 2000). E&P (XOP) and Energy (XLE) are in the top 3 with the more defensive Health Care ETF (XLV). Rounding out the top 5 is the Materials ETF (XLB) and the Equal Weight NASDAQ 100 ETF (QQEW).
The BDC ETF (BIZD) may be a surprise to some by making it into the top quartile after an earnings reporting season that took some of the more extreme scenarios off the table (for now). The Equal Weight S&P 500 (RSP) and Consumer Discretionary (XLY) also made the top quartile.
The bottom tier performers include UST curve sensitive assets including 4 bond ETFs in the bottom quartile with duration heavy ETFs (TLT, LQD, EMB, AGG) with GOVT slightly in the red at the bottom of the 3rd quartile. Real Estate (XLRE) and Regional Banks (KRE) had a rough month. We see HY (HYG), the short duration 1-3Y UST ETF (SHY) and Homebuilders (XHB) at the bottom of the 3rd quartile with sub 1% returns for the month.
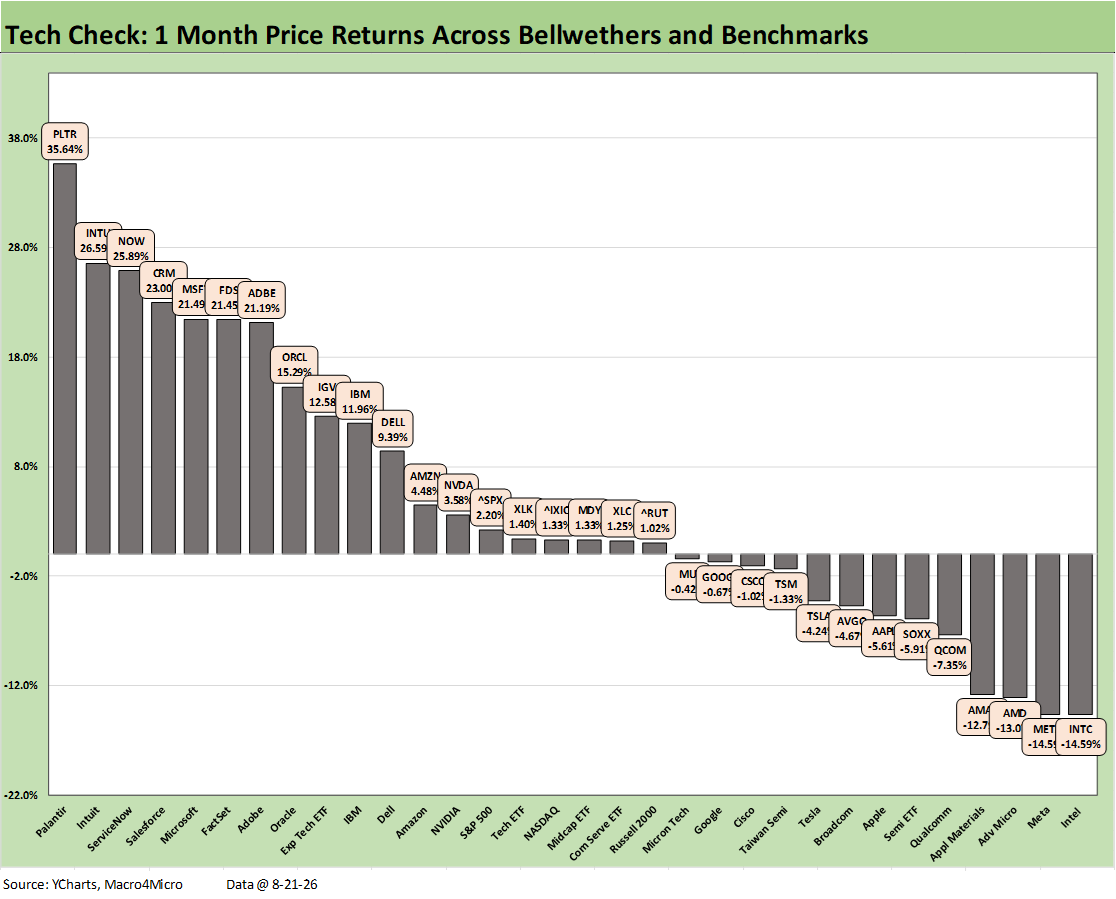
The 1-month tech check mix weighed in at 19-13 with a heavy mix of software and SaaS services in recovery mode on the left and a bad month for semiconductors on the right. The entire top quartile is software and/or SaaS services while 6 of the 8 in the bottom quartile were tied to the semiconductor chain.
It took +15.29% (ORCL) to make the top quartile and -4.67% (AVGO) to make the bottom quartile. Palantir (PLTR) generated a big comeback since its quarterly earnings report for a +35.64% 1-month return (+1.23% YTD). In contrast, Intel (INTC) has been taking a beating of late and saw a 1-month return of -14.59% (+144.1% YTD).
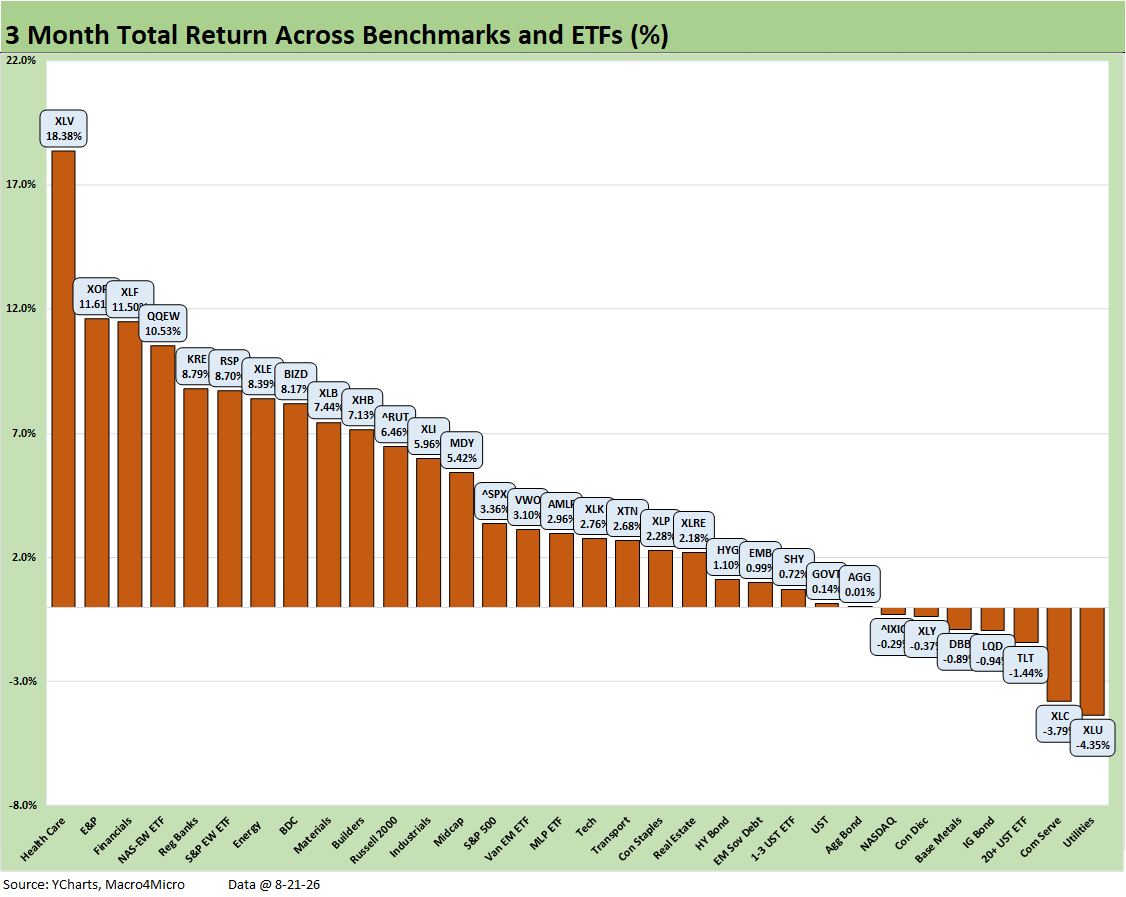
The 3-month return for the broader group of 32 benchmarks and ETFs shows the pharma sector blowing away the benchmarks at +18.4% for the Health Care ETF (XLV) as the outperformers were broad-based and very impressive.
In the top tier, we naturally see E&P (XOP) and Energy (XLE). Financials (XLF) and Regional Banks (KRE) were strong after a banner earnings season that also pulled the BDC ETF (BIZD) into the top tier on reassurance from earnings season and perhaps brought a less dire view of where asset quality was headed more broadly. We will see if Canada trade war setbacks reverse that sentiment.
The tech contribution to the top tier came from the Equal Weight NASDAQ 100 (QQEW) which made the top 5 and offered a broader mix of tech-related products and services. The same diversification angle applied to the Equal Weight S&P 500 (RSP).
The bottom quartile featured interest rate sensitivity with 3 bond ETFs and the dividend heavy Utilities ETF (XLU) while NASDAQ felt the sell-off in the big semi names and Communications Services (XLC) felt the weakness in Meta and Alphabet during this period.
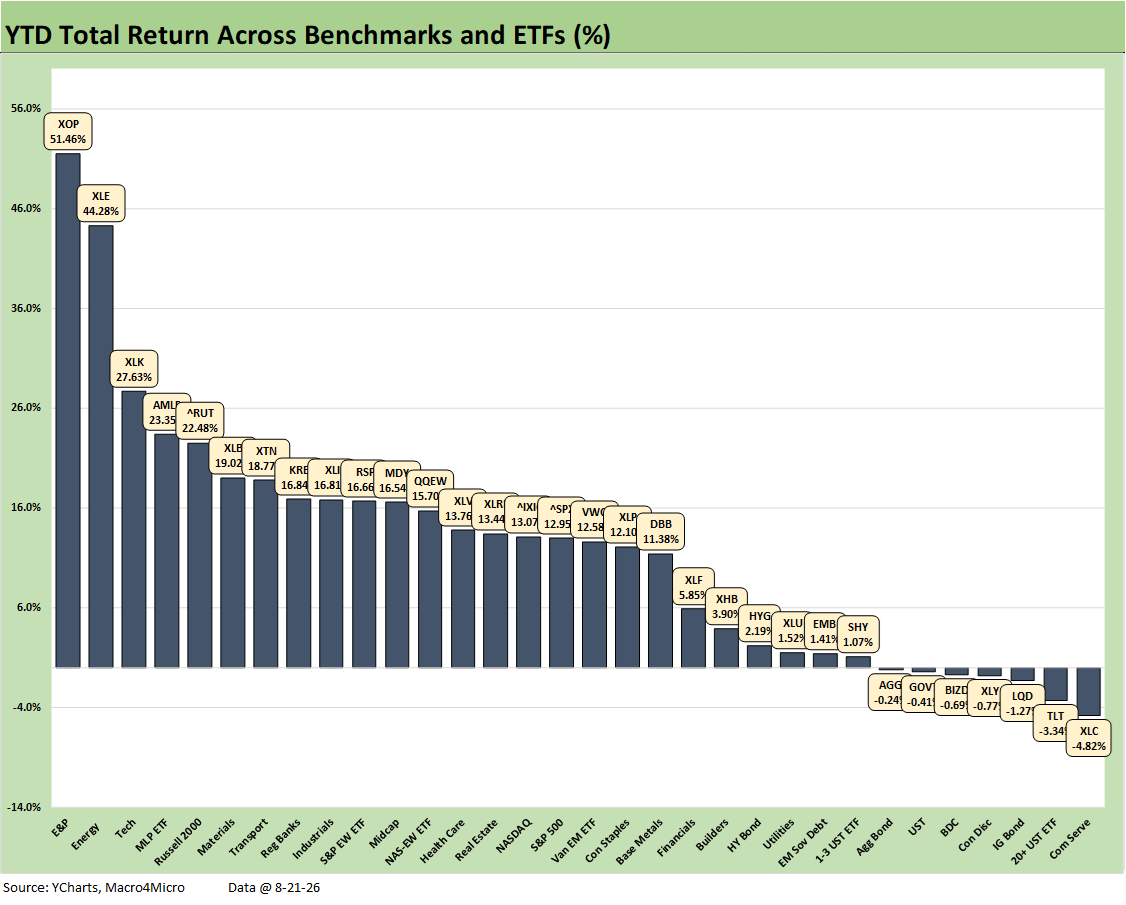
The YTD returns for the broader group of 32 posted a score of 25-7 with 4 of the 7 in the red being bond ETFs. Communications Services (XLC) was sitting on the bottom joined by Consumer Discretionary (XLY) and the BDCs (BIZD).
The fact that YTD BIZD returns was down under -0.7% is impressive given the headlines around private credit that set off a mild panic earlier in 2026. For the Consumer Discretionary ETF (XLY), the to-and-fro around the health of the consumer sector is a key variable. Among the poor performers in XLY were Tesla, McDonald’s and Lowe’s. There were also strong performers such as Starbucks (SBUX), Ross Stores (ROST), and Marriott (MAR).
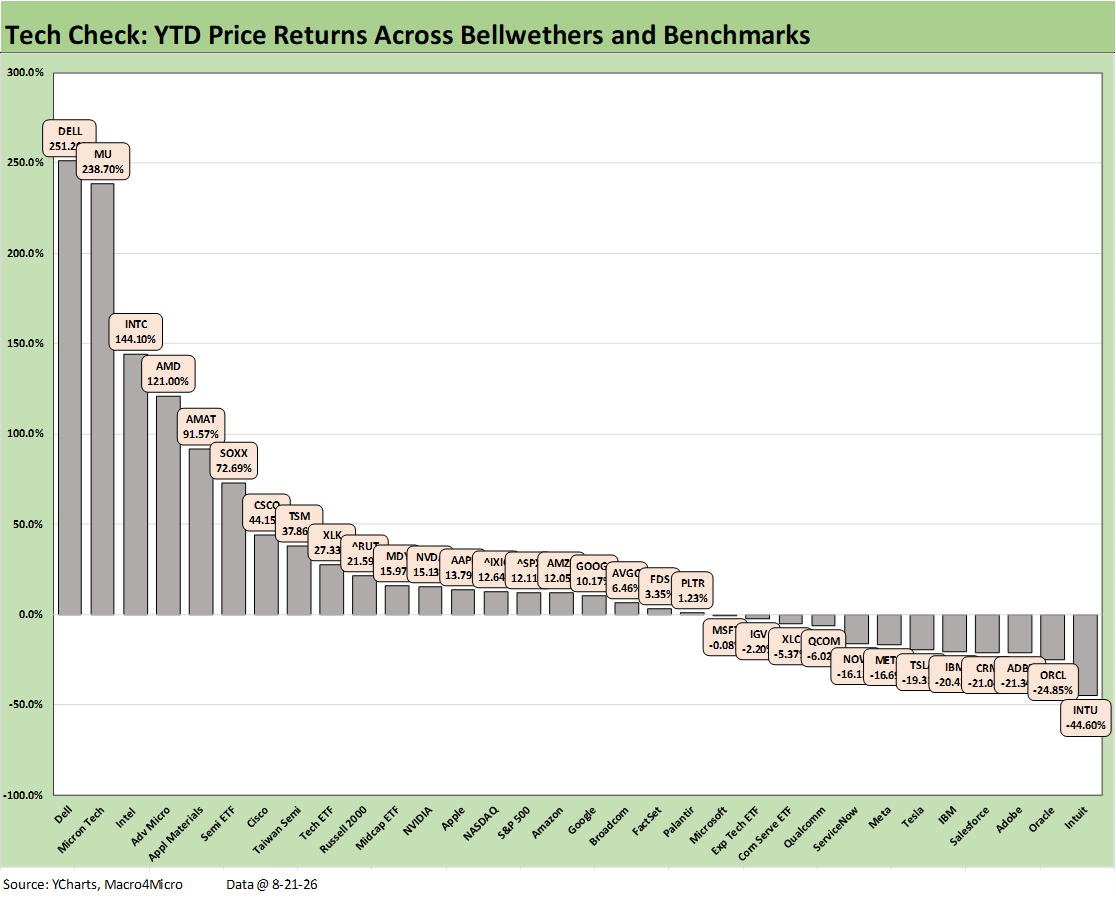
The YTD returns on the tech check mix still tells quite a story without capturing the wild swings on the names in the leaderboard from the semiconductor and AI ecosystem returns that we update each week.
The right side of the chart is dominated by the software and SaaS names that have been mounting a comeback of late as detailed in earlier charts. The bottom quartile starts at -16.1% with ServiceNow (NOW) and runs down to Intuit (INTU) at -44.6%.
The top quartile starts at +37.86% with Taiwan Semi (TSM) and runs up to #1 Dell as an AI and data center ecosystem play at +251.2%, ahead of #2 Micron (MU) as the lead semiconductor performer.
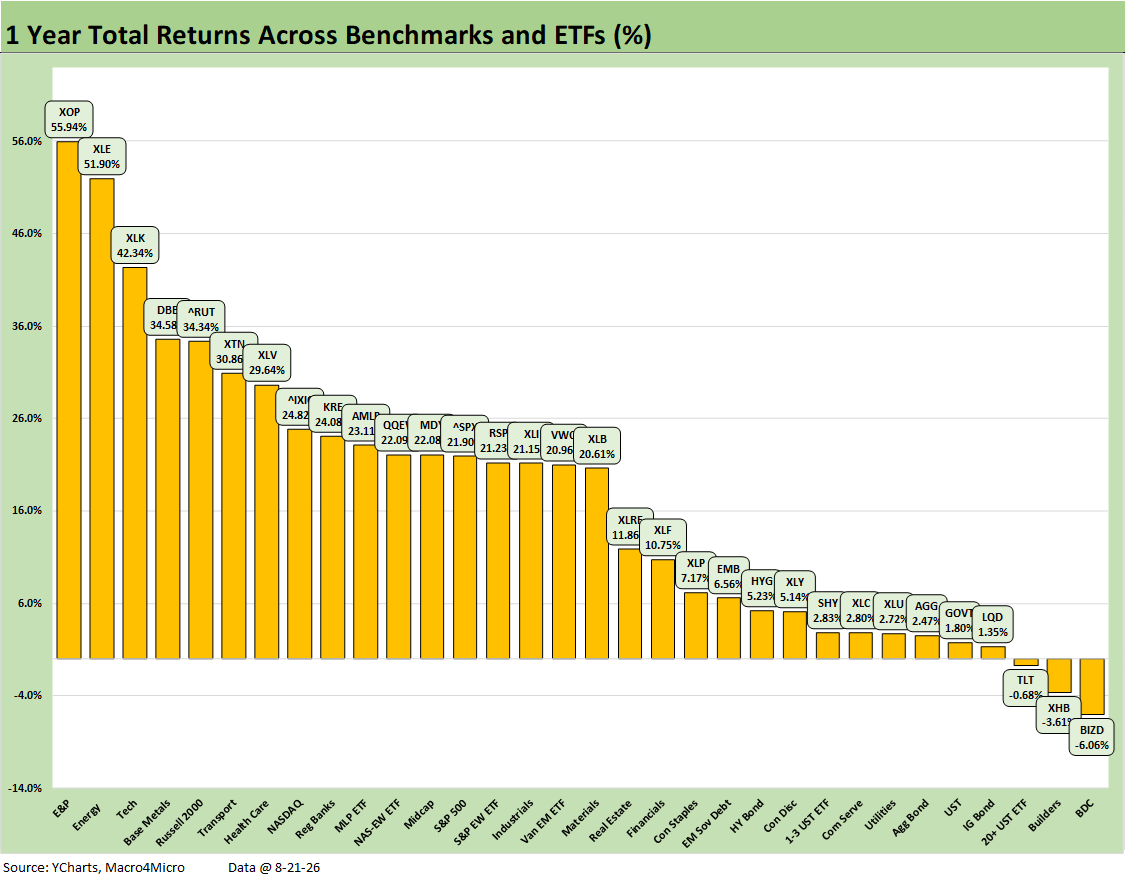
The trailing 1-year return posts a 29-3 score with BDCs in last place at -6.06% joined in the red zone by Homebuilders (XHB) at -3.61% and the long duration UST 20+Y ETF (TLT) at -0.68%.
It took 24.82% to make the top quartile (NASDAQ) and +2.80% (Communications Service, XLC) to make the bottom quartile.
The median return over the LTM period for this mix is +20.8% or over 2X the long-term return on equities.
Canada: all eyes on the next escalation…
Life could get very interesting this week. We include our background links on US-Canada trade and tariffs below. The need for details on “who said what and who did what when” will help shine some light on the behavior of those in the room. So far, the mainstream US media has been lame. The Canadian Broadcasting Corp (CBC) was very busy all weekend with a lot of information (and the Carney speech and Q&A live). We kept posting on Saturday and Sunday with links on our LinkedIn. Substack writers have been busy.
CBC stayed very active while CNBC was running its weekend infomercials. The New York Times gave an interview to Greer as trade rep, but they seemed to forget to ask questions. Greer left out quite a bit of what actually was dropped on the table at the 11th hour that blew it all up. The NYT did not do enough due diligence to get complete color.
Canada Tariff Commentaries:
US-Canada: Benches Ready to Clear 8-22-26
US-Canada Tariffs: Protection Racket 4-19-26
Canada-US Trade: Trump Attack N+1 1-25-26
US-Canada Trade: 35% Tariff Warning 7-11-25
Tariffs: Amazon and Canada Add to the Drama 4-29-25
Trade Exposure: US-Canada Import/Export Mix 2024 2-7-25
Aluminum and Steel Tariffs: The Target is Canada 2-10-25
US Trade with the World: Import and Export Mix 2-6-25
The Trade Picture: Facts to Respect, Topics to Ponder 2-6-25
Tariffs: Questions to Ponder, Part 1 2-2-25
US-Canada: Tariffs Now More than a Negotiating Tactic 1-9-25
Tariff: Target Updates – Canada 11-26-24
Trump, Trade, and Tariffs: Northern Exposure, Canada Risk 10-25-24
Trump at Economic Club of Chicago: Thoughts on Autos 10-17-24