


The faces of tech investing lately…
After a week where the UST curve and inflation moved in counterintuitive directions (inflation higher, UST lower) and tech equities going into a brief swoon, the moving parts are looking more chaotic with a brief VIX spike above 20.
The market is signaling some questions around risk appetites (including tech credit), asset allocation (flight to quality for some?), and potentially reviewing underlying assumptions in AI valuation. Inflation pressures remain a threat in a robust earnings season so the conditions are still not UST friendly.
The sharp rally in long UST came with a backdrop of materially adverse moves in inflation (PPI and CPI) with a $10 per bbl spike in crude across the $100 line. That should not be offering yield curve relief (see CPI Sept 2026: Does Chronic Inflation Need More Treatment 10-15-26, Macro Crosscurrents Rattle the UST Curve and Equity Valuations 10-15-26).
The FOMC threat appears to be easing even as a strong earnings season gets underway (see Weekly UST Deltas: Bear Macro but Bull UST Move 10-18-26, UST Curves and Cycles: Today in Historical Context 10-18-26). The odds of a hike in the Oct FOMC meeting are now down to 17.2% for 400-425 bps range and 80.0% for the Dec meeting. The odds of 425-450 bps are down to 16.4% from over 44% 1 month ago.
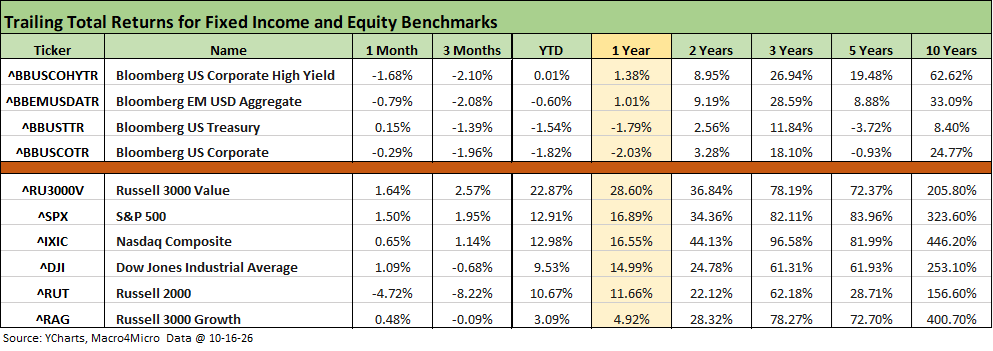
The above table updates the time horizon returns for the debt and equity benchmarks we monitor. In contrast to last week with all negative for the month, we saw 1 of 4 fixed income lines edge back into positive range with the rally in the UST curve. For 3-months, the fixed income benchmarks are all still in the red. For the YTD period, only HY barely made positive range. Duration has been the enemy.
For equities, Russell 2000 remains under siege for 1-month and 3-months after a very good start to the year. Equity returns have been getting dialed back, but the YTD period remains very solid with the exception of the Russell 3000 Growth index. Russell 3000 value has been the winner.
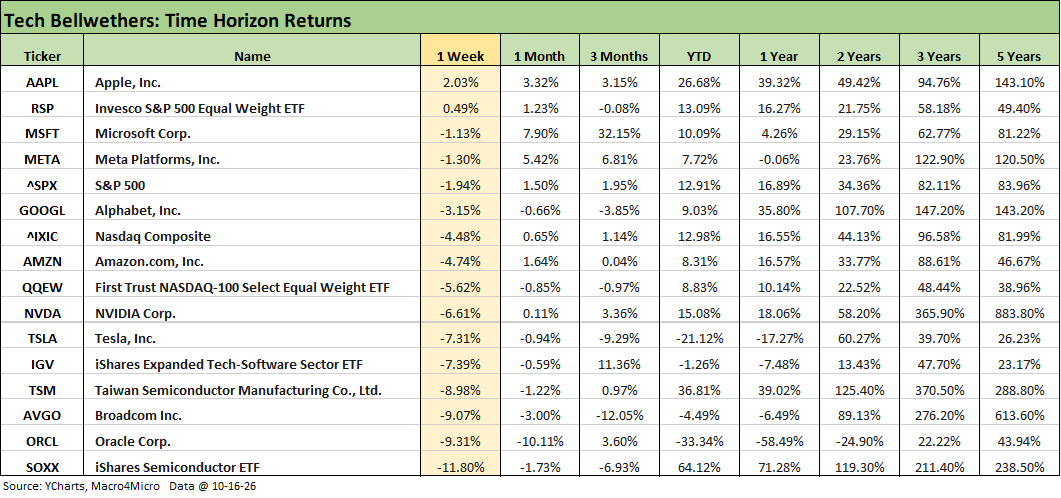
For the tech bellwether table, the week only saw two asset lines in positive range with Apple and the Equal Weight S&P 500 ETF (RSP). The Mag 7 saw 6 of 7 in negative range with only Apple (AAPL) in positive return range. The Semiconductor ETF (SOXX) was punished at -11.8% and sits in last place and is negative for the 1-month and 3-month horizon even as it generated a dazzling + 64.1% YTD.
The Software ETF (IGV) beat SOXX this week with the Semiconductor sector slammed. We cover the tech pain in other charts in this commentary. For the YTD period, IGV has posted a total return of -1.26% vs. +64.1% for SOXX. The worst YTD performer on the list is Oracle (ORCL) at -33.3%.
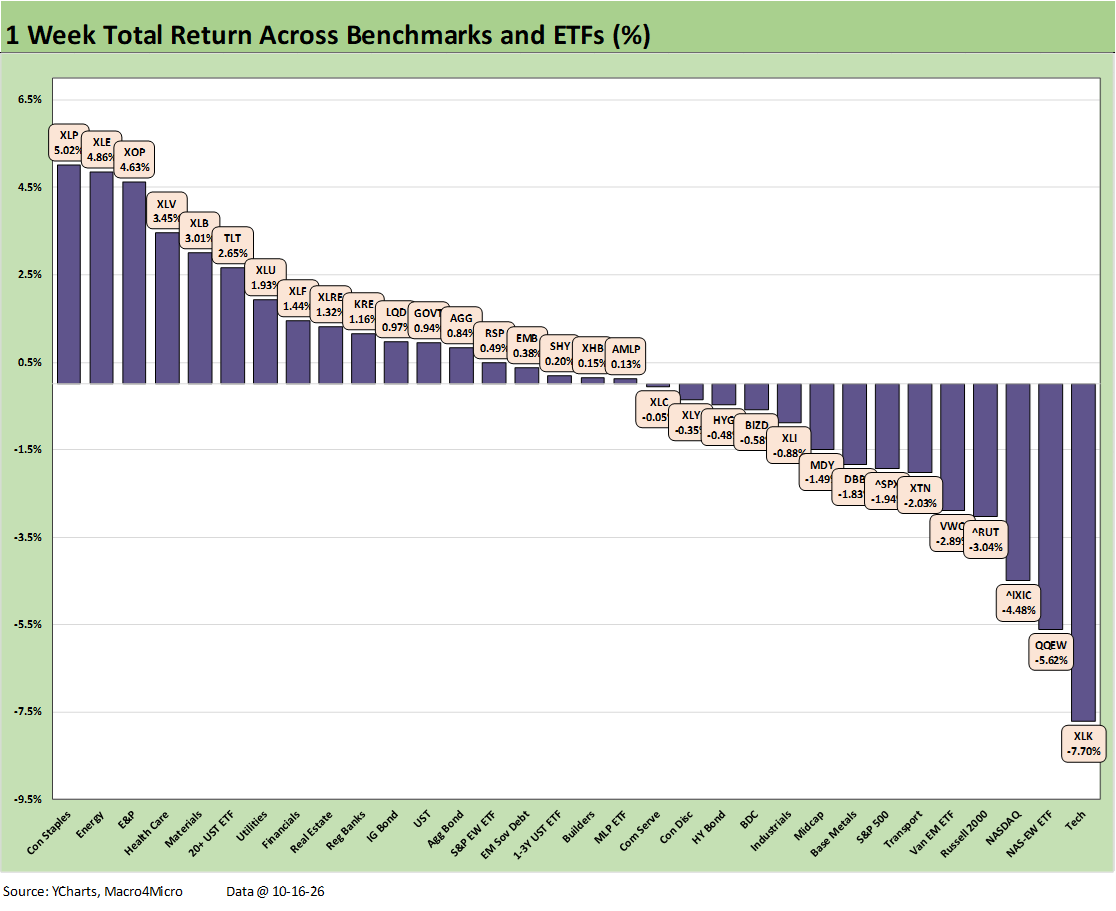
We already addressed the 1-week return details in Weekly Returns: Benchmarks and ETFs (10-18-26). The 18-14 score showed the effects of tech beatdown on the right with a solid performance in higher quality dividend stocks, upstream energy, and bond ETFs on the UST rally.
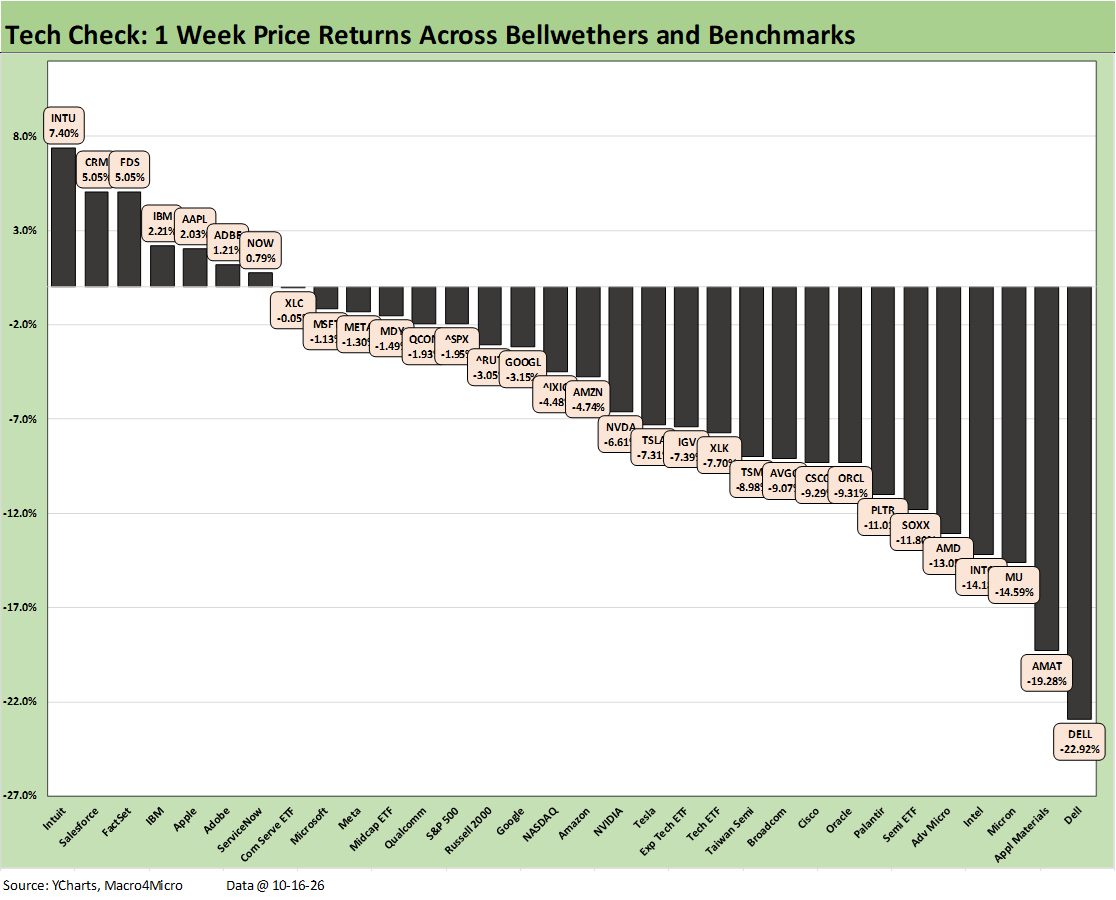
We already covered the Tech Check performance in Weekly Asset Returns: Tech Check (10-18-26). The Tech Check mix turned in a horrid set of numbers with a score of 7-25 and some painfully bad returns in the semiconductor and AI ecosystem names (notably Dell).
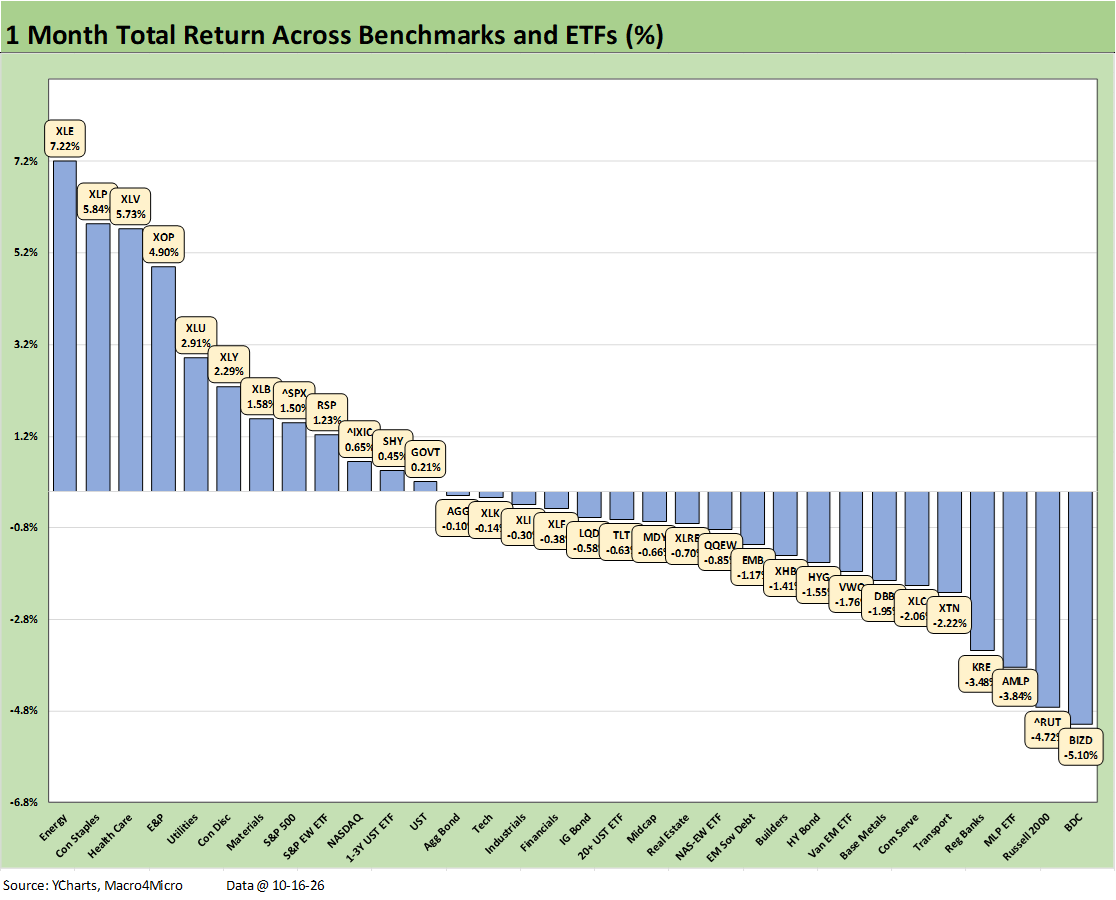
The 12-20 score for the 1-month returns for the broader mix of 32 asset lines were hurt by 5 of 7 bond ETFs being in negative range. Refined product prices hit costs for Transports (XTN) while the BDC ETF (BIZD) and small cap Russell 2000 sat at the tail end of the bottom quartile with Regional Banks (KRE) also feeling pressure with a big earnings wave on tap from here.
Winners for the month include higher quality dividend stocks as some investors rotated to more defensive exposure. Higher quality dividend stocks are usually rewarded when longer UST rates decline. The top 5 included Consumer Staples (XLP) and Utilities (XLU) along with pharma and dividend heavy Health Care (XLV). Those joined Energy (XLE) and E&P (XOP) in the top 5.
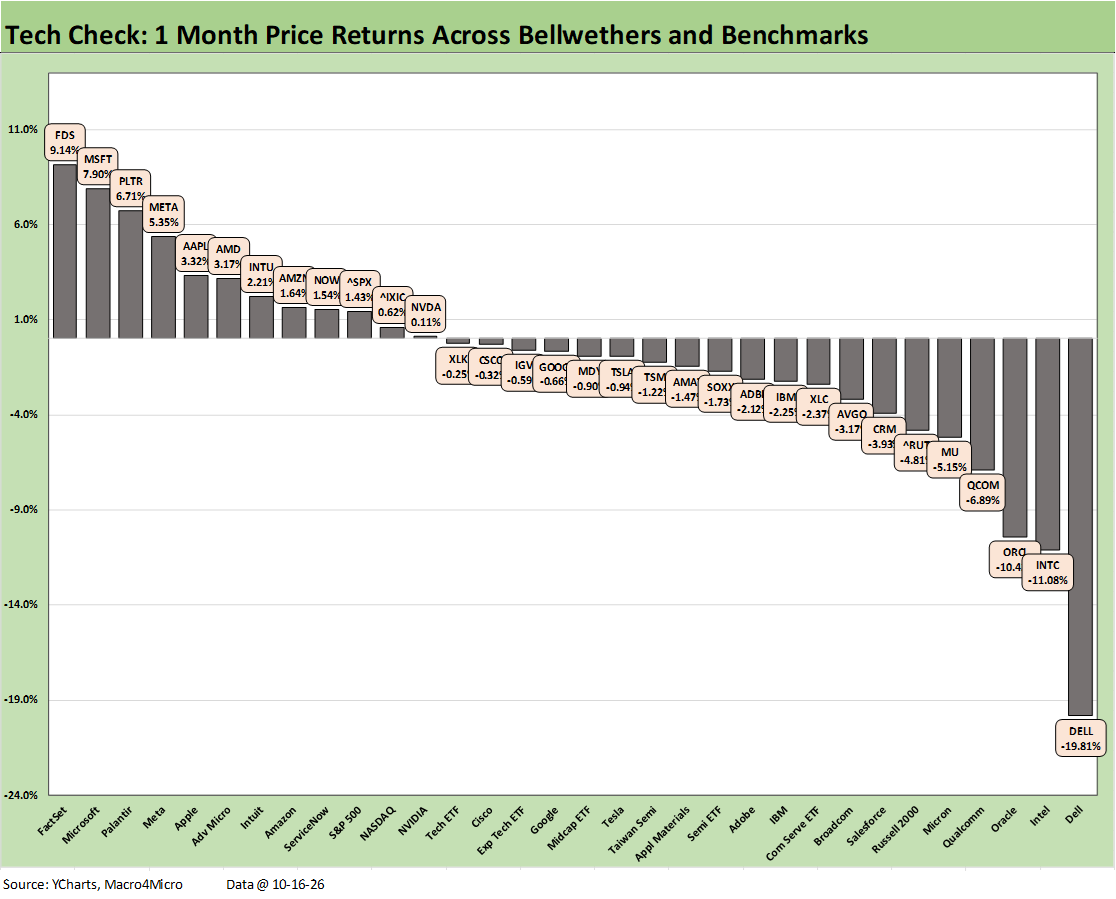
The Tech Check mix had a rough month at a score of 12-20 as AI ecosystem and semi names broadly took a beating after the strong numbers generated across 1H26. We see Dell at -19.8% in dead last in the bottom tier joined by Intel (INTC), Qualcomm (QCOM), Micron (MU), and Broadcom (AVGO). From the software/systems side, we see Oracle (ORCL) and Salesforce (CRM) in the bottom quartile.
The Mag 7 shows 4 in the top quartile (MSFT, META, AAPL, and AMZN) with 2 in the 2nd quartile (NVDA, GOOGL) and 1 in the 3rd quartile (TSLA). The top quartile also includes some of the beaten-down software and SaaS names making a slow comeback including FactSet (FDS) at #1, Microsoft (MSFT) at #2, Palantir (PLTR) at #3 with META and AAPL rounding out the top 5.
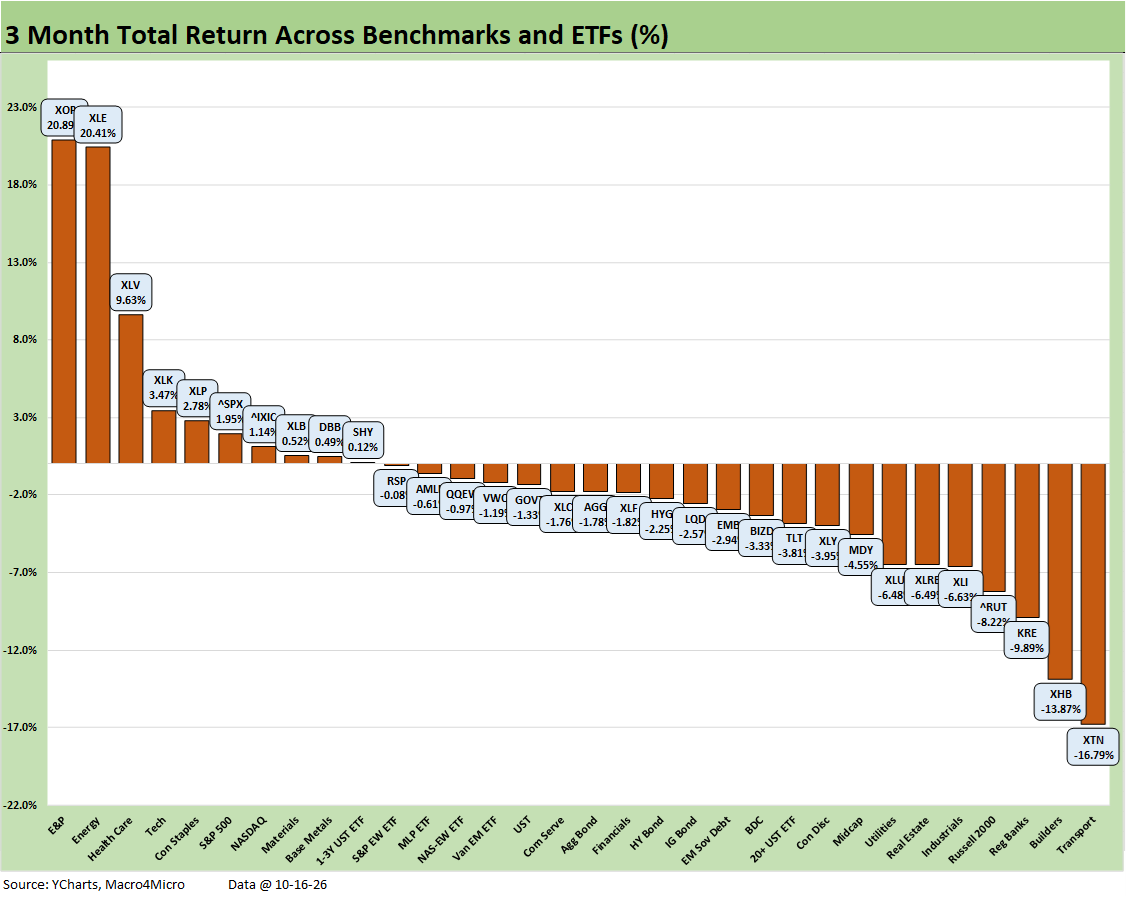
The 3-month returns for the broader asset mix weighed in at only 10-22, so the summer and early fall setbacks were taking their toll despite solid 2Q26 earnings and decent expectations for 3Q26. The impact of oil-driven cost pressures was evident in Transports (XTN) ranking in last place. The UST curve pain hit Real Estate (XLRE).
The UST curve sent 6 of 7 bond ETFs into negative return range. Mortgage pressures have sent Homebuilders (XHB) into the red zone as monthly payment and affordability pressures weighed on performance along with some labor shortages in select cases and supplier chain costs tied to tariffs.
For the winners, oil prices brought good news for some with E&P (XOP) and Energy (XLE) at #1 and #2. Defensive sectors such as Health Care (XLV) and Consumer Staples (XLP) were in the mix with tech still posting decent enough numbers to get the Tech ETF (XLK), NASDAQ and the S&P 500 in the top tier. Materials ETF (XLB) was still riding the advantage of higher petrochemical prices combined with lower natural gas feedstock costs for the US names.
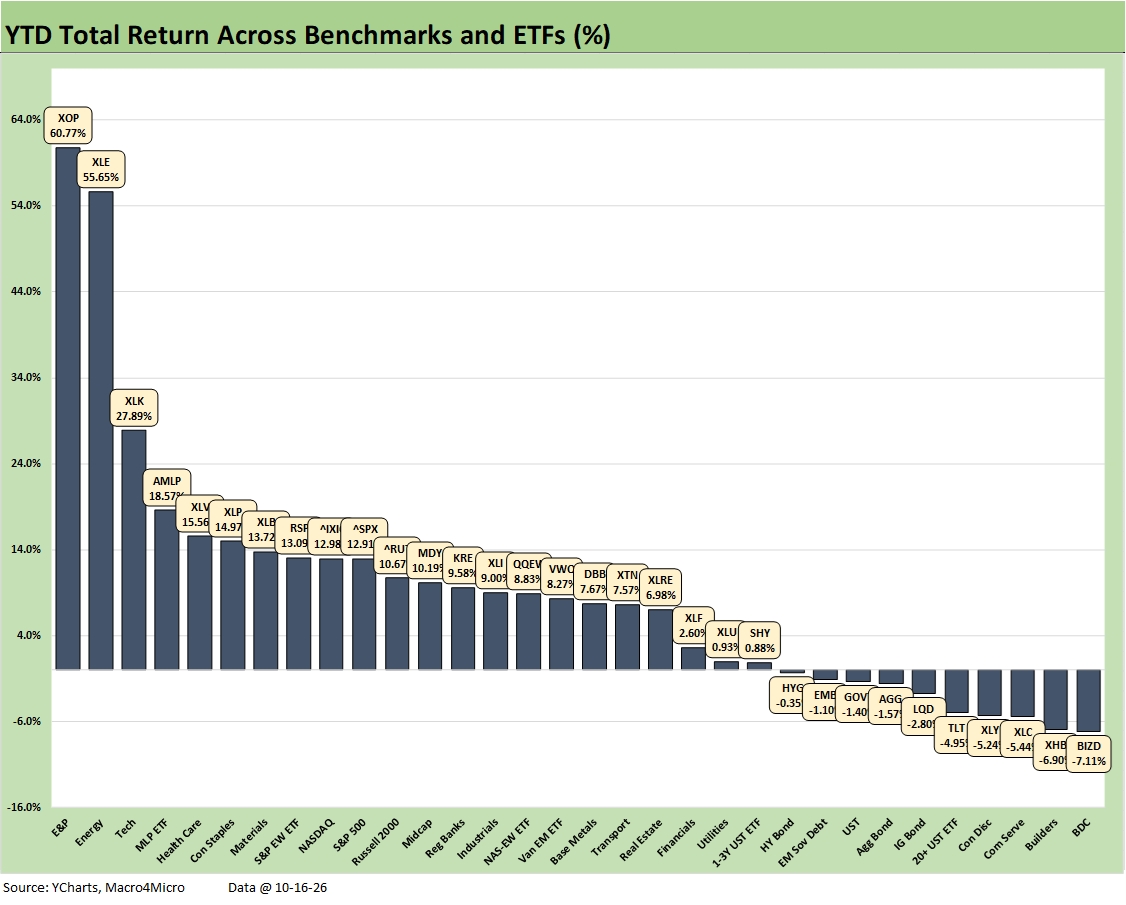
The YTD returns for the broader group of 32 asset lines still show good overall numbers at 22-10 given the great start to the year for many. That still leaves 6 of 7 bond ETFs in the red on the adverse UST shift. The long duration UST 20+Y ETF (TLT) was 1 of the 4 bond ETFs in the bottom quartile along with IG Corporates (LQD), the Aggregate bond index (AGG), and the UST index (GOVT). The BDC ETF (BIZD) is still feeling the YTD weight of the bad “private credit” headlines and fears around quality of the deal flow in what is a space that grew too quickly for quality comfort.
The biggest winners rode the Iran effects on oil and gas with E&P (XOP) and Energy (XLE) far ahead of the other top quartile names with the Midstream ETF (AMLP) at #4. We see the Tech ETF (XLK) and Health Care (XLV) rounding out the top 5.
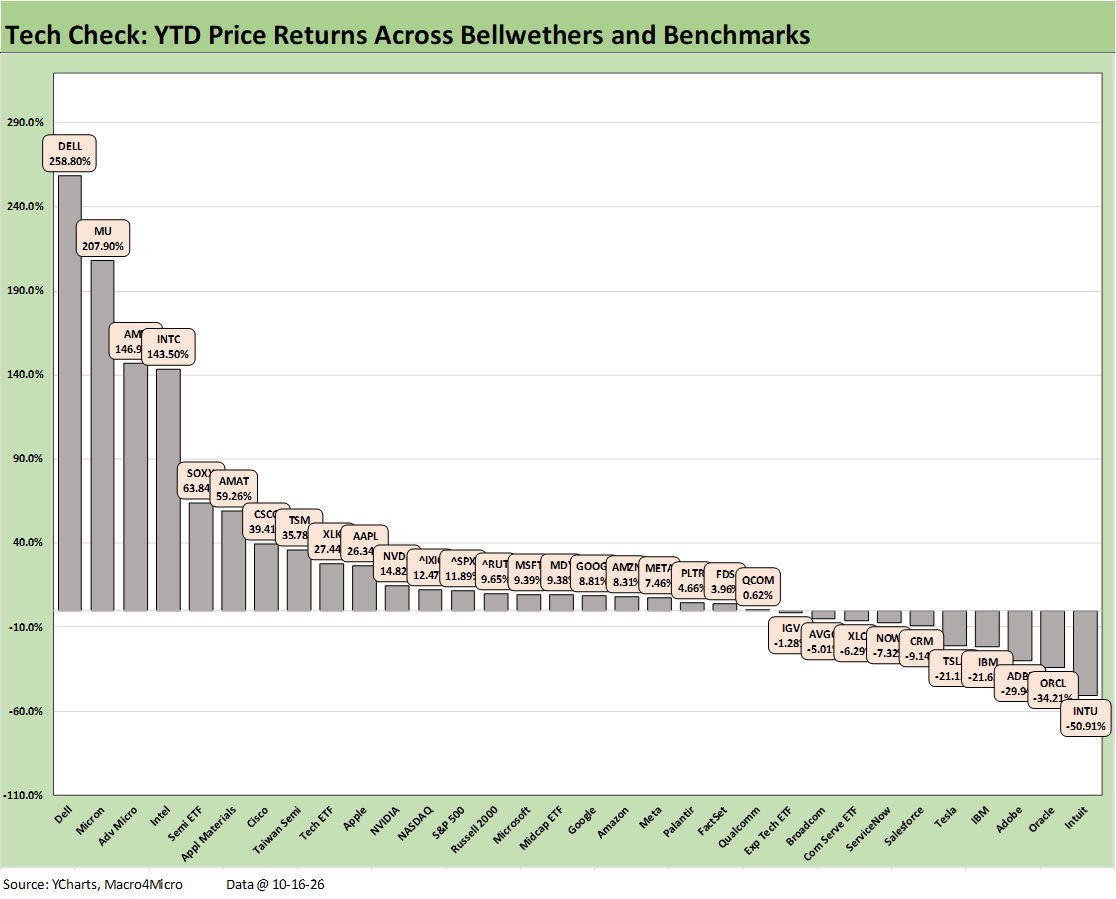
The “year of AI” has generated some big return moves (both high and low) as detailed in the YTD return for the Tech Check list above. We have detailed the dramatic moves along the way with the semiconductor and AI ecosystem numbers still defying adjectives YTD even after the recent pain. Dell at +258.8% leaves a lot of room for a week like this past one at almost -23% for Dell. For the YTD list, it took just under a 36% return (Taiwan Semi) to make the top quartile. It took 143.5% (Intel) to make the top 4.
The bottom quartile has continued to be dominated by the software and SaaS-based names that were slammed in the AI displacement wave (“SaaS-pocalypse”). The usual suspects dominate the bottom quartile. We also see the Communication Services ETF (XLC), Tesla (TSLA), and IBM in the bottom tier. Oracle is in 2nd to last.
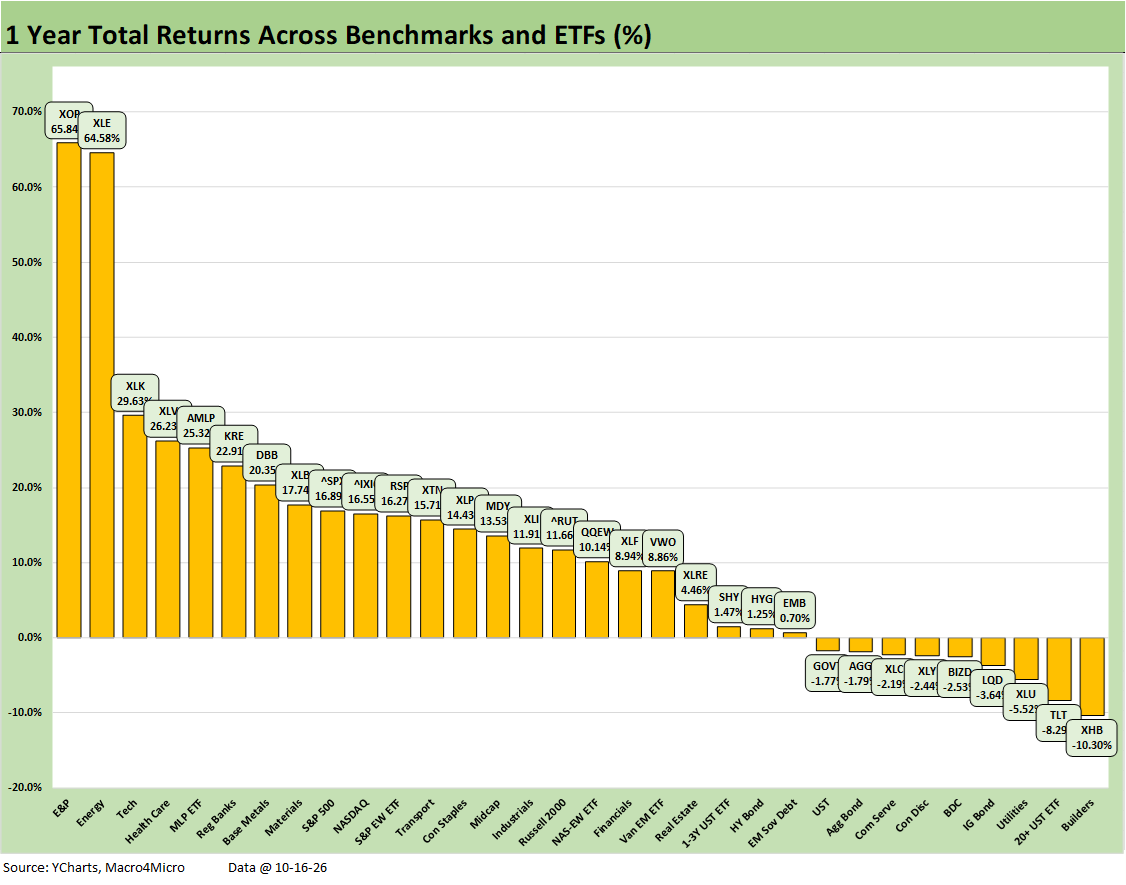
The LTM returns at 22-10 show the slow and steady increase in the number of negative LTM returns from a low single-digit asset count to double digit in recent months. The list was 31-1 at the end of June with only the BDC ETF (BIZD) in the red at that point at -13.5%. BIZD has now improved to only being down -2.5%. We see 4 of the 7 bond ETFs in the red for the LTM period. We see positive returns for the short duration 1-3Y UST ETF (SHY), HY (HYG), and EM Sovereign Bond ETF (EMB).
See also:
Weekly Returns: Benchmarks and ETFs 10-18-26
Weekly Asset Returns: Tech Check 10-18-26
Weekly UST Deltas: Bear Macro but Bull UST Move 10-18-26
UST Curves and Cycles: Today in Historical Context 10-18-26
Industrial Production Sept 2026: Capacity Utilization 10-17-26
CPI Sept 2026: Does Chronic Inflation Need More Treatment 10-15-26
Macro Crosscurrents Rattle the UST Curve and Equity Valuations 10-15-26
Mortgage Creep Continues, Curve Shapeshifting Uncertain 10-4-26
Mortgage Rates vs. UST Curves: Spooky Memories to Ponder 9-20-26