

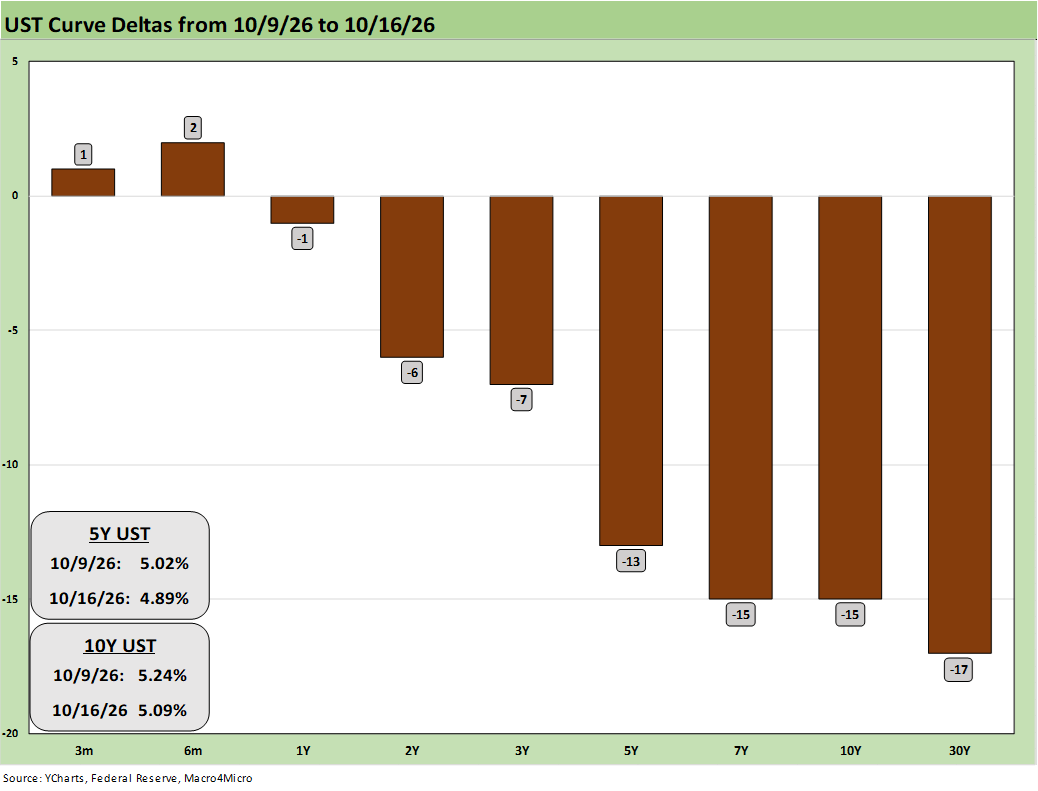
The chart updates the Friday-to-Friday UST deltas in a week that saw a WTI spike and worrisome inflation numbers that nonetheless delivered a bull flattener. That UST rally from 2Y to 30Y came despite unfavorable CPI and PPI releases ( CPI Sept 2026: Does Chronic Inflation Need More Treatment 10-15-26, Macro Crosscurrents Rattle the UST Curve and Equity Valuations 10-15-26).
The lower rates also came with major escalations in the Mideast that took WTI $10 higher to around $101 per bbl by Friday in a move that would typically wag the long end to move higher. Map that move against steep selloffs across the “hot sectors” of tech and the AI exposures, and the plot thickens. The markets saw volatility rising and VIX pushing above 20, in turn generating rumors of hedge fund blowups.
The FedWatch scorecard has calmed down on FOMC risk. The odds of an October tightening to 400-425 bps is down to 17.2% as we go to print vs. 57.6% 1 month ago. The odds of a December 400-425 bps range are now 75.7%. The probability of 425-450 range in December is down to 15.3% from over 44% one month ago.
Credit market concerns are starting to make the headlines with a record amount of AI related securities (direct and indirect) for the OTC markets to deal with for those who seek secondary liquidity. High counterparty risk exposure as broadly defined including collateral concentrations will attract regulatory attention for reserve adequacy in the lender base.
Whenever the patterns move sharply and deviate from recent history (e.g. UST moving lower in the face of materially higher oil and bad news on inflation), the risk of leveraged bets going bad can set off reverberating effects and rumors (the hedge fund blowups, etc.). The coming weeks will be seeing more market risk topics making news.