
Footnotes & Flashbacks: State of Yields 9-10-23
We look at the yield curve dynamics after a mixed few weeks of moving parts.


We recap the recent state of yields and UST shifts as duration kept bonds on the losing side across the slower markets of the August dog daze and Labor Day stretch.
The macro and fundamental news flow has been balancing out to a general sense of calm on Fed action and inflation expectations with more sets of eyes now cast on oil markets and China than the Sept FOMC meeting.
The fall season will remain busy with cyclical debates and curve handicapping with more street brand names pushing out recession scenarios or going all the way to making the call for “no landing.”
We update the latest UST slope shapeshifting on 3M to 5Y UST, 2Y to 10Y, and 2Y to 30Y as the inversion slowly grinds in the direction of a bear flattening (via directional steepening!?) and a lower inversion profile.

The above chart updates the timeline of the Duration House of Pain the market has been locked in since inflation took over the story in late 2021 and ZIRP ended in March 2022. The trend is not new even if doing much less damage than what was inflicted on investors in late 2022 (see House of Pain: Markets Jump Around 10-13-22).
The UST curve has struggled to reward bondholders and relief has been limited for those who were happy to see some opportunities to execute a more prudent allocation to bonds with UST or in credit. Those who moved early will not likely regret it longer term, but the bond asset returns have been anything but supportive of the early move out the curve in 2023. We look at relative asset returns in a separate publication, but bond benchmarks and fixed income ETF proxies have been consistently weak performers across multiple time horizons.
The battle around higher-yielding returns on cash vs. repriced yields out the UST curve still comes with an asterisk around legacy corporate bonds with low coupons and steep dollar price discounts. Sub-coupon returns are not a great memory to this point in 2023. The cash earnings and 5% handle annualized returns in rolling T Bills has turned into a “no guts, no glory trade,” but that strategy happens to come with positive returns.
The cash-heavy allocation comes with less worry for some until more of the key moving parts get sorted out around the trade-off of interest rate risk vs credit risk. The duration setbacks have run alongside compressed spreads just to keep life challenging (see Credit Spreads: Proportions Matter in Risk Compensation 8-14-23, Market Commentary: BBB vs. BB Quality Spreads Revisited 8-21-23, Market Commentary: The B to CCC Adventure 8-22-23).
The compensation for taking risk can be looked at in the context of total risk premiums (OAS) or framed as spreads as a % of the risk-free alternative. Neither frame of reference has been looking too good. The conceptual angle is that the underlying driver of what would rally the UST curve (economic weakness, fundamental industry pressure, etc.) would also drive negative excess return impacts.
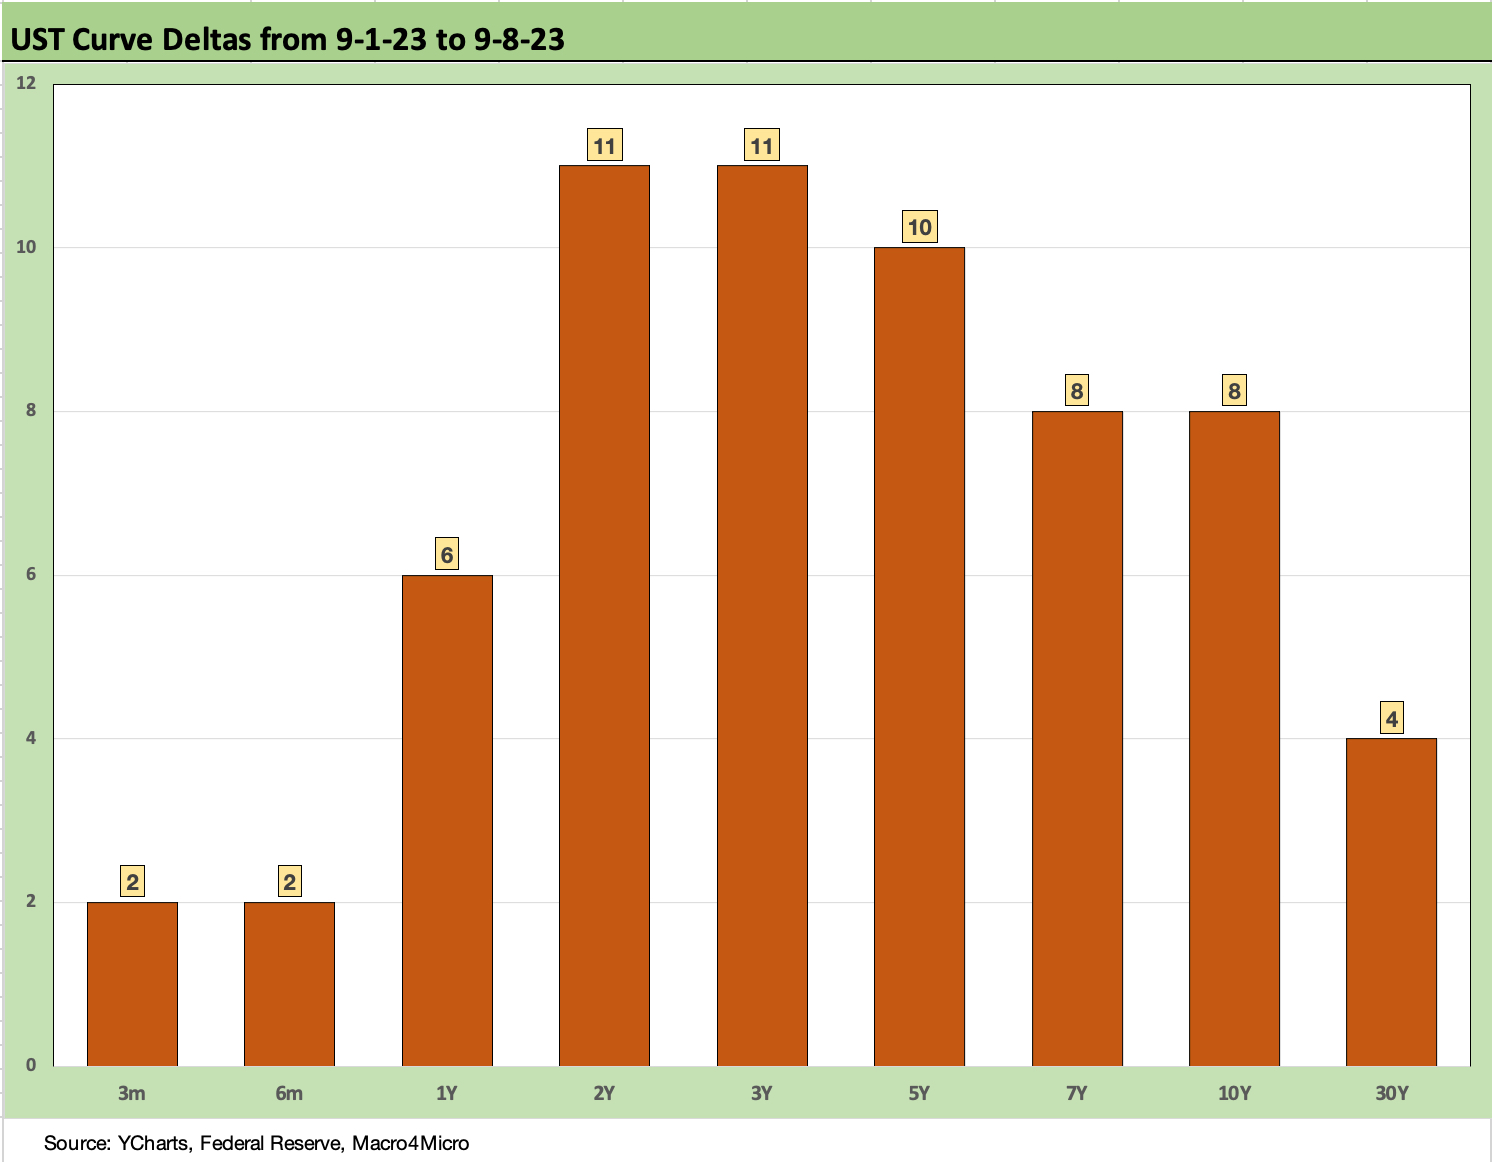
The above chart updates the UST curve deltas for the past week after August already weighed in with negative returns on a range of bond and fixed income proxies in ETFs. We see an upward shift across the UST curve with a slightly more pronounced move in 2Y to 5Y. This follows the more muted running moves over the second half of August into the early days of Sept that we break out below.

The above chart rolls forward where the UST curve shifted since our last “Footnotes” publication (see Footnotes Flashbacks: Asset Returns 8-20-23). We add this chart to bring us up to date on how August played out after a flurry of headlines (Powell, Jobs, PCE inflation) saw modest overall price action for the running period. The markets still saw the month of August end with weak returns for fixed income on the month.

The above chart updates the post-SVB timeline when regional banks melted down (using March 8 as the last “clean” pre-crisis trading day). The bear steepener remains very much in evidence in the 5Y to 30Y segment of the curve while the short end pushed higher on Fed action. The UST curve migration managed to inflict more pain on interest margins in the bank and finance sector. The chart still shows the 2Y and 3Y UST slightly lower, but the shift into bonds further out the curve was not a short term winner.
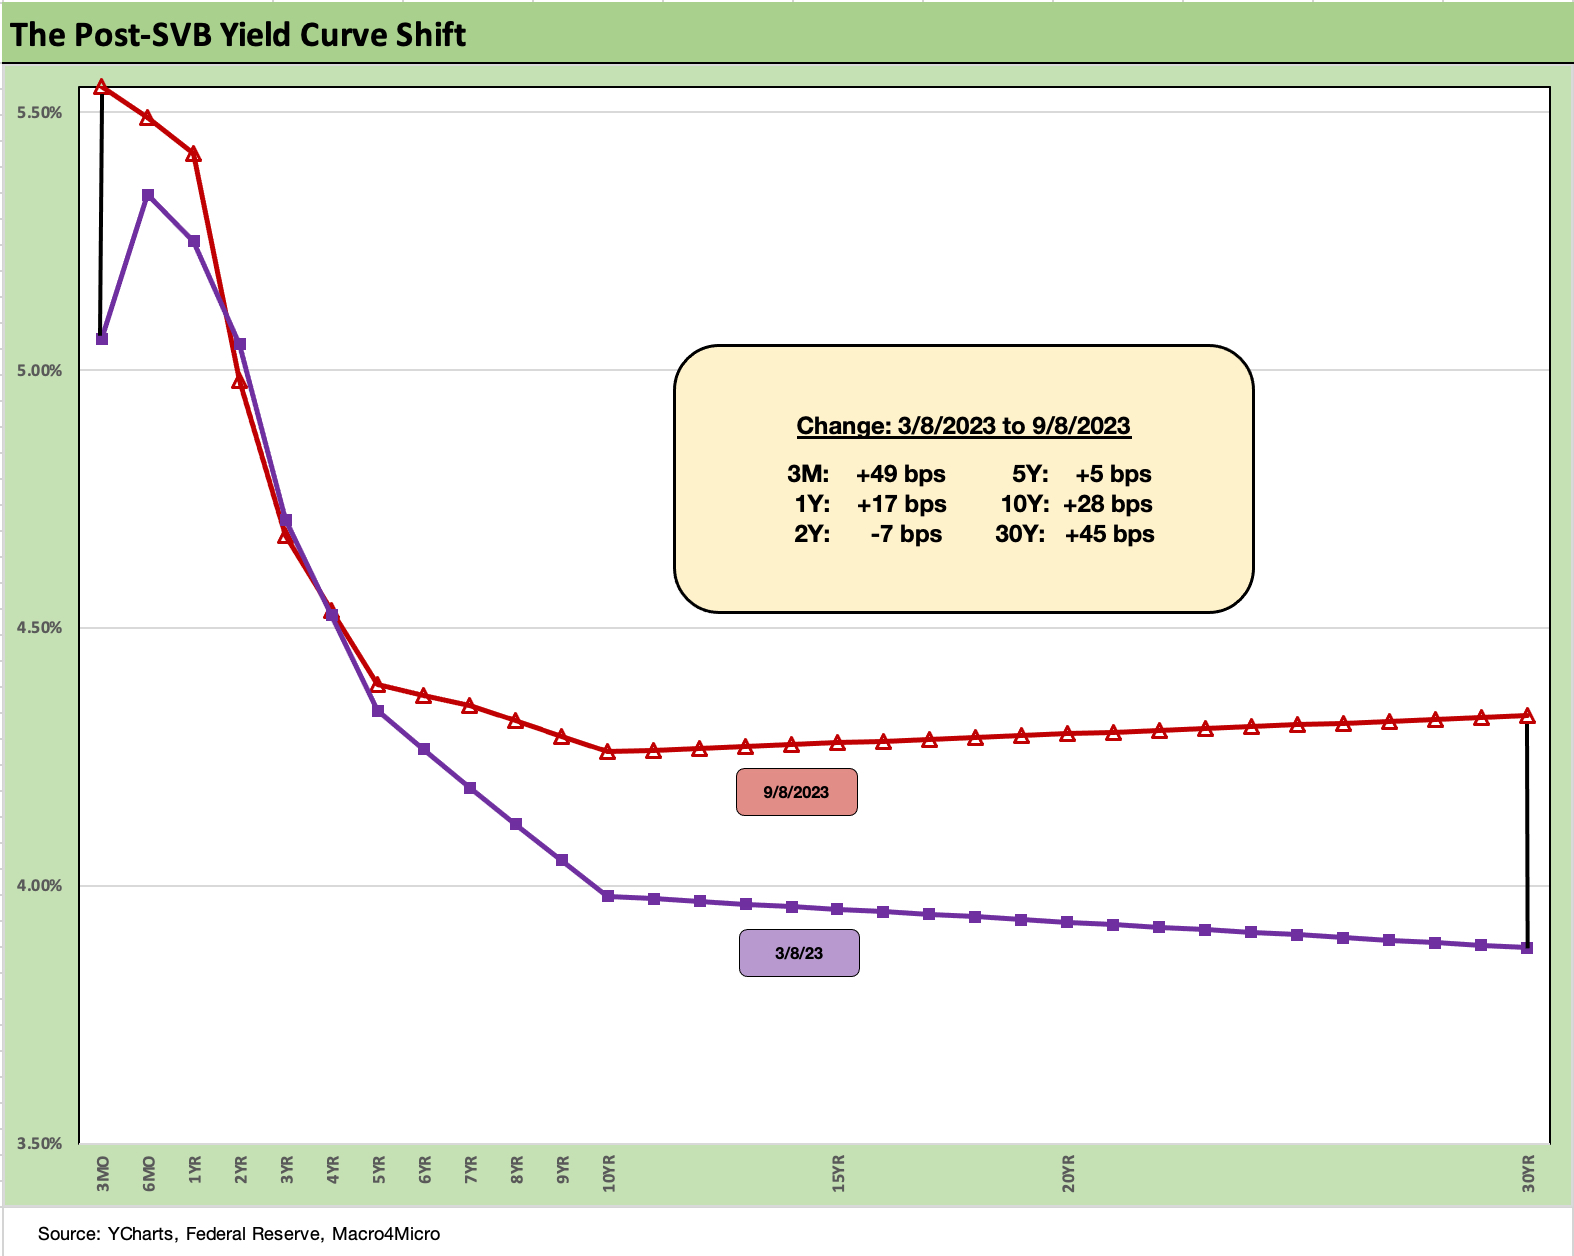
The above chart updates the UST yield curve visual for the post-SVB curve deltas. The upward UST shift is clear enough from short-to-long dated segments of the curve while a steepening past 10Y UST is easy enough to see. The Fed tightening cycle and front-end inversion was a bit more chaotic.

The world of mortgages has been grabbing even more headlines of late with the market seeing more consistent 7% handle mortgage rates after the year had seen more than a 100 bps swing. The comparison of the housing bubble years of 2005 and 2006 in the chart really hammers home the effects of wide mortgage spreads in today’s market relative to where the UST curve and mortgages framed out across the 2005-2006 periods.
The housing market fallout has been bad for existing home sales volumes but has benefited the relative share of total home sales gained by homebuilders as we have covered in past commentaries (see New Home Sales: Low Bar for Comps YoY, Sequentially Mixed 7-26-23). The performance of the builders in this 7% mortgage market has been a major reeducation project on the dynamics of supply-demand in residential housing. The results underscore the builders have a lot of tools at their disposal to exploit the existing home inventory dislocation.
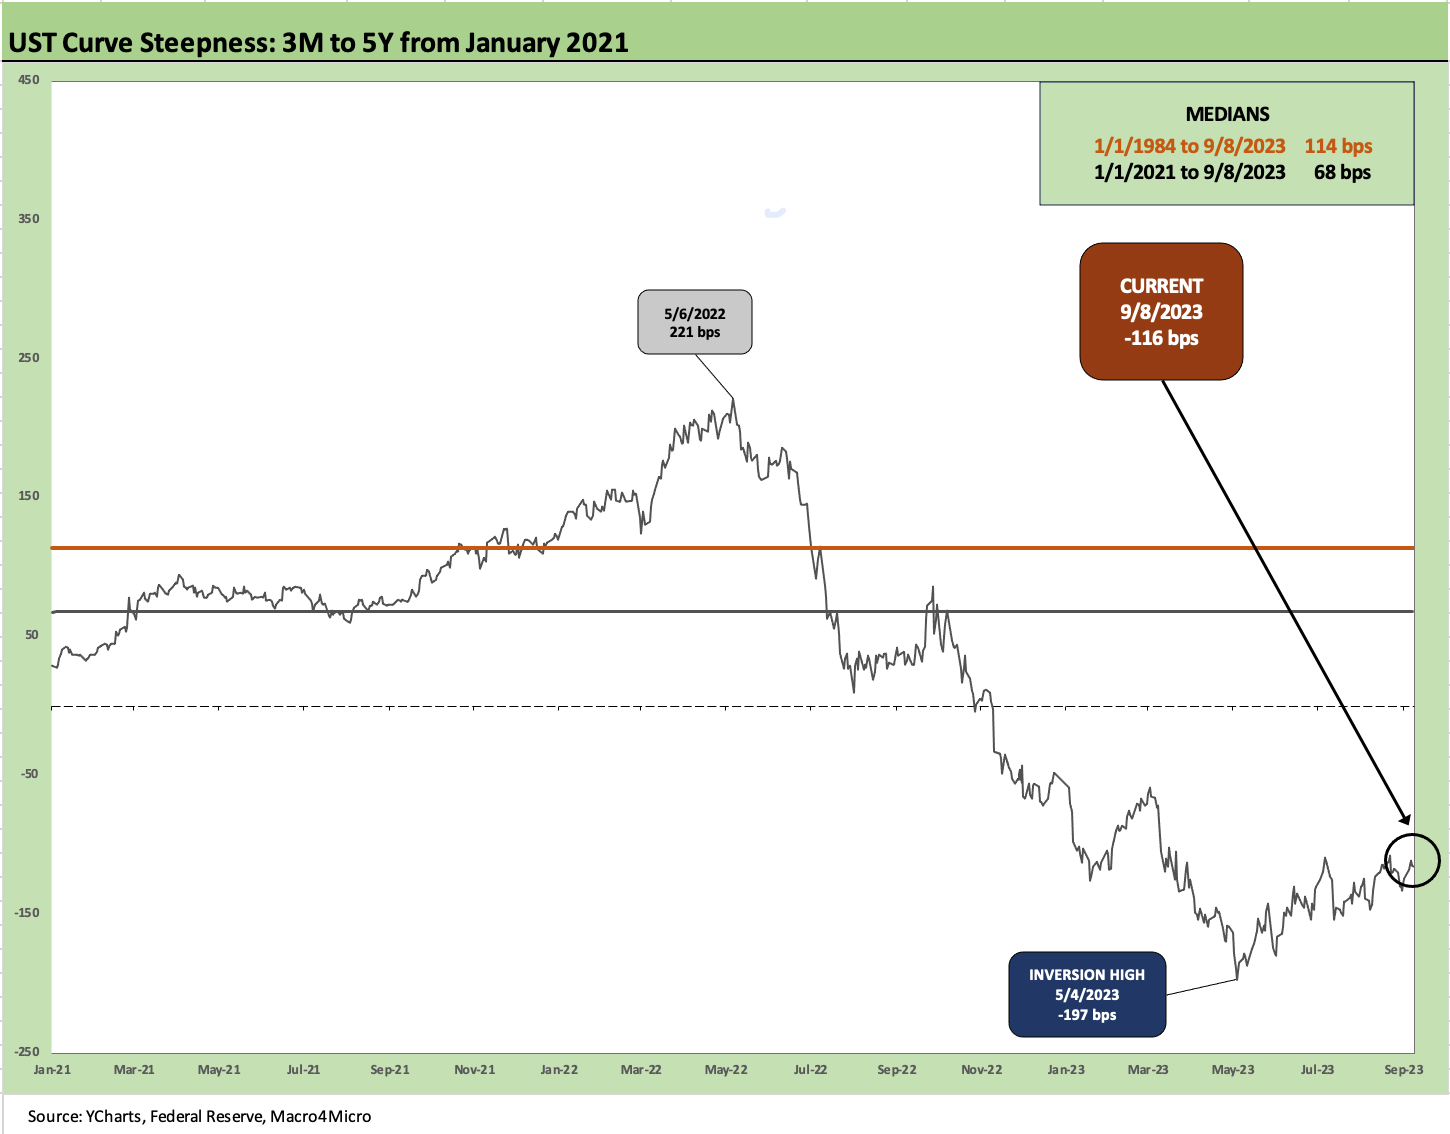
The above chart updates the recent 3M to 5Y UST inversion as the peak inversion of -197 bps in early May has been dialed back to -116 bps to end the week. We use the short timeline from the start of 2021 to give a better visual on the granularity of the moves from the onset of inflationary pressure hitting the long end in 2021 and ensuing steepening, then through the end of ZIRP and aggressive tightening by the Fed sending the UST curve into a sharp inversion.
The chart shows the median slope across the short term from 2021 (+68 bps) and the longer-term timeline from 1984 (+114 bps). We have been intermittently reviewing 3M to 5Y UST slope and related histories since last fall (see The Cash Question: 3M-5Y Yield and Slope 10-19-22, UST Curves: Slope Matters 10-25-22). The cash yields have been a major factor in the market feeling less compelled to chase risk.
The battle over whether a high cash asset allocation strategy makes you “a saver and not an investor” is silly since it ignores the history of time horizons and seeking to maximize the portfolio returns over investment horizons that can vary widely. Like risk appetites, time horizons run the gamut. Clipping 5% and avoiding downside symmetry necessarily can entail applying a number of factors whether risk appetites, a view on the near-term symmetry of those risks, and perhaps a plan to exploit potential dislocations later.
The 5% yield number on bills changed the rules of the game after a protracted post-crisis period of ZIRP and depressed bond yields. We recall 5% CCC tier bond deals. Some investor parked in cash might be waiting to pile into credit during a period of maximum pressure whether that pressure comes via market pricing and redemption waves or in a cyclical downturn or event-driven shock.
The move into cash can imply a view on where spreads and risk pricing is now, and making the call to wait until spreads are much wider in credit or equity valuations are in the tank. The cash allocation can also imply a sense of utter confusion, and that makes cash a nice place to sort out the moving parts. It can be a view where 5% cash can ease one’s pain if the market rallies more notably and you miss that leg. That would be hard to see in credit from current spread levels, but a big miss is always a possibility in equities.
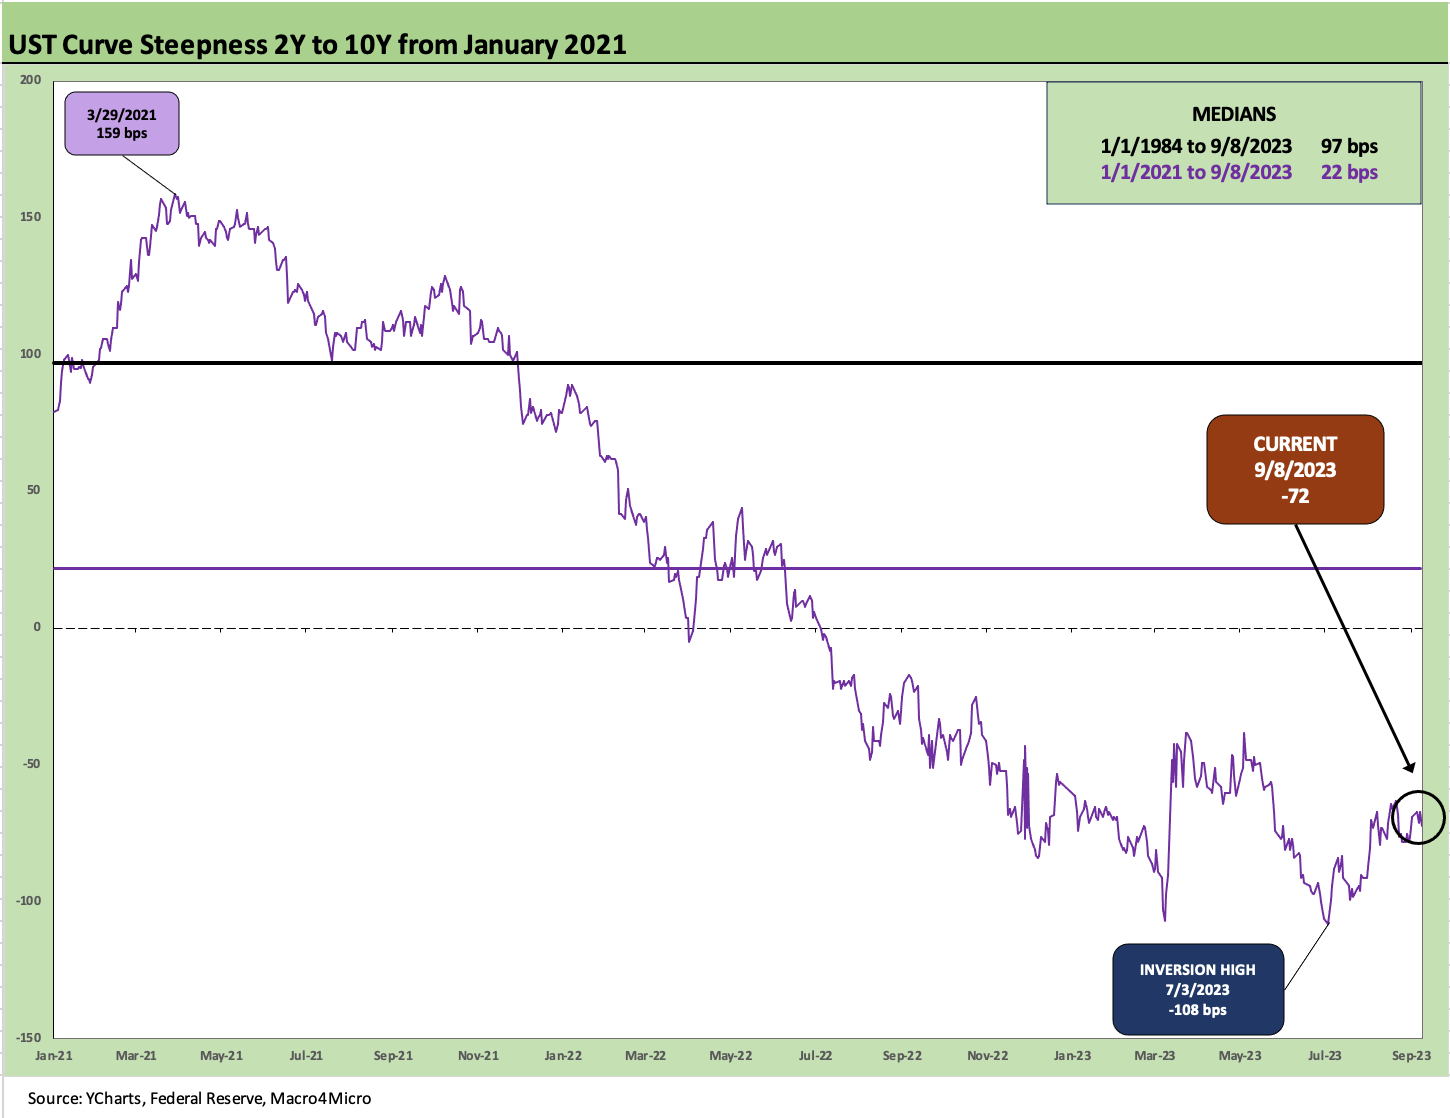
The 2Y to 10Y update shows a steepening pattern that has hurt duration as the peak inversion narrows from -108 bps in July 2023 to the current -72 bps. The steepening across the post-vaccine 2021 rally saw 2Y to 10Y hit +159 bps in March 2021 as the stock market and growth stocks were starting to really light up (think Peloton early 2021, Carvana summer 2021).
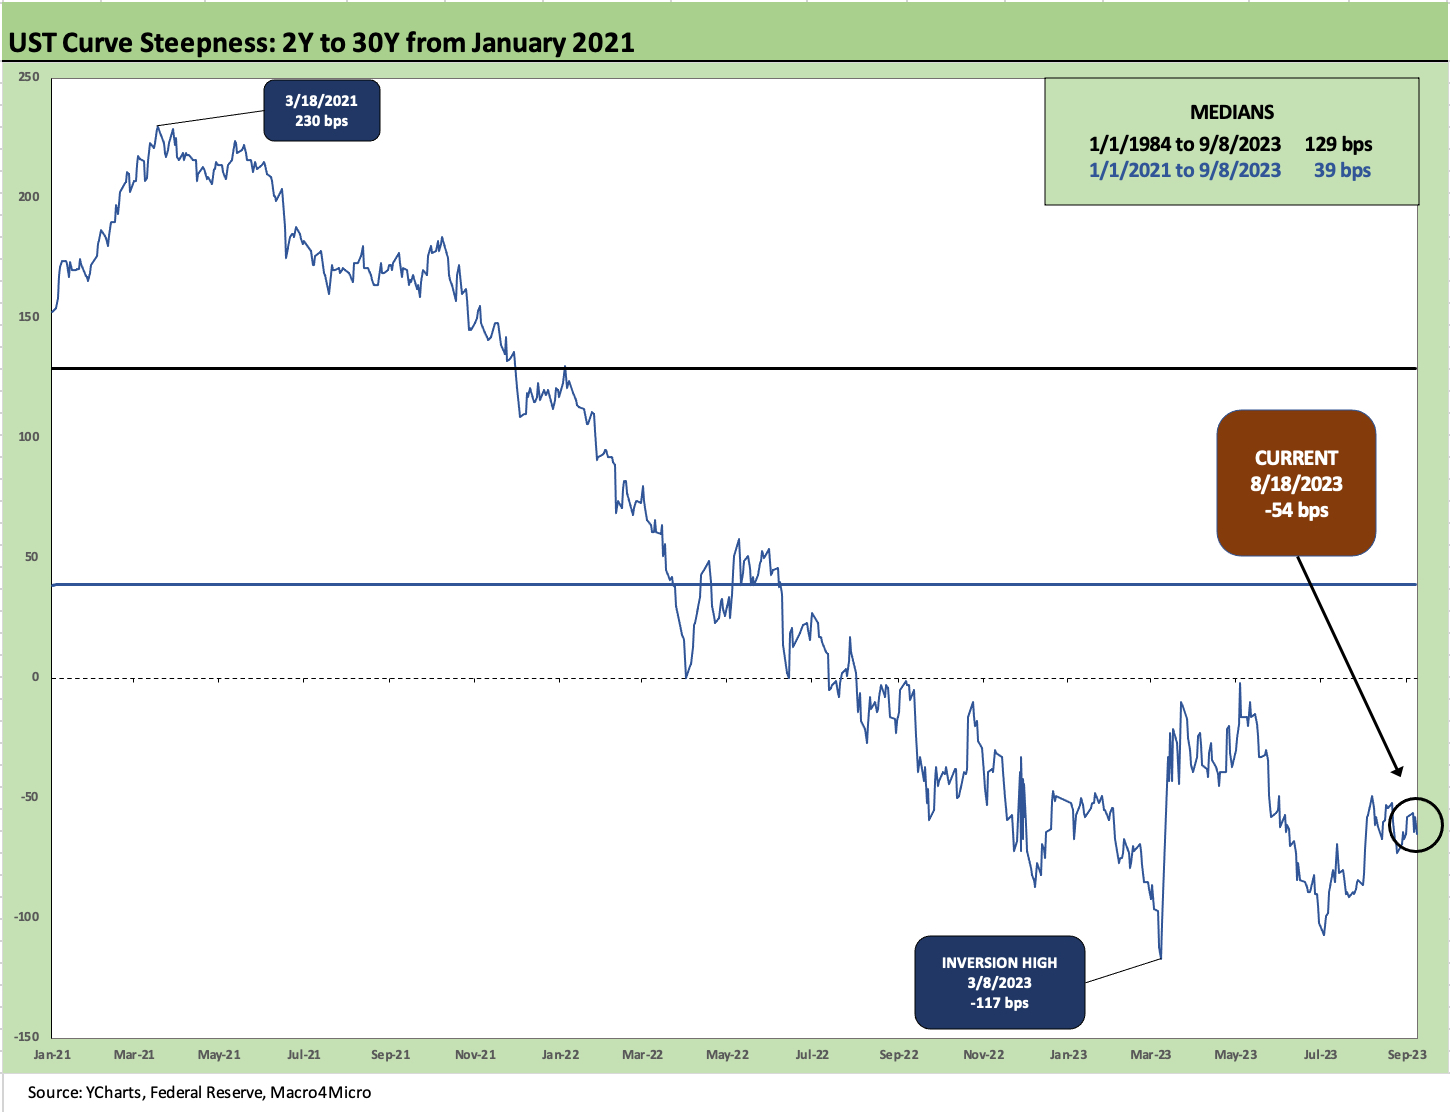
The 2Y to 30Y has some similarities to the 2Y to 10Y but the peak inversion came just ahead of the regional bank meltdown and SVB turmoil of early March as the inversion had reached -117 bps vs. the current -54 bps.
Inversion junkies as recession predictor will always be right someday, but that gets back into the inversion and “correlation vs. causation” argument we have discussed in past notes. The “curve as symptom and not a cause” argument is an old one. That said, sharply higher short-term rates do in fact take a toll on financial costs and equity valuation methodologies (discount rates).
The rising UST borrowing rates drove spiraling funding costs due to massive deficit and balance sheet demands (see US Debt % GDP: Raiders of the Lost Treasury 5-29-23). The UST is certainly showing how a lot more bonds should have been locked in at much lower rates early and often in the aftermath of the credit crisis and again during the COVID period. The treasurer of a corporate entity gets fired for such very bad timing. For the UST, there are more elections. There is then the “blame the last guy” strategy in one aspect of government life that mirrors corporate behavior.

We wrap this week’s Footnotes commentary with our usual timeline chart detailing the moves since the month of March 2022 when the Fed ended ZIRP. The action was taken at mid-month March 2022, but we post the running deltas across the yield curve from March 1 in the attached box.
The steepener in 2020 into 2021 and an ugly bear inversion after a nasty bear flattener was brutal on duration returns in 2022 and wreaked havoc in high grade corporate bond index returns. The expected relief for the duration trade was an active debate across 2023 but still has not shown up. The extension plan was a losing move that just lost again in August. We look at asset returns in a separate Footnotes publication.
We still see lingering risks out the curve despite the potential for more inflation progress. That comes down to supply and demand, and the path is still a tough one until more success is seen in services inflation. ISM Services weighed in with tailwinds again, so this battle is not over.
The macro indicators during August and early September have signaled some signs relief might be coming, but oil might have other ideas. In the meantime, massive UST supply needs to clear the market. The ingredients are still moving around, but the recipe seems to keep changing.