Footnotes & Flashbacks: Asset Returns 8-20-23
A good face on fundamentals brings ugly reactions.
Weak debt and equity returns were set against generally good econ data as duration and risky assets both suffered.
Another round of constructive indicators ahead of consensus sets the markets on edge again as the UST curve steepens.
China as a topic is working its way up the worry list as geopolitics and the global noise factor gets louder with BRICs organizing, de-dollarization trash talking, and more military exercises.
At the end of the day, better fundamentals is not a bad place to be even if tight spreads plus duration anxiety leaves fixed income credit assets vulnerable.
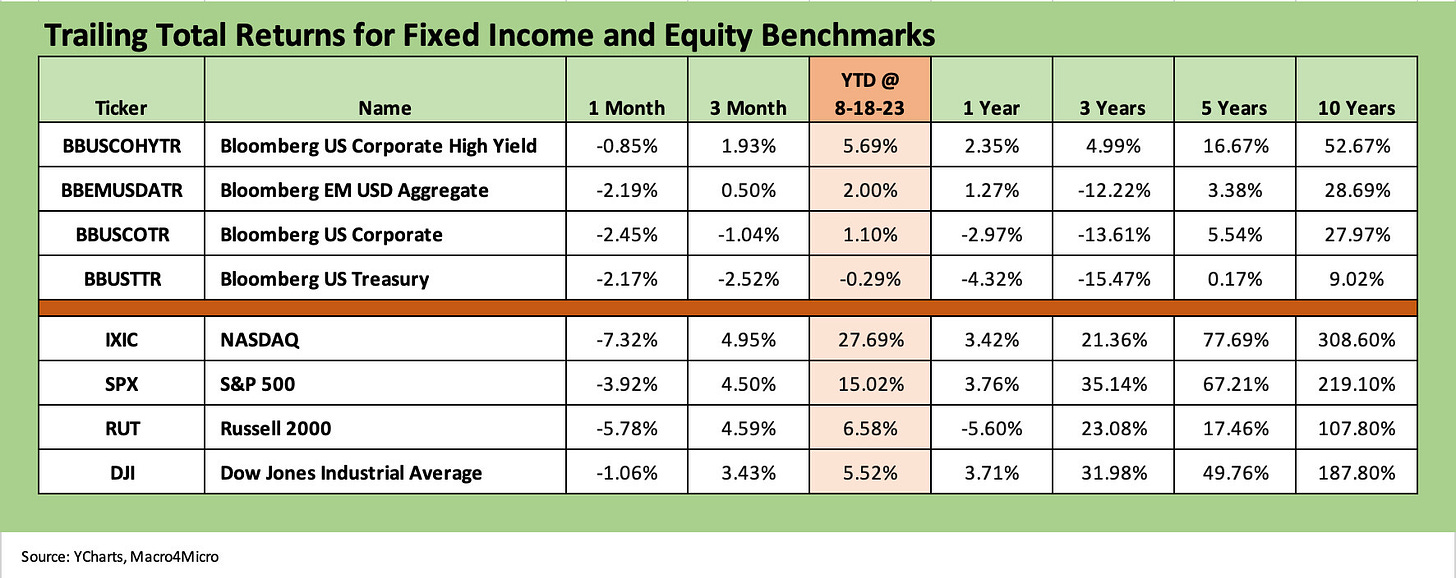
The above chart frames our usual debt and equity benchmarks, and the trailing month is pitching a shutout on any positive 1-month returns with all buckets in the red in both debt and equity. We line up the benchmarks in descending order of YTD total returns. We already looked at the yield curve action of the past week (see Footnotes & Flashbacks: State of Yields 8-20-23), and the UST bear steepening has been taking a toll.
In debt, HYG is still well ahead YTD on spread compression, higher cash income (coupon), and less exposure to duration risk. We see UST in the red YTD at -0.3% and IG Corporates barely positive at +1.1%. Looking back at a 1Y time horizon, UST is at -4.3% and IG Corp at -3.0%. The winner LTM was HYG at a sub-coupon + 2.4%. As much as 2023 was supposed to be the year of bonds, those numbers do not frame up well vs 5% handle short UST yields right now. It comes down to investment time horizon and a view on duration and continued spread resilience.
Equities have been getting beaten up the past few weeks, and this week also saw Tech absorb a few more body blows with NASDAQ now at -7.3% for the trailing 1 month with small caps at -5.8%. We get more into the past week narrowly and industry details in the ETF section further below.
The above chart updates the 1500 and 3000 series with 5 of 6 line items in the red for the past month. The Energy sector cranked up to a +8.2% month and +13.8% 3-month return in what has been a very strong comeback on the recent jump in oil prices and the potential for more cartel support. Looking back over the 1Y time horizon, Energy has been the big winner over all the subsectors with Industrials at #2. Industrials has been solid YTD and over the 3-month period while Financials and Real Estate are negative YTD. Growth has obviously crushed Value YTD even if Growth is getting reeled in this month.
ETF and benchmark returns…
In our next three asset return charts, we cover 1-week, 1-month and 3-month time horizons. We look at 26 different benchmarks and ETFs. We recently added equal-weighed ETFs for the S&P 500 (RSP) and NASDAQ 100 (QQEW) given the market cap weighted distortions in the total returns for those benchmarks that had been driven for much of the year by the mega-names.
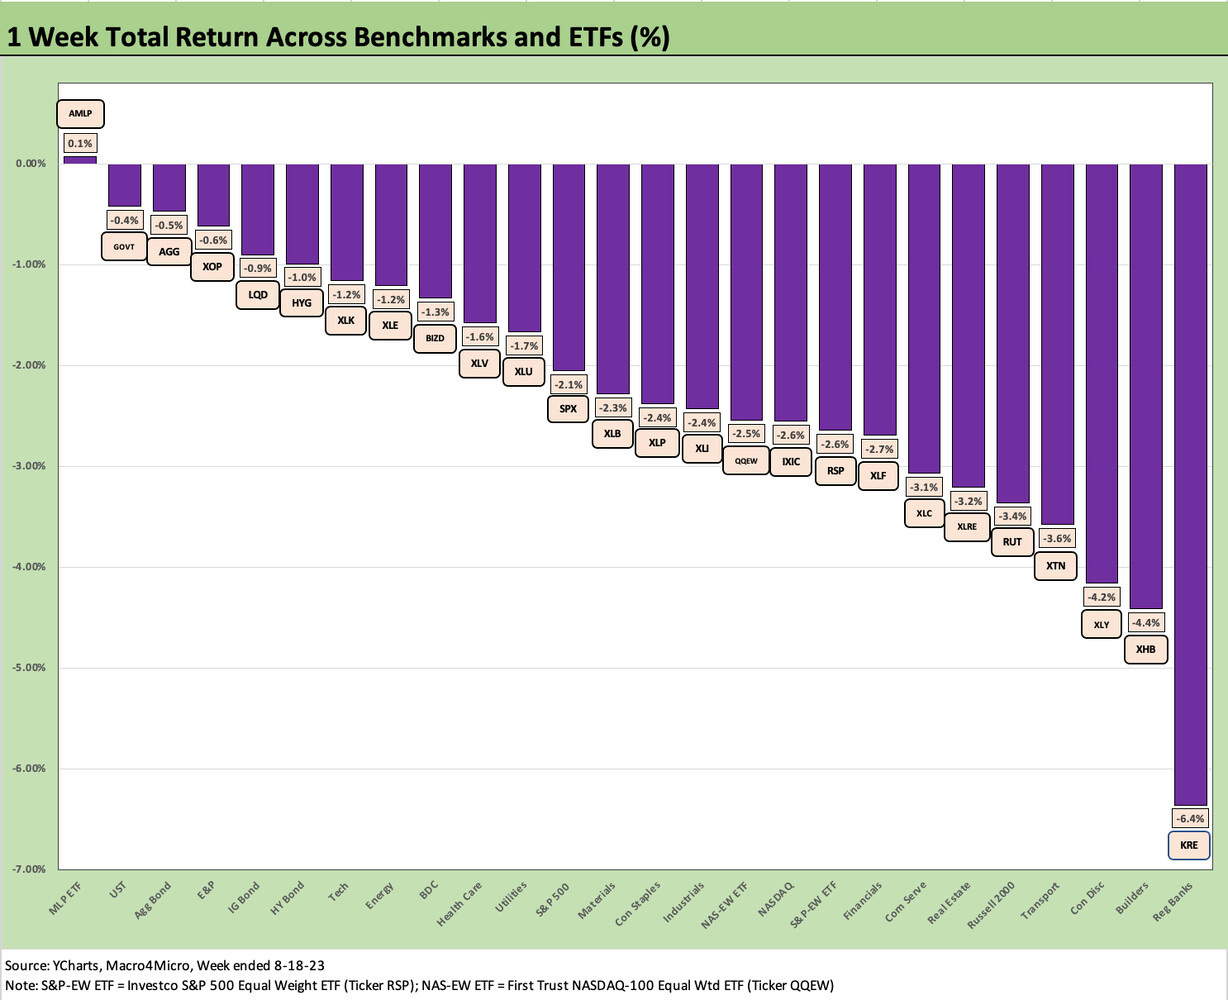
The 1-week return profile makes a statement just by looking at it with 1 of 26 in the black, and that one winner is a Midstream ETF (AMLP) that posted +0.1%. Fixed income ETFs comprised 4 of the Top 6 and all 4 were negative.
Equities felt the real pain the past week with the Regional Bank ETF (KRE) back in last place this past week at -6.4% even if it still holds down the #3 position over the trailing 3-month period. The fear of asset quality weakness in real estate and pressure on interest rate margins are the same risk factors that have been discussed for weeks, but any hint of more tightening and more real estate defaults gets the regionals on edge.
The steepening curve move this past week gave the Homebuilders (XHB) a pause after a very strong run as the builders were second to last. The builders have a range of tools to mitigate some of the worries seen in the chatter around “next stop 8%” that made the rounds although higher mortgages are by definition negative for all housing and real estate–residential or commercial.
The ability of homebuilders to use mortgage buydowns and fee incentives is a matter of planning and working capital management (deliveries vs. starts) and finding the right price vs. the cost of sales. Giving up some margin using the tools at their disposal has already been proven.
The other piece is that existing home sales could tighten even more. If there were golden handcuffs in the high 6% range, mid 7% range would impair the circulation for potential home sellers holding 3% handle mortgages. That could mean even tighter inventory for the home stretch in the seasonal peak season.
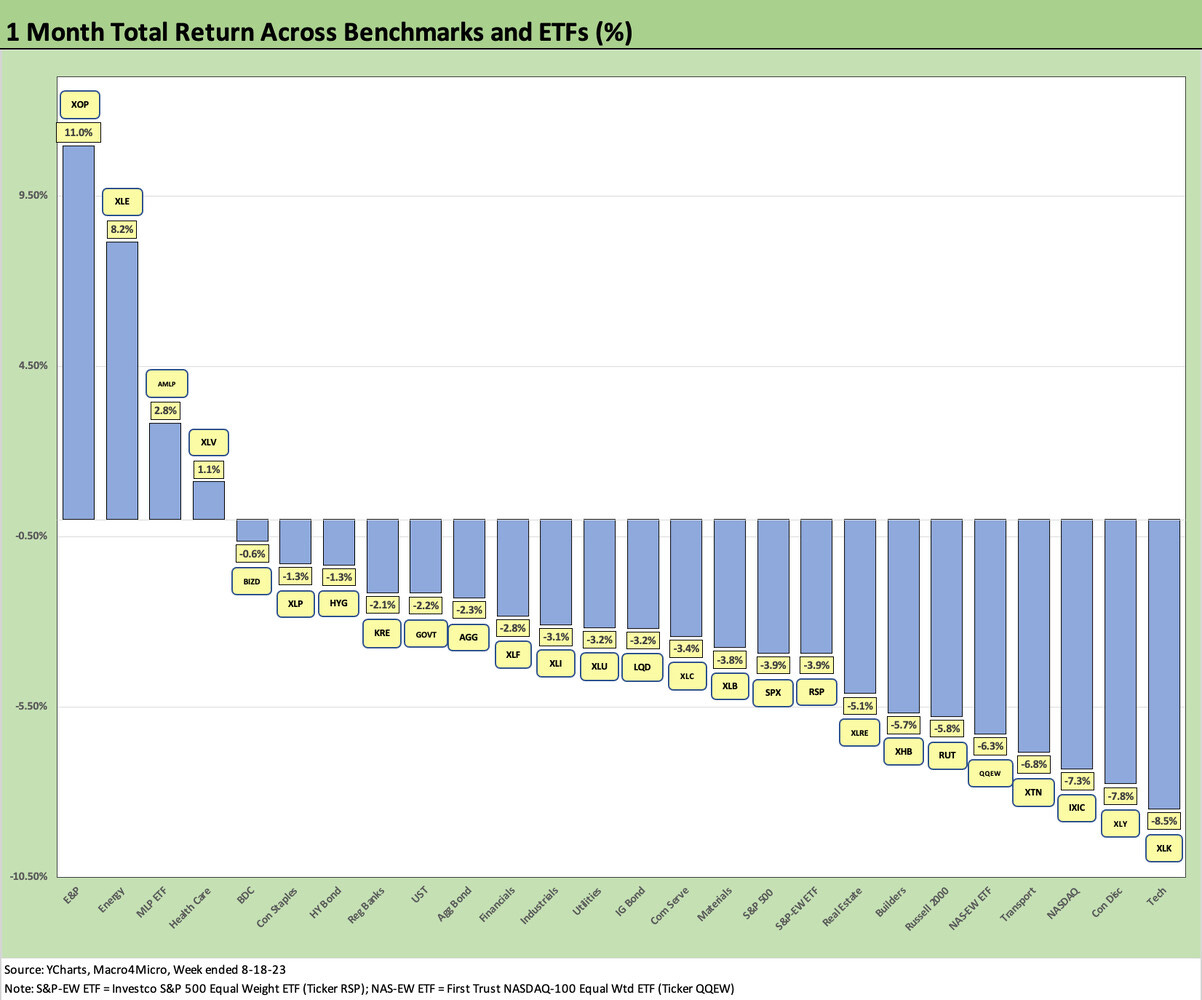
The trailing 1-month time horizon shows 4 positive and 22 in negative return range, so the pattern is clear enough. The clear winner is the E&P ETF (XOP) at +11.0% followed by the diversified energy ETF (XLE) at +8.2% with Energy Midstream ETF (AMLP) at #3 with a sharp drop down to +2.8%.
We see 3 benchmarks led by the Magnificent 7 in the bottom 3 slots with the Tech ETF (XLK) at -8.5%, Consumer Discretionary (XLY) at -7.8%, and NASDAQ (IXIC) at -7.3%. Breaking up the tech-centric names at #4 of the Bottom 5 we see Transport (XTN) at -6.8% as freight and logistics names have been getting hammered of late on weak fundamentals tied to a combination of pricing and capacity imbalance fears. The other name in the Bottom 5 is the Equal Weighted NASDAQ ETF (QQEW) at -6.3%.
The defensive Healthcare ETF (XLV) with its pharma-heavy mix was logical in the Top 5, but some may be surprised by the solid BDC ETF (BIZD) performance given some of the bearish noise around private credit as the credit cycle gets debated. The BIZD is led by the A-Teams of credit with the resources to navigate such a market. The brand names are about deal experience and personnel, and it is hard to argue against the profile of the players in the space. They are better when they are on your side and not LBO’ing your IG holdings. The BDCs are a love-hate sector that live on very high dividend payout rates and the potential for sustained growth in the size and scale of the earning asset base.
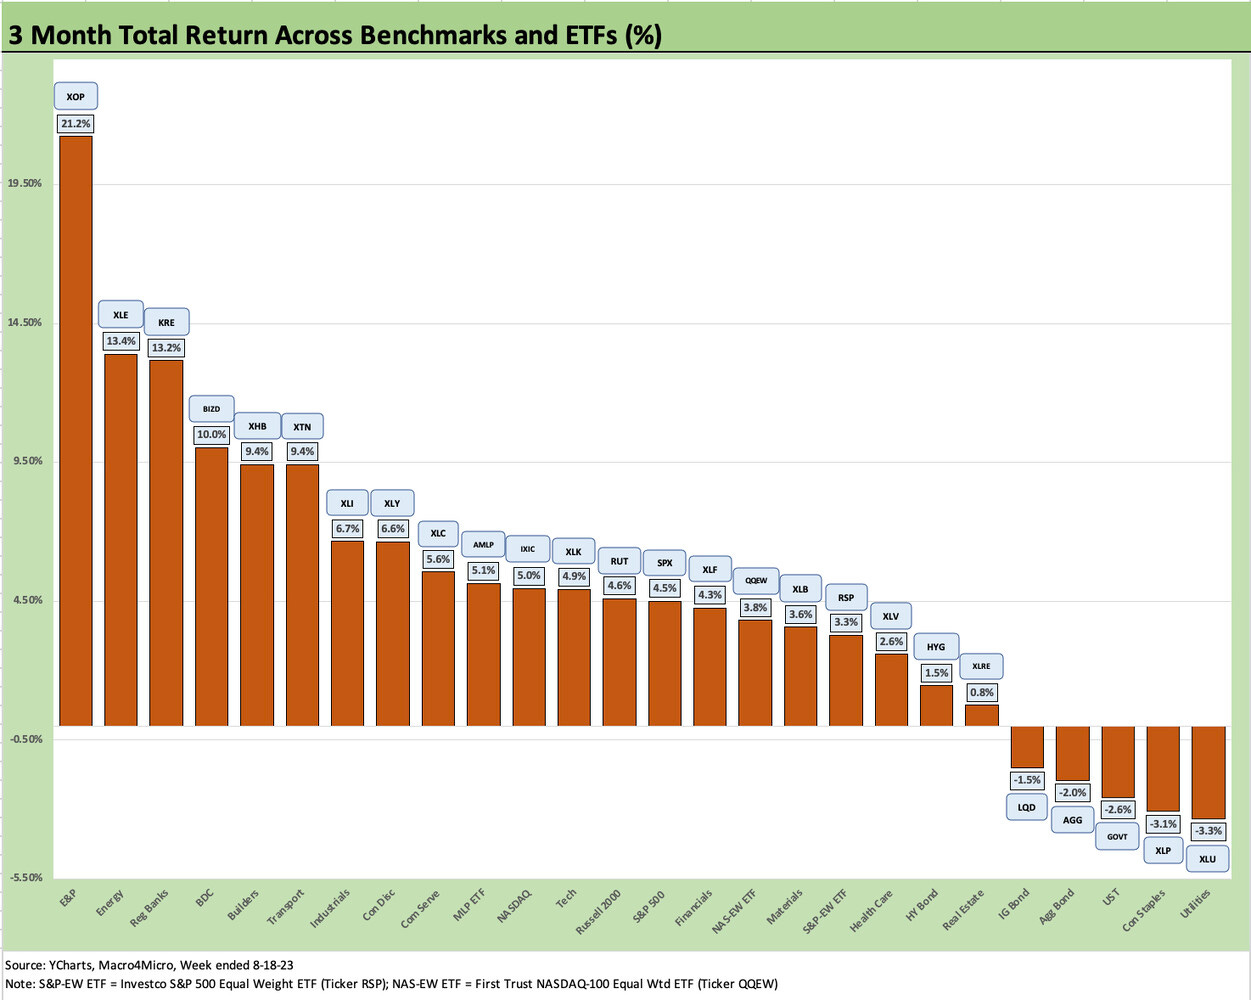
The 3-month time horizon turned in a better set of numbers given the backend fade of this market. We see 21 positive and 5 negatives. The winners in the mix included E&P (XOP), diversified Energy (XLE), and the rebounding Regional Banks (KRE) well ahead of #4 BDCs (BIZD), and at #5 the Homebuilders (XHB). Transport (XTN) was right in line with XHB but faded this past month more than XHB.
In the Bottom 5, we see 3 fixed income ETFs with UST (GOVT), the AGG Index (AGG) and IG bonds (LQD) in the negative zone. Consumer Staples (XLP) and Utilities (XLU) lagged as defensive names where there was not a lot of risk vs. the pack, missing the sharper moves but avoiding major setbacks.
In sum, the past week continues recent setbacks for risky assets on a mix of valuation fears after such a heady run combined with some being surprised around how much the yield curve has moved against what was a market consensus earlier in the year.


