
New Home Sales: Low Bar for Comps YoY, Sequentially Mixed
We look at new home sales trends and the increase in share of new home sales in the total home sales picture.


We look at June sales as the comps get easier vs. 2022 but the headwinds of rates, weather, smoke, and lending standards battle with high demand for homes.
The South is still carrying the load sequentially as the #1 market, but the two largest markets (South and West) posted numbers that make for a very strong trend line vs. mid-2022.

The above chart plots the June 2023 single family SAAR rate against median home prices. The comps are getting easier from here on volumes, and the prices are still well above pre-tightening levels. Prices are in line with the peak selling season of the 2021 period even with soft volumes. As a reminder, the month of June 2022 was the peak inflation month and cancellations were going to rise as sales orders were set to plunge all the way into 2023. The ability of the builders to adjust has been impressive.
The sequential trend evidenced in June 2023 after some material revisions from March through May are mixed. The West and Midwest are down sequentially and the South (the largest region by far) is up (+4.3% from May) along with the Northeast (the smallest region in the single family market).
On a YoY basis vs. June 2022, the #1 South is +21.4% and the #2 West is +34.9%. The #3 Midwest is -13.1% YoY with the #4 Northeast at +141%. That rolls up to +23.8% for the US in total. By any measure, that is a favorable pattern for new home sales. The COVID spike still stands out in the time series, but for builders the supply chain conditions are much better now and they can plan their communities and product offerings to be profitable in this pricing framework. We see that in gross margin numbers being released this week and last by the major builders reporting.
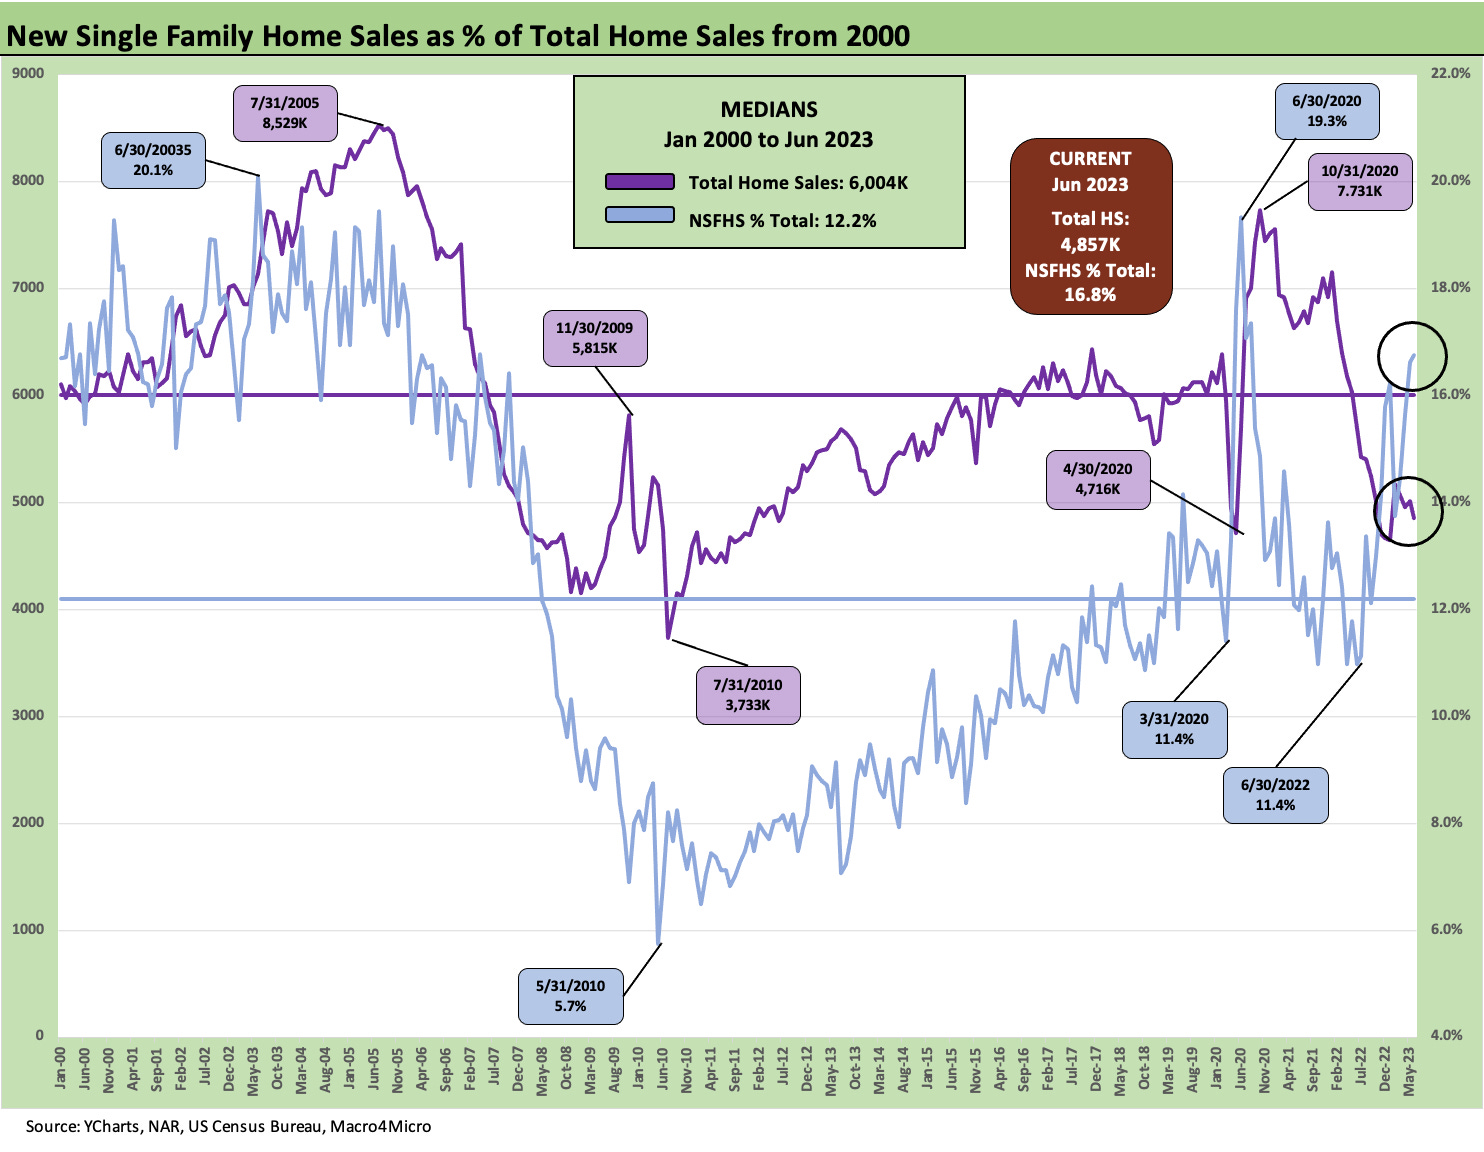
The above chart updates the mix of new single family home sales as a % of total home sales. We included this time series (updated above for June) in our existing home sales commentary from last week (see Existing Home Sales: Bare Cupboards, Hungry Crowd 7-20-23).
The chart tells a simple story of how the builders are picking up share on the back of very tight existing home sales. Existing home sales always dominate the numbers, but less than usual in this supply crunch. The median share for builders since Jan 2000 through June 2023 is a 12.2% share held by new home sales. That share was 16.8% this past month. The tight inventory is helping pricing for the builders and also supports equity balances by keeping them aloft in the housing market (see Consumer Debt in Systemic Context 7-13-23).

The above chart plots median monthly new home prices back to June 2021. The volumes in June 2023 are lower than in 2021 but prices have held in very well. The lower demand becomes a balancing act of working capital management versus the community counts. The sales process by regional markets sets the game plan on starts as builders manage their homes under construction with an eye on the rate of closings.

The above chart changes the visual from the prior chart to give a better sense of the rate of change. The chart also moves the starting point back to the pre-COVID period. The main takeaway is that the plunging UST curve and record low mortgage rates coupled with flight to the suburbs/work-at-home effects to send prices soaring. That is an old story now. The price levels for new homes in the peak selling season of 2023 have torched a lot of the most bearish stories on where homebuilding and home prices were headed last year as rates soared.
There is no question there has been volume pressures and prices have eroded in 2033, but the demographics, employment, and supply-demand realities beat the theories on downside. There are more than a few moving parts in the equation around prices, jobs, rates, and incentives for builders that are variable cost intensive and can manage the supply side to match demand and price structures.
These time series on median home prices always start with a big asterisk for regional and product tier mix variances. The move from $329.5K to start the timeline to $415.4K in June 2023 tells a story of a market with low mortgage rates locked in, a more valuable home equity base, and record payrolls. An off year in volumes while the world awaits the direction of the UST curve and mortgage rates in 2024 still makes for a constructive forward view on housing. That in turn is what the homebuilding equity market valuations are handicapping.
See also:
Footnotes & Flashbacks: State of Yields 7-23-23
Existing Home Sales: Bare Cupboards, Hungry Crowd 7-20-23