
Market Commentary: The B to CCC Adventure
We explore the B to CCC quality spreads and BB vs. CCC Hi-Lo relationship across the credit cycles.


The B to CCC price action has a wild history across the credit cycles as the dive into the CCC depths eventually brings in a different breed of investor when volatility spikes and differentials disconnect.
The “great widening” that comes each cycle (often more than once) is hard to time, but it always comes.
For now, the theme is one-off special situations, but the good times for distressed players will be bountiful with so many new players across private credit, leveraged loans, and the usual US HY bond volatility as the wheels of the credit cycles keep turning.
The risk-reward symmetry is always unfavorable on the low end during better days in the credit cycle, and tempting fate with risk maximization late in the cycle has a history of victims.
In this commentary, we follow up on the earlier IG vs. HY OAS analysis and our look at the BBB vs. BB speculative grade divide with a descent further down the risk spectrum. We first look at the “HY Classic” mix of the B tier and how that frames up against the CCC tier. We then look at the US HY market Hi-Lo differential range that shows BB OAS vs. CCC OAS.
The legacy reality is that average default rates rise exponentially for each move down the credit tiers from BB to B and then again in the move from B to CCC. Those starkly different credit risks across the credit tiers often get overlooked or ignored (especially in mainstream equity markets) when the headline “downgraded to junk” gets posted.
In the charts below, we plot the risk premium differentials between the B tier vs. CCC and then the BB vs. CCCs. The BB vs. CCC comparison frames the range within the HY asset class, which is still broadly considered by many as part of a separate category. The distinction between IG and HY is especially embraced on Wall Street where the Big Dogs fight over P&L control and bonus pool.

The above chart posts the timeline for the B to CCC incremental spread compensation (CCC OAS minus B tier OAS). If the pattern looks familiar, it is because the shape flows into quality spreads from the bottom up in the typical pattern of “decompression” (a polite euphemism for the markets getting crushed).
We see four TMT peaks for B vs. CCC differentials well above 1000 bps for B-CCC and the all-time high over +2400 bps during the bank systemic crisis. The recent differential of +496 bps is slightly above the long-term median, so it is not screaming out signals of mispricing the relationship. That also gets back to the issue of running it through your prevailing view of the issuer mix quality of the names within the CCC tier by industry and issuer.
We use spreads in the charts on B and CCC to be consistent with other reviews on risk premiums, but when the markets get really ugly it is more about dollar prices. During the worst of times, the exposure analysis gets into expected dollar price returns vs. theoretical downside on recoveries as the distressed crowd takes over and tries to frame their expected returns over a given time horizon vs. their risks. There comes a time in every credit cycle when many HY bonds become “stocks with coupons.” We are not near that point yet for the HY sector even if individual names are always candidates.
For a frame of reference in dollar price terms, the differential between the B tier and CCC tier peaked around 43 points back in early 2002, saw 32 points in Feb 2009, and was just under 30 points in March 2016. The early 2016 period was heavily about the implosion of the oil and gas sector that set off a redemption fear contagion effect with a subsector (E&P) that was by far the largest (and highly correlated) market in US HY.
After too many single digit unsecured recoveries in E&P restructurings, the pricing floor in US HY did not collapse in early 2016, but it came close. Once again, the price action in 2016 took place during an economic expansion. We look at these periods more in the credit tier sections below.
These peaks can occur between the goalposts of what are technically called “economic expansions” (i.e., not recessions) by NBER. The worst price action often takes place ahead of the lagging indicator of default and recession. The TMT bubble saw a 31-point B vs. CCC price differential in early 1999 when the NSADAQ was running to a record +86% total return with the HY default cycle underway by late 1999. The equity market has since learned to pay more attention to credit.
Interestingly, the post-TMT economic downturn (after March 2001) was the most muted downturn in the postwar era while being accompanied by the longest, most protracted credit default cycle. That underscores that the credit markets can march to their own beat.
Price risk can run the gamut during restructurings…
As we have seen in past years, the risks in CDS in the immediate aftermath of a default and Chapter 11 filing can be very different than valuation at Chapter 11 exits after reorganization. In recent memory, the fact that Hertz cleared the CDS auction at a 26 price but emerged from Chapter 11 at par plus was one for the ages. That thickens the plot on how distressed specialists set up their exposures across layers of the capital structure and in cash vs. CDS on the way into periods of rapid change, financial stress, and event risk (which can be good or bad event risk in such situations).
A more distant memory would be Delphi during the period of pre-crisis auto stress. Delphi recoveries looked very different from the initial CDS auction to the first round of proposals from Steve Miller on restructuring (which looked like par plus recovery) before the proposal got killed and Delphi was swept up in the financial crisis and GM collapse. Like Delphi, Hertz was swamped by an event outside their control with pandemic fallout ahead of vaccines and bidding wars.
That is a long way to say, “a lot can happen inside and outside of recessions.” The economic cycle is important but so is the underwriting cycle and credit cycle. We say “underwriting cycle” since the TMT era drives home that bankers will print tickets with a big “caveat emptor” attached ahead of the time when “emptors” evaporate. That mindset led to a lot of poor underwriting with the marching orders to maximize the revenue line in the TMT years. That collateral damage played out in leveraged finance and equity businesses across the TMT cycle of the late 90s.
Some thought that approach to underwriting ended with the Enron/WorldCom government actions. While that was somewhat the case in corporate bond underwriting, the “crazy virus” migrated over to the structured credit scientists and mortgage rainmakers (or do they make lightning with your name on it?).
Interestingly, the mortgage mayhem and structured credit ingredients blew up the banks/brokers, in turn leading to severe credit contraction and inflaming the cyclical fallout in corporate credit markets that peaked in late 2008 into a March 2009 equity market low and economic cyclical trough of June 2009.

The above chart frames the B tier spread waves and Hi-Lo history. The recent +417 bps is below the long-term median of +477 bps for B tier OAS. The post-crisis to current median of +476 bps (6-30-09 to 8-18-23 median) included most of the ZIRP years (ZIRP started during 4Q08, ended Dec 2015 then restarted with COVID through March 2022).
OAS after 2008 had a low UST curve to price off of, so the current market at least offers much better all-in yields as it rides the UST’s upward migration. That still begs the question around how to frame the proportionate risk premium warranted in B tier OAS vs. UST (see Credit Spreads: Proportions Matter in Risk Compensation 8-14-23).
The current B tier OAS backdrop is below median but nothing like the lows of 1997, 2007, 2014, 2018, and late 2021. The idea of being paid below-median spreads for above median risks appears very vulnerable to us.

The above chart details the wild ride of the CCC tier. This tier is naturally the highest risk sector with exponentially higher default rates than the B tier across history. Issuer selection reigns supreme and the price differential between the high quartile quality CCC names and the low quality CCC names can be quite dramatic.
The trough OAS levels noted in the chart are certainly a long journey from the peaks as broken out across the period of market turmoil, systemic stress, and badly impaired secondary liquidity. The +4,400 bps OAS in the crisis is an eye-opening number. That was back at the time when the CCC tier dollar prices hit the low 30 range. The CCC tier hit the low 40s back in 2001 during the double dip default cycle periods of 2001-2002. That was a first-rate mess.
The old adage is “buy CCCs that are good companies that are CCC-rated based on lots of capital structure layers.” Names like HD Supply and TransDigm from the last cycle are glowing examples of high-quality par-plus CCC bonds (they later rose up the credit ratings ranks quickly enough). The other old adage is “Everything is AAA at a price.” To say relative value assessments can get tricky at this end of the credit food chain is an understatement.
Pricing the risks run the gamut from a classic credit bond framework to more of the credit analysis dark arts. The latter entails projecting price targets on deeply discounted bonds, framing the fundamental scenarios (still the biggest part of the analysis), and having a friendly neighborhood JD on hand to watch for legal sleights of hand by deal lawyers with their Three Card Monty documentation games and misdirection tactics. That can really come into play when borrowers and lenders (loans vs. bonds, 1L vs. 2L, etc.) come into zero sum game moments across the capital structure (including private equity stakeholders).
A shorter time horizon view….
The next two charts narrow the timeline and look at 2021 to current times for a view on how the B and CCC OAS framed up as monetary support, fiscal action, and vaccines drove a rebound and a refi-and-extension HY boom.

The above chart frames the trend line in B vs. CCC differentials across the 2021 rally and the 2022 widening into the current 2023 rebound. As noted earlier, the current +496 bps is slightly wide to the long-term median since 1997 of +475 bps and the post-crisis median (from 6-30-09) of +470 bps. The widest median as a frame of reference would be the TMT years when the relationship ran north of +700 bps. This sets an ugly bar and was even before the worst of the TMT default cycle wave.
During 2021, the move from the low of +226 bps in July when the market was chasing risk to the peak differential of +741 bps in early Nov 2022 is a sobering and extreme move as the recovery was gaining steam in 2021 (along with inflation) into the tightening cycle of 2022-2023. The mini-bounce back to +643 bps after the regional bank scare still rallied into the current level under +500 bps (at 8-18-23). The easy takeaway on this relationship is that the spread gaps and rallies can come on fast, and handicapping the short list of catalysts ahead will be the drill as we roll into the fall. We still see HY spreads as vulnerable in the home stretch of 2023.

The above chart gives a more granular view on the short timeline move of B and CCC spreads that get obscured in the longer timeline chart. The B tier doubled off the lows of 2021 and into the highs of 2022. The CCC tier OAS more than doubles. Welcome to the low end of the HY market.
The smaller size of the CCC tier has the quirks that CCC tier OAS can widen on its own as overall quality spreads widen or can widen as single B tier names “fall out of bed” into the CCC tier and the constituent mix shifts. We saw a lot of the latter in the HY energy plunge.
In an ironic twist, the CCC tier OAS can narrow as large, troubled names fall out of the index on defaults as the mix improves and those names drop out of the index. We saw that back with TXU and Caesars. That is just an item to remember as major names collapse and default.
The BB-CCC Hi-Lo risk premium differentials …
Below we update the quality spread differentials of the BB tier vs. the CCC tier. We use this “Hi-Lo” metric as a snapshot of how diverse the overall US HY quality mix is across the cycles both in terms of industry and issuer mix and with respect to how the market is pricing the speculative grade asset class subsector. The concentration of bad TMT names in 2001-2002 and leveraged upstream oil & gas names in 2016 made for some major divergence.

The above chart plots the long-term time horizon from 1997. There is not a lot of mystery at this point with the cyclical and industry swings already discussed earlier. The June 2007 spread compression really stands out, however, given what unfolded not long after as the credit markets effectively shut down in the summer of 2007 and the recession started in Dec 2007 (as retroactively dated by NBER).
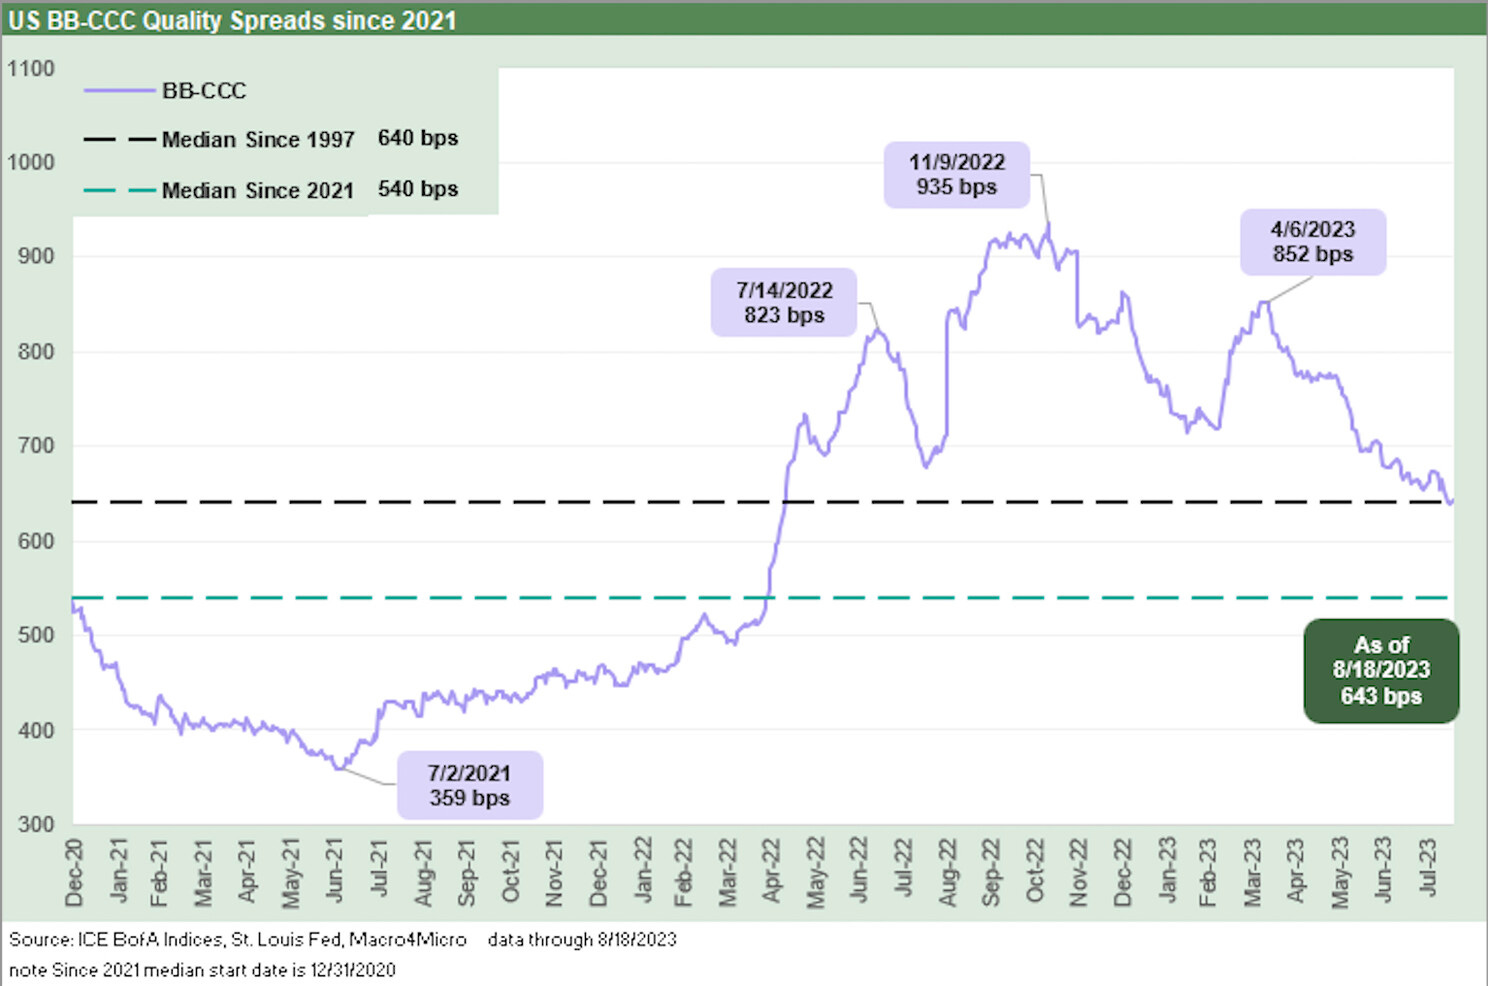
The current BB to CCC quality spread differential of +643 bps is almost on top of the long-term median of +640 bps. The recent differential is well above the 2021-2023 median of +540 bps, so the market is starting to think about sequential weakness on defaults and quality pricing. The market got a taste of trouble in the move from +359 bps in summer 2021 to the +935 bps in fall 2022. We then saw a rally before the regional bank whipsaw back to +852 bps in April 2023 on the way to the recent +643 bps.
Summary takeaway…
Overall, the mix of spreads we detailed above are food for thought and offer some granular history to consider. We by habit like credit asset classes in a diversified portfolio, and we have been more favorable on floating rate risky credit in 2023. Our view is that the smoke clears on 2023 with IG outperforming HY in both total return and excess return. That view remains intact even if IG has lagged so far. The best values in HY as an asset class will come later. The rally in US HY OAS in 2023 and lower duration exposure has been a winner so far while IG has tasted some duration pain of late (see Footnotes Flashbacks: Asset Returns 8-20-23). Bring on the fall.
See also:
Market Commentary: BBB vs. BB Quality Spreads Revisited 8-21-23
Contributors:
Glenn Reynolds, CFA (glenn@macro4micro.com)
Kevin Chun, CFA (kevin@macro4micro.com)