Midyear Trade Flows: That Other Deficit
The midyear trade flows for the US make the low import levels something to ponder in cyclical context.
We look at how June 2023 midyear trade deficits frame up across a period where geopolitics, cyclical uncertainty, and political strife are vying for the top spot as the riskiest variable.
With “relative” peace on most trade fronts, the China X-factor will loom large for supplier chains and those looking to be less global while keeping all the global advantages.
The regular occurrence of 6 standard deviation events makes it hard to be complacent about rational outcomes in trade policy.
The latest trade data out of the US Census this week saw some interesting trends including a sharply lower goods and services deficit YoY on plunging imports. Declining imports are often seen by some as good news since trade deficits are intrinsically bad to some constituencies out there (note: we don’t see deficits as intrinsically bad). The other angle is lower imports can signal weaker plans around inventory accumulation and a cyclical warning sign to watch.
We are updating the midyear trade picture in this commentary in part to consider the emerging and potentially escalating risks of the US-China trade battles and less about short term inventory and GDP debates. Headlines today had the White House putting material restrictions on investments in China, so trade noise, geopolitics, and questions around what declining global trade might mean will be important 2023-2024 topics. We also saw a sharp decline in China exports broadly.
The structural changes unfolding in US-China trade risks could be one of the biggest threats in 2024. The areas of concern could touch on a broad range of industries across autos (both EV and ICE supplier chains), aerospace (China as #1 commercial airplane buyer), the tech chain (semis and tech transfer restrictions), and agriculture (will new trade clashes hit ag again?) among others.
The US posted record trade deficits in Goods in total trade across 2020, 2021, and then repeated that in 2022 (see Footnotes and Flashbacks: Week Ending Feb 10, 2023). We earlier had looked at some of the trade partner lists (biggest deficits, etc.) in the fall of 2022 as inflation raged and the role of tariffs was debated (see State of Trade: The Big Picture Flows 12-18-22). The decline of China trade and rise of EU trade has been one of the main themes. We look at some of those trends below in total and by major trade partner.
Beyond the 2020 to 2022 streak, we see record deficits in 4 of the past 5 calendar years. That miss on a new record in 2019 was associated with US-China trade battles at a time when the US market was slowing and the Fed easing. Reducing trade deficits was a major priority for the Trump administration and the catalyst for a wave of tariff headlines starting in 2018. Based on the results, we would make a summary judgment that the policy mix was not working all that well. The fact is that Biden has in substance been continuing most tariffs even if he tweaked the language and dressed them up.
Below we plot the timeline for import and export flows to and from the US. The main concept is higher flows mean higher economic activity. To make the good or bad call on imports requires that you get into the weeds on how much related activity comes with that trade flow in terms of goods and related services.
The trade flows tell a story, but you need to fill in the details at sea level. Rising imports can reflect an improving economy with the US as the largest consuming nation in the world. That good news often comes with rising trade deficits, and the flip side (lower imports, more guarded consumption) can be bad news. The fact that China is such a large importer into the US also calls for watching the China economic worries when imports into the US decline.
The trade deficit got a lot of media airtime in the Trump years before COVID made it a forgettable risk factor as people tried to stay alive and keep their jobs. The reality is that supplier chain worries should have risen on the priority list during COVID. Since then, the US markets got a taste of how fragile global supplier chains can be. What played out in 2021 and into 2022 showed structural imbalances can be quite inflationary when demand gets fiscal and monetary support at a time when the supply side of the equation has been battered by various forces.
There is a greater sensitivity now to the practical realities of production problems and how the critical freight and logistics (i.e., “delivery”) constraints can disrupt economic activity. That is even the case when the goods can be produced and can’t reach their destination. The added costs become inflationary as pricing power gets turbocharged. Tariffs do not help in such cases when production chains have not prepared for the sudden surge. The inflationary effects get worse.
China and trade deficit checklist…
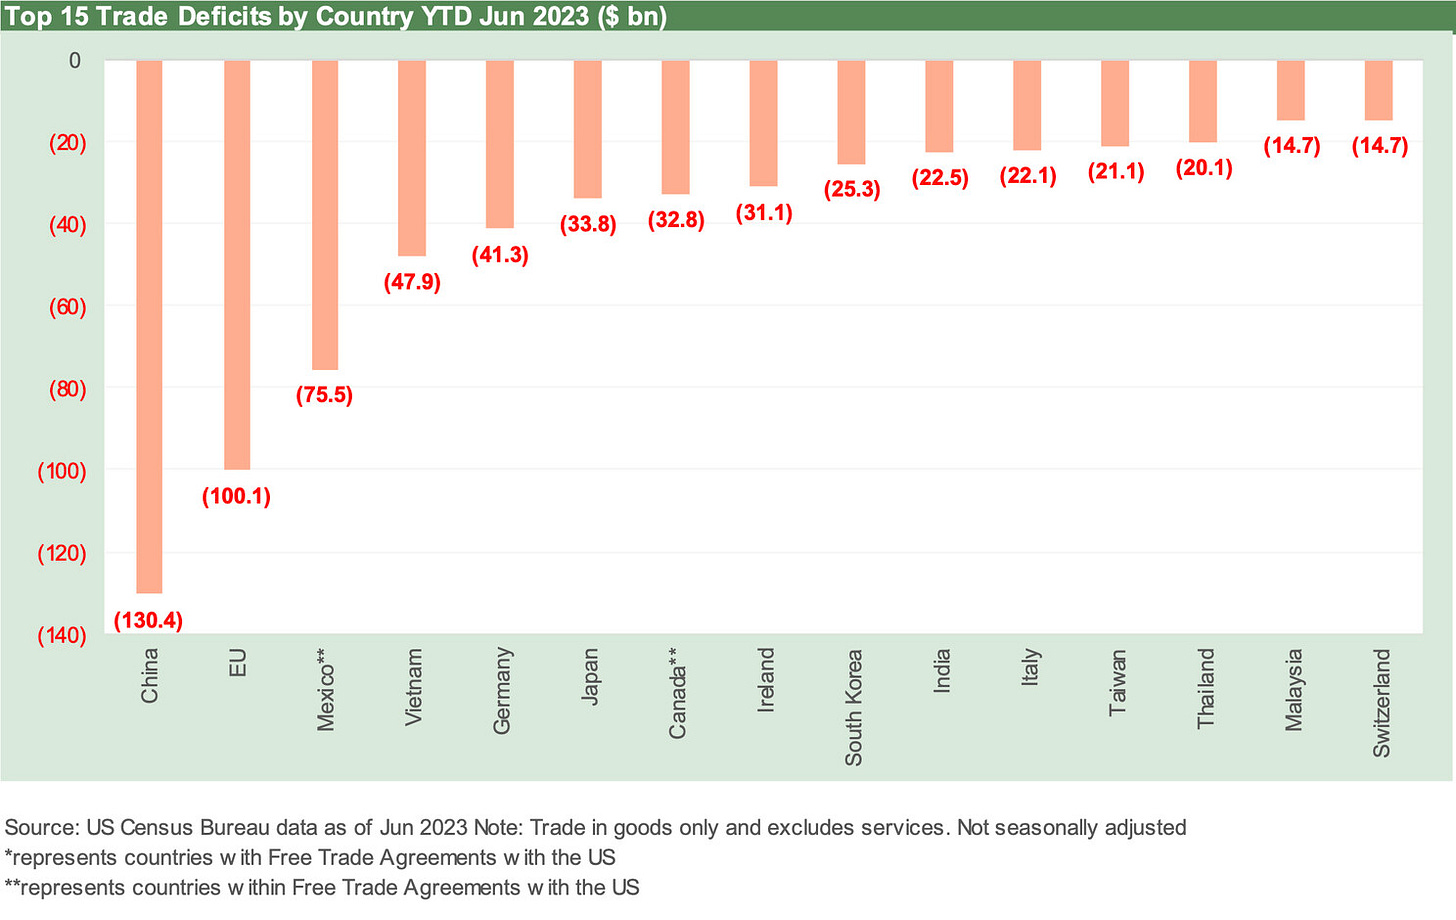
Below we break out the YTD (6-30-23) trade deficit in goods. As usual China is the runaway leader even with the major YoY decline in the US-China trade deficits that we detail in the chart following this one. Perhaps the most notable name on the list is Vietnam, which ranks at #4 behind China, the EU, and Mexico but ahead of Germany.
Every major trade partner has some interesting story lines in the product mix and two-way flows of imports and exports. There is no getting past the reality that so much of what is discussed in trade these days is about China and the US. The NAFTA/USMCA clash could have been tectonic under Trump if it went in a bad direction, but that deal got wrapped and he took his victory lap. Peace with South Korea and Japan was good news.
Meanwhile, the EU and US went back to being mad at each other on trade with no comprehensive trade deal and a few tariff spats along the way with reprisals always proportionate. Periodic fights are a constant there, so the EU is less interesting. That leaves China, and that is getting even more toxic with news this week on the investment barriers being put in place for US investors in China technology initiatives.
The geopolitical strife (Taiwan), the highly sensitive nature of semiconductor supply (centered in Taiwan), technology transfer rules, tech export restrictions, China’s tacit support of Russia in Ukraine, accusations on COVID, and wandering balloons have all made for a highly politicized environment on China trade.
In a country where election results are not respected at the same time the jury system is questioned (that’s the US, not China), the “China as bad guy” rhetoric is one of the few topics of convergence across parties in Washington. That makes China trade policy intrinsically a very risky variable into the 2024 election cycle.
Supply shortages in the post-COVID period are now in the national dialogue from autos and chips to baby formula, so any threats to various key products (from medical to manufacturing) will get more scenario spinning in the future. Those topics are for another day, but China supply issues will need to be considered as the China-bashing unfolds. Washington needs to weigh the cost. If not, the losing party will blame the winning party anyway.
As we look at the YTD trade deficits below, the China line offers a reminder that there is a lot of product supply at stake for two nations that are increasingly hostile to one another (as a son of a Marine who enlisted out of high school to fight in Korea, I learned early that hostility between China and the US did not always end well). For the US and China, backing down is not an option.
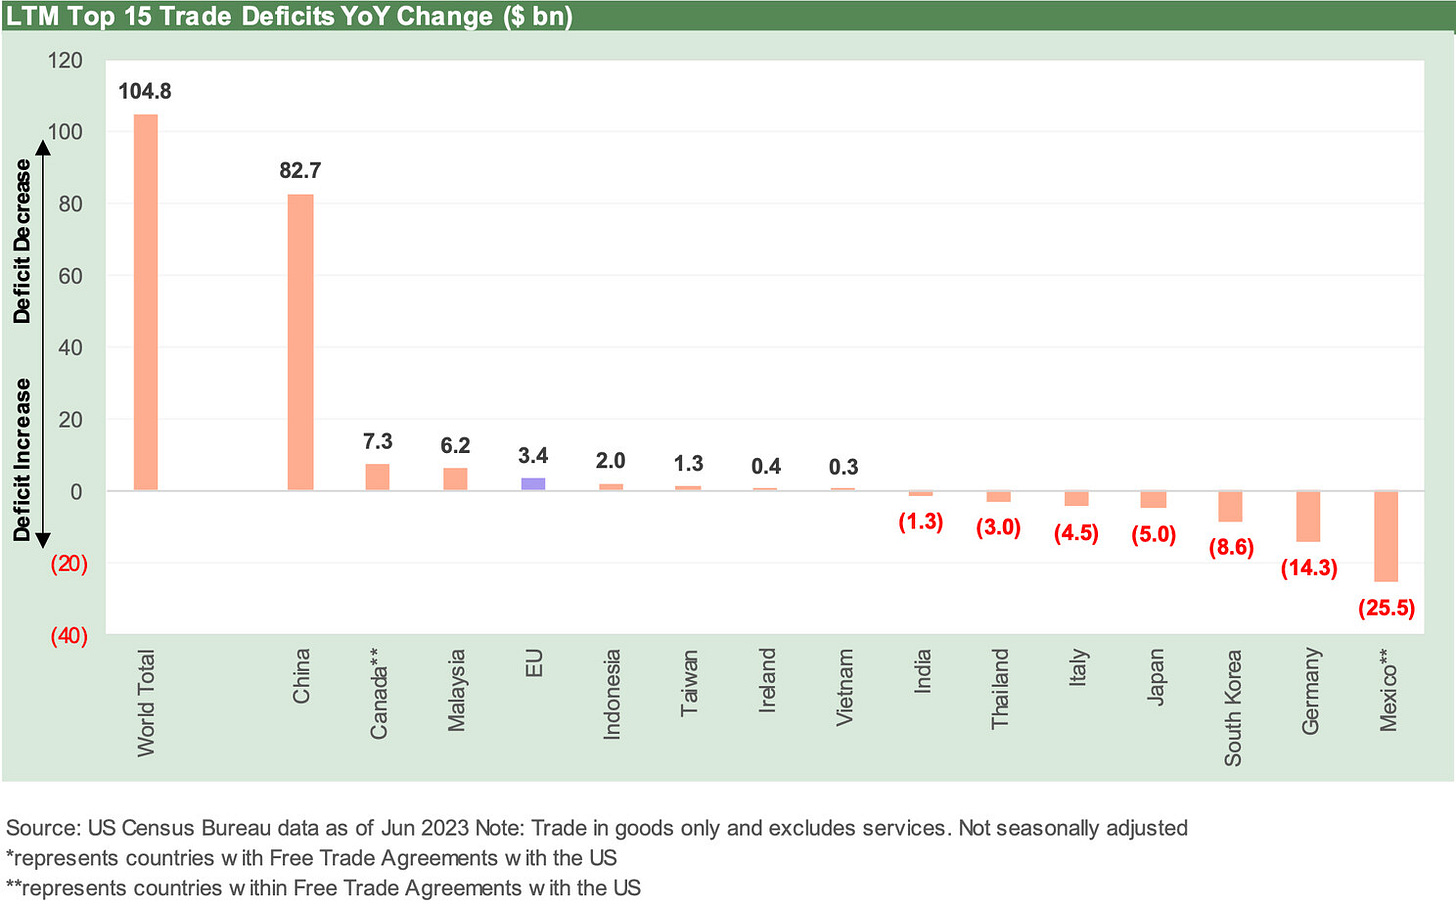
The chart above details the swings in the deficits YoY on an LTM basis. That means framing the period from July 2021 to June 2022 to the July 2022 to June 2023 period. The ~ $83 bn decline in the trade deficit for US-China goods trade is an eye-opener. That trade relationship accounted for a significant majority of the trade deficit decline posted by the US and the world ($104.8 bn).
How to tackle China trade topics…
We can break the China challenge into a few major buckets, but there are several small buckets within those larger buckets of risk factors. Those usually get too nuanced for headline political soundbites. The hearings and legislation raise topics that can quickly get lost in arcane trade rules, WTO-speak, and matters that politicians do not want to talk about. We look at a few of the major macro topics below.
Tariffs as an inflation factor: We are not likely to see policy makers or those running for office admit that tariffs can be a de facto inflation contributor. In a market dominated by inflation news since late 2021, the cost of inputs often includes something made in China. Supply and demand and input costs are not a routine discussion point at the political podium. Tariffs as a first choice in policy under Trump (continued under Biden) implied cost recovery on the other side of the tariffs is another part of the seller pricing equation. Basically, prices go up. Try to refute that reality if you slap a tariff on something and there is a lack of readily available substitutes.
In the end, higher tariffs translate into higher supplier chain costs, and that in turn means seeking to use pricing power in markets where supply-demand imbalances exist. In a down market and weaker economy, the tariffs could mean margin erosion for the seller and profit pressures. The use of MROs (Maintenance, Repair, and Operations suppliers) to manage low-cost sourcing practices and inventories has become much more complicated over the years with tariffs and freight issues.
Who pays for the tariffs?: This is a topic that could not be more simple at Step 1 (the delivery of the goods into the US) since the buyer pays. Not China. That “buyer pays” topic is one that Trump has never admitted (Navarro routinely ducked the topic in interviews I watched). Fox News won’t ask it and we expect no one will bring it up in the GOP debate (even if Trump does not show up). A cornerstone of Trump’s claim that he built the greatest economy since a caveman started charging for fire is that he collected “billions and billions” from China. The reality is that he collected zero dollars from China since “the buyer pays.”
Meanwhile, on the Democratic side, if you ask Biden who pays the tariffs, he will skip the topic altogether and start talking about unions and Scranton. The fine print of trade and WTO rolls the eyes back in your head, so the easy political solution is to talk about job loss.
Leaders such as Bernie Sanders and many others like him hate trade deals, and the ability to execute on any trade deal with the EU or China in this partisan backdrop rounds to zero. The former NAFTA nations (now USMCA) at least are in a continuing deal that allows for more friendshoring of trade and the structural evolution of global supplier chains that can have a direct bearing on lowering China exposure. Low-cost assembly operations in Mexico at a fraction of US minimum wage is tough to compete with.
Trade battle handicapping: The Section 232 tariffs were using a national security rationale (e.g., NORAD partner Canada as a threat in aluminum or NATO partners as a national security threat in steel), and that was a clear insult to allies. That has given way to rebadging Section 232 tariffs as mutual agreements and quotas and not the trade partner being the enemy. The effect is still managing imports to the satisfaction of US interests. In other words, we see more protectionism ahead.
The liberal and easily rationalized use of Section 301 tariffs has been the passport to paradise for China trade tariff fans. Just say “unfair trade practices” and take action to prevent WTO dispute resolution.
Going easy on China is fraught with political peril in the 2024 election year, so the forecast on supplier chains is a tough call. There is a greater likelihood (subject to election outcomes) that the US withdraws from the WTO (or the WTO remains functionally useless) if the market stays on the current path.
A comprehensive overhaul of China trade can be negotiated in theory but unlikely in reality. Other low-cost countries such as Vietnam have benefited from migration of sourcing to their countries, but onshoring has been a struggle for anything outside the higher value-added part of the chain.
The China factor in the trade flows…
The above chart details the timeline of US-China trade deficits. The LTM deficit now is back around where it was in 2020 after growing into 2021 and 2022 on solid demand in the US. The trade deficit with China still needs to be framed in the context of total trade and alternative suppliers. The idea is that imports and exports with China both will go lower – but especially imports. That raises questions of China economic health if we see similar practices in Europe, who is wrestling with some of the same issues.
The chart above shows the peak trade deficit in 2018, and that is when the battles were picking up even as the NAFTA process was unfolding and finally struck in late 2018 (effective mid-2020). The attacks on China were escalating across that period and peaked in 2019. Battling with all major trade partners including the EU was a matter of executive branch policy goals (disputed as they were by some in the administration who did not last or retreated on the topic). The waves of tariffs started to hit hard in 2019 and the liberal use of Section 301 unfair trade extended into 2020.
Retaliation against the ag sector was a recurring theme, and that set off some broad sectoral pain in the US. Washington provided relief funds in fiscal support to the farm belt (on the taxpayer’s dime), but that was not enough to cover the damage. More tariff battles with China will thus be a budget item to consider before any more aggressive action against China. The relief to the ag sector was certainly justified but will be one more item to trade off in Congress as budgets get beaten up based on who is in power. Failure to support some initiatives in areas will face some payback in others in a dysfunctional Washington.
The above chart plots the LTM trade with China. China entered the WTO in Dec 2001, and the ability of global services and manufacturers to source from low-cost countries (LCCs) accelerated the overhaul of global supplier chains. Investment in JVs and technology transfer soared in China for US companies, who got addicted to the opportunity and the favorable economics. Like two old school Curtis Mayfield songs, the economics of suppliers for US systemic risk was migrating from The Pusherman to Freddie’s Dead (note: maybe we are overplaying a theme, but excessive supplier chain risk can have a bad outcome). Those songs came out just ahead of the Stagflation years in the early 1970s, but they should have been re-released for China supplier addiction.
The upward path of China trade (notably imports) evident in the chart has been a dominant theme of global supplier chains across multiple industries. Before the crisis, the global automakers and Tier 1 suppliers could not brag enough about their expanded supplier chain exposure to low-cost countries. The joke was that they were going to start giving supplier presentations in Mandarin to stock analysts back in the 2004 time horizon. That certainly quieted down after the bailouts and bankruptcies and very high level of politicization around auto industry support.
We have seen some commentary over the years from trade experts and economists that the buildout of supplier chains in China and other LCC sourcing was a big part of the low inflation periods the market experienced even after all the fiscal and monetary support of the credit crisis years.
The flip side of that view is that fighting inflation and China at the same time will be very challenging as many companies also need to invest heavily elsewhere at home or abroad to mitigate the China geopolitical risk and reduce exposure. That takes money, and money comes from “price x volume” to fund the investment that allows an economic return on rising expenses. Capex demand will be rising as the supplier chain migrates elsewhere. That is certainly true in Electric Vehicles, which will also raise even more protectionist impulses and lead to clashes with China as the leader in the EV space.
Those sorts of intergalactic macro themes are about the big picture and the forward views that get spun up based on assumptions. Those theories have their inherent limitations as we have seen since the 1970s on debates over the “root causes” of inflation. Those inflation theories varied widely into the 1980s and again in 2021-2022 (it is about monetary policy only, it is about goods supply and demand and pricing power, etc.). Those debates are still unresolved even after those professors are long dead and buried. Those topics on trade deficits, supply shocks, and currency trends are for another day.
The political backdrop today is almost as important as the economic drivers of what is going on in US-China trade. If 2017-2020 had the catchphrase “Russia, Russia, Russia,” the 2024 election year will have “China, China, China” joining in the noise. This time Russia will be about the Ukraine War, and China will be about both trade and geopolitics (Taiwan).
World trade partners in context…
In the next series of charts, we shift over to Year-To-Date (YTD) statistics from the LTM used in the World Trade data above. We try to focus more on YoY deltas and what that might signify for a US market that has been in material Fed tightening mode since March 2022 with the UST upward migration and tightening battle as the leading theme in 2H22. We look at combined import and export trends for the Top 15 trade partners and then look separately at imports and exports.
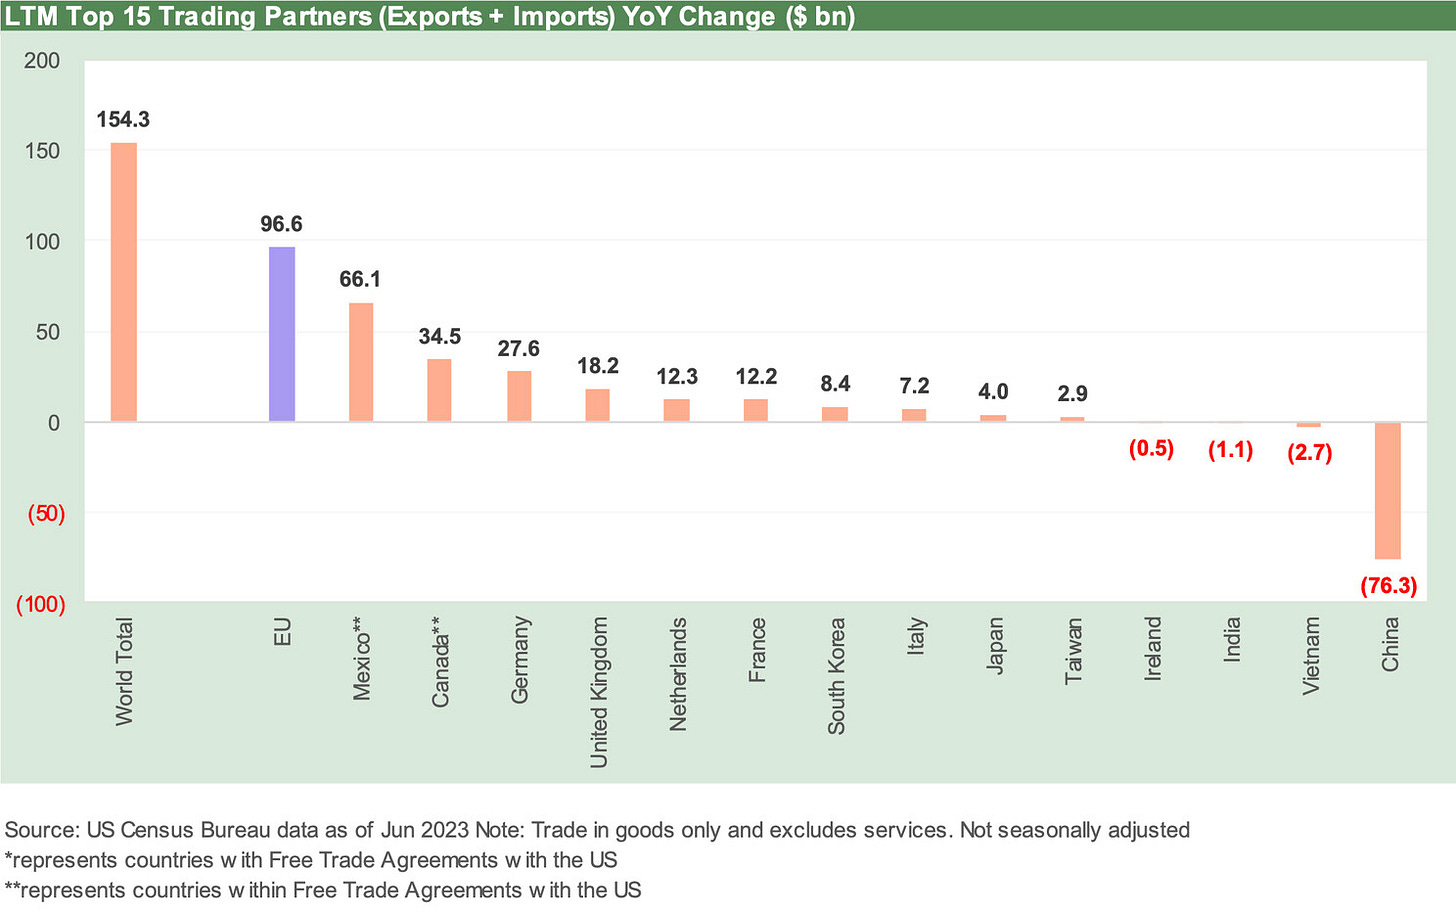
The above chart breaks out the YTD details in the Top 15 trade partners to the US and how the total trade (defined as Imports + Exports) lines up across the Top 15 trade partners. The Top 4 are over 60% across the #1 EU followed by the two NAFTA nations (we are sticking with NAFTA for tradition) and then China at #4. Below those Top 4 we break out the individual European nations with 6 of the 14 (excluding EU) in Europe, 6 in Asia-Pacific, and 2 in North America.
The EU and Eurozone essentially operate as a bloc, and thus the US cannot cherry-pick nations to target for bilateral negotiations. That frustrated the Trump team trade strategists. That is why the Eurozone was created and launched its common currency back at the start of 1999. Complaints around Germany having an artificially low currency have now become the sidebar talking point of B-Team protectionist economists in the US (e.g., Navarro, master of the Green Bay Sweep). The arrangement certainly favors Germany and German fiscal strengths have been an envy for many countries until recent years.
The post-Brexit UK is somewhat of a free agent at this point (removed from EU trade numbers at the start of 2020), but each European nation has its own set of economic dynamics that determine their import and export line items. Germany with its auto leadership and transplant base in the US (like Japan with auto industry strength and transplants in the US, Canda, and Mexico) and France with Airbus success each has a story. The drill down on industry groups is a lengthy and detailed process that we worked on in prior lives, and the two-way trade of countries with select US states also gets interesting (from aerospace to gold).
The fact remains that the EU is the #1 trade partner to the US and includes key NATO allies during a war in Europe, so there is a lot at stake in maintaining good relations. The US also needs some EU support in influencing Chinese behavior in trade. There is a lot to unpack under those headings, but that is not for this piece.
Reading trade publications on “trade” underscores the complexity of often conflicting needs across trade policy and unilateral interests that include a semi-embrace of multilateral rules (WTO). We started reading “Inside US Trade” and “World Trade Online,” and Petersen Institute publications back when Trump stoked up the tariff battles. The array of topics and trends are dizzying.
The above chart details the changes in LTM across the Top 15 trade partners. We also include the total change in US-World Trade volume, which rose substantially. The plunge in China volume stands out. That has led to theories on how the Chinese economy will feel that pressure given the direction of their imports. The rise in EU trade with the US is again in evidence with EU #1 in both imports and exports for US trade.
Whenever anyone looks at trade deficits, it is always critical to look at both imports and exports and what might drive the underlying change. The ironic impact of a strong or improving US economy is that imports usually go up and trade deficits along with it. In other words, with all else being equal, complaining about trade deficits while bragging about the economy is pretty dumb for a leader of the leading consumer nation. The foolproof means of lowering imports is to cause a recession, but that seems like a bad plan for election purposes.
As those who pay attention to history or industry level restructuring know, it takes years to restructure global supplier chains whether it be building up global low-cost chains or retooling the supplier base to more friendshoring and reshoring. It is not a frictionless wheel or a simple whiteboard exercise. You also can intrinsically run afoul of WTO rules that the US helped create long ago but where the US is now blocking dispute resolution. That is a tricky process.
The top-down numbers on China trade are always daunting, and the facts are as important as it gets in framing economic risks. We will need to drill down further in separate pieces on the political and economic risk factors since it runs from aerospace (the commercial aircraft battle of Boeing vs. Airbus) to autos (supplier chain broadly and the chips threat narrowly) to healthcare (China as a critical part of the supplier chain dependence few want to talk about in Congress as the rhetoric beats up China).
The systemic significance of China as a lower cost supplier of just about everything from high value added to low value added is an overwhelming challenge that has fallout for key US sectors with agriculture and aerospace right at the top.
The import factor…
The above chart highlights the Top 15 trade partners in imports YTD with the EU at #1 and China at #2 ahead of the legacy NAFTA nations. An important consideration in looking at the leading trade partners in imports is to consider who owns those imports with the NAFTA/USMCA trade flows involving a generous amount of product owned by US companies and notably so in autos. Captive assembly operations set up in Mexico are part of the labor cost arb that angers US labor interests and political figures supportive of unions.
The auto transplant operations of Japan and Germany are important variables in the import picture since many of the line items are tied into supplier chains that feed into the US operations of German and Japanese OEMs. Those transplant operations do assembly in the US but have not relocated all supplier chains. The same is true for Korean OEMs. Those decisions can revolve around currency trends and embedded capital investment in the home country.
Despite the trade deficit the US sees with those countries, those investments in the US brings jobs, supports manufacturing investment and services (e.g., freight and logistics), generates financial services business (retail, wholesale), and supports downstream dealer investment (F&I, real estate, etc.). Those deficits bring GDP multiplier effects within the borders.
The rhetoric of recent years often mixed economic ignorance (willful or inadvertent) with a dash of xenophobia when in fact those trade deficits were rooted in accretive economic activity. The bulk of transplant additions were in right-to-work states with a red political tone, so the tariff threats to those nations from the White House were strange. The Chamber of Commerce (a GOP advocacy group if there ever was one) was firmly opposed to the tariffs.
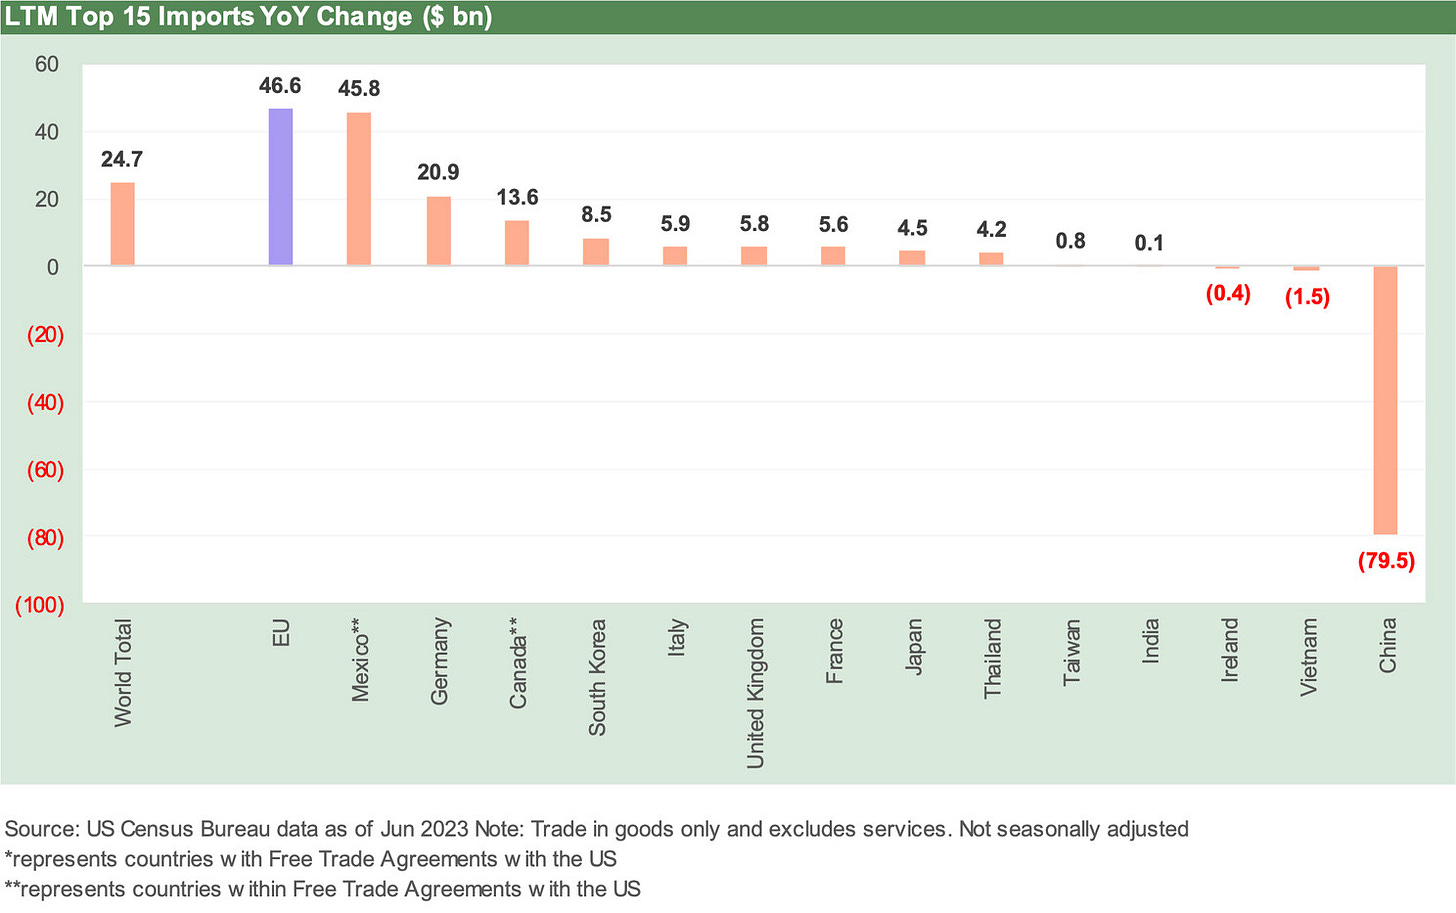
The above chart updates the LTM YoY deltas in imports across the Top 15 trade partners. We post the World Trade change on the left. We line up the trade partners in descending order of import increases from left to right with China deeply in the negative range on the far right. That is a lot of lost revenue for China.
The export factor…
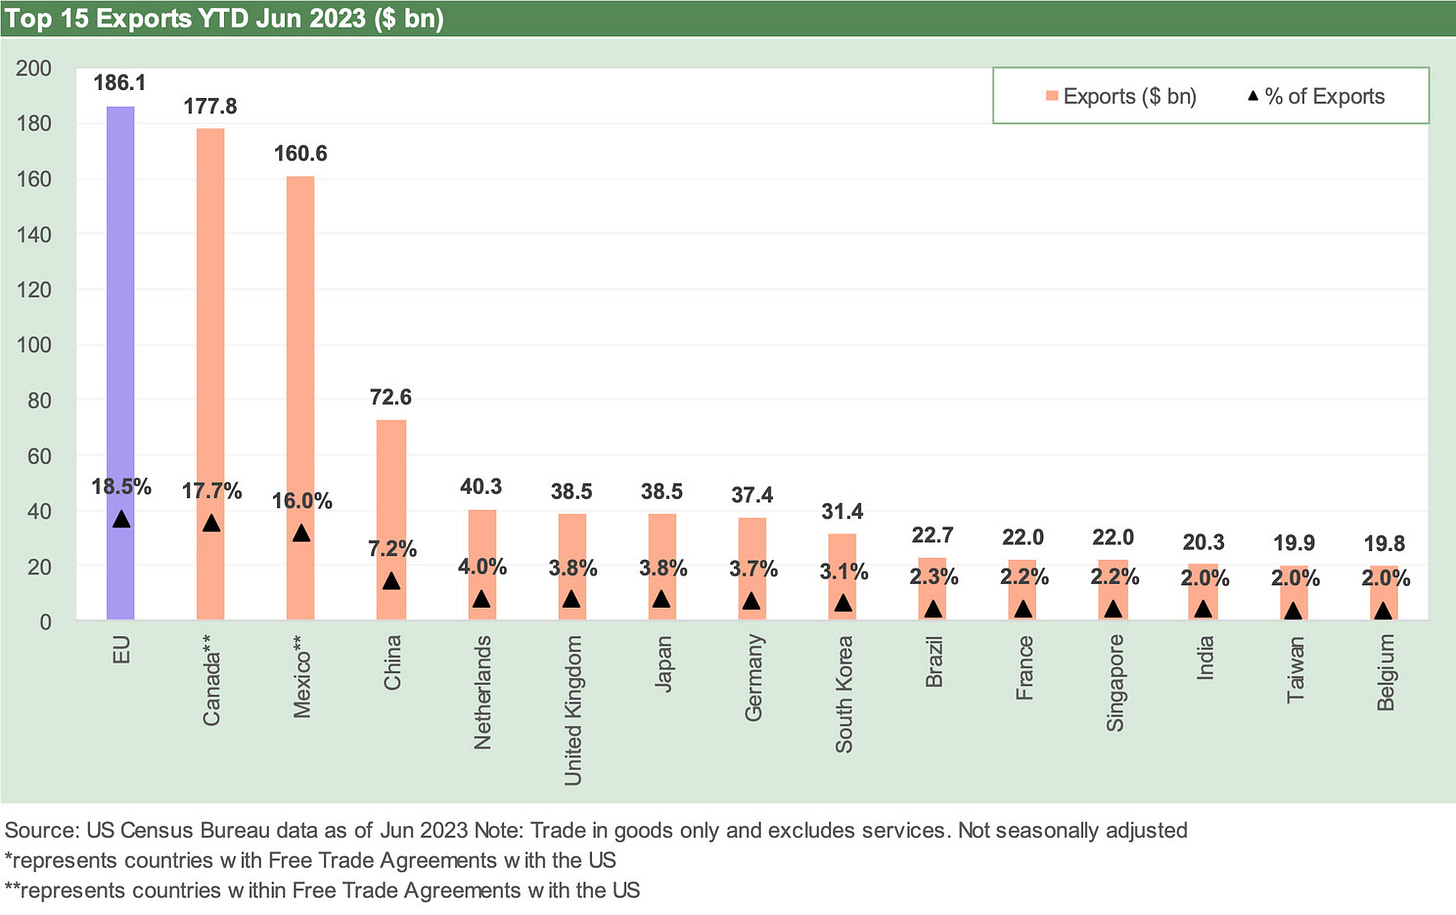
The above chart details the YTD exports volume in dollars and as a % of total. We see the EU again at #1 ahead of the NAFTA nations. China is only 7.2% of exports at #4 vs. 15.5% of imports at #2 behind the EU.
Overall, the trade deficit and trade partner reviews were a routine exercise as Trump rolled in aggressive tariffs. The exercise quieted down, but the clashes with China and a new election cycle will bring it back as too many Washington types need to show they are tougher on China than the next guy.
More clashes can set off even more trade dislocations and then the handicapping begins again on China economic risks or industry level turmoil. A severe dispute that starts to look like decoupling could set off bigger jitters, fears of supply driven inflation, and more rigorous analysis of shortages. The auto lots and the local pharmacy could get worried.
The above chart updates the LTM YoY change for exports with very few posting small decreases. China trade volume deltas are all about imports and not exports. Favorable export variances with the EU are impressive and we see solid increases with the NAFTA partners also.
Trade analysis is a bit of a grind but if you say China and America first, the topic will quickly become more about political and economic axes and less about facts and concepts.


