
August Existing Homes Sales: Same as It Ever Was
We look at the repetitive nature of the August existing home sales.


The soft existing home sales got a little softer and existing home inventory edged lower again in what is a recurring theme.
The status quo of supply-demand imbalances drove another month of median home prices above $400K as prices rose by +3.9%.
With more headlines calling for 8% mortgage rates to arrive again before a return to 6% handle mortgages, the home buyer or home seller moods enter the “off season” with a case of the blues while homebuilders have a mitigating story line around their market share of total home sales.
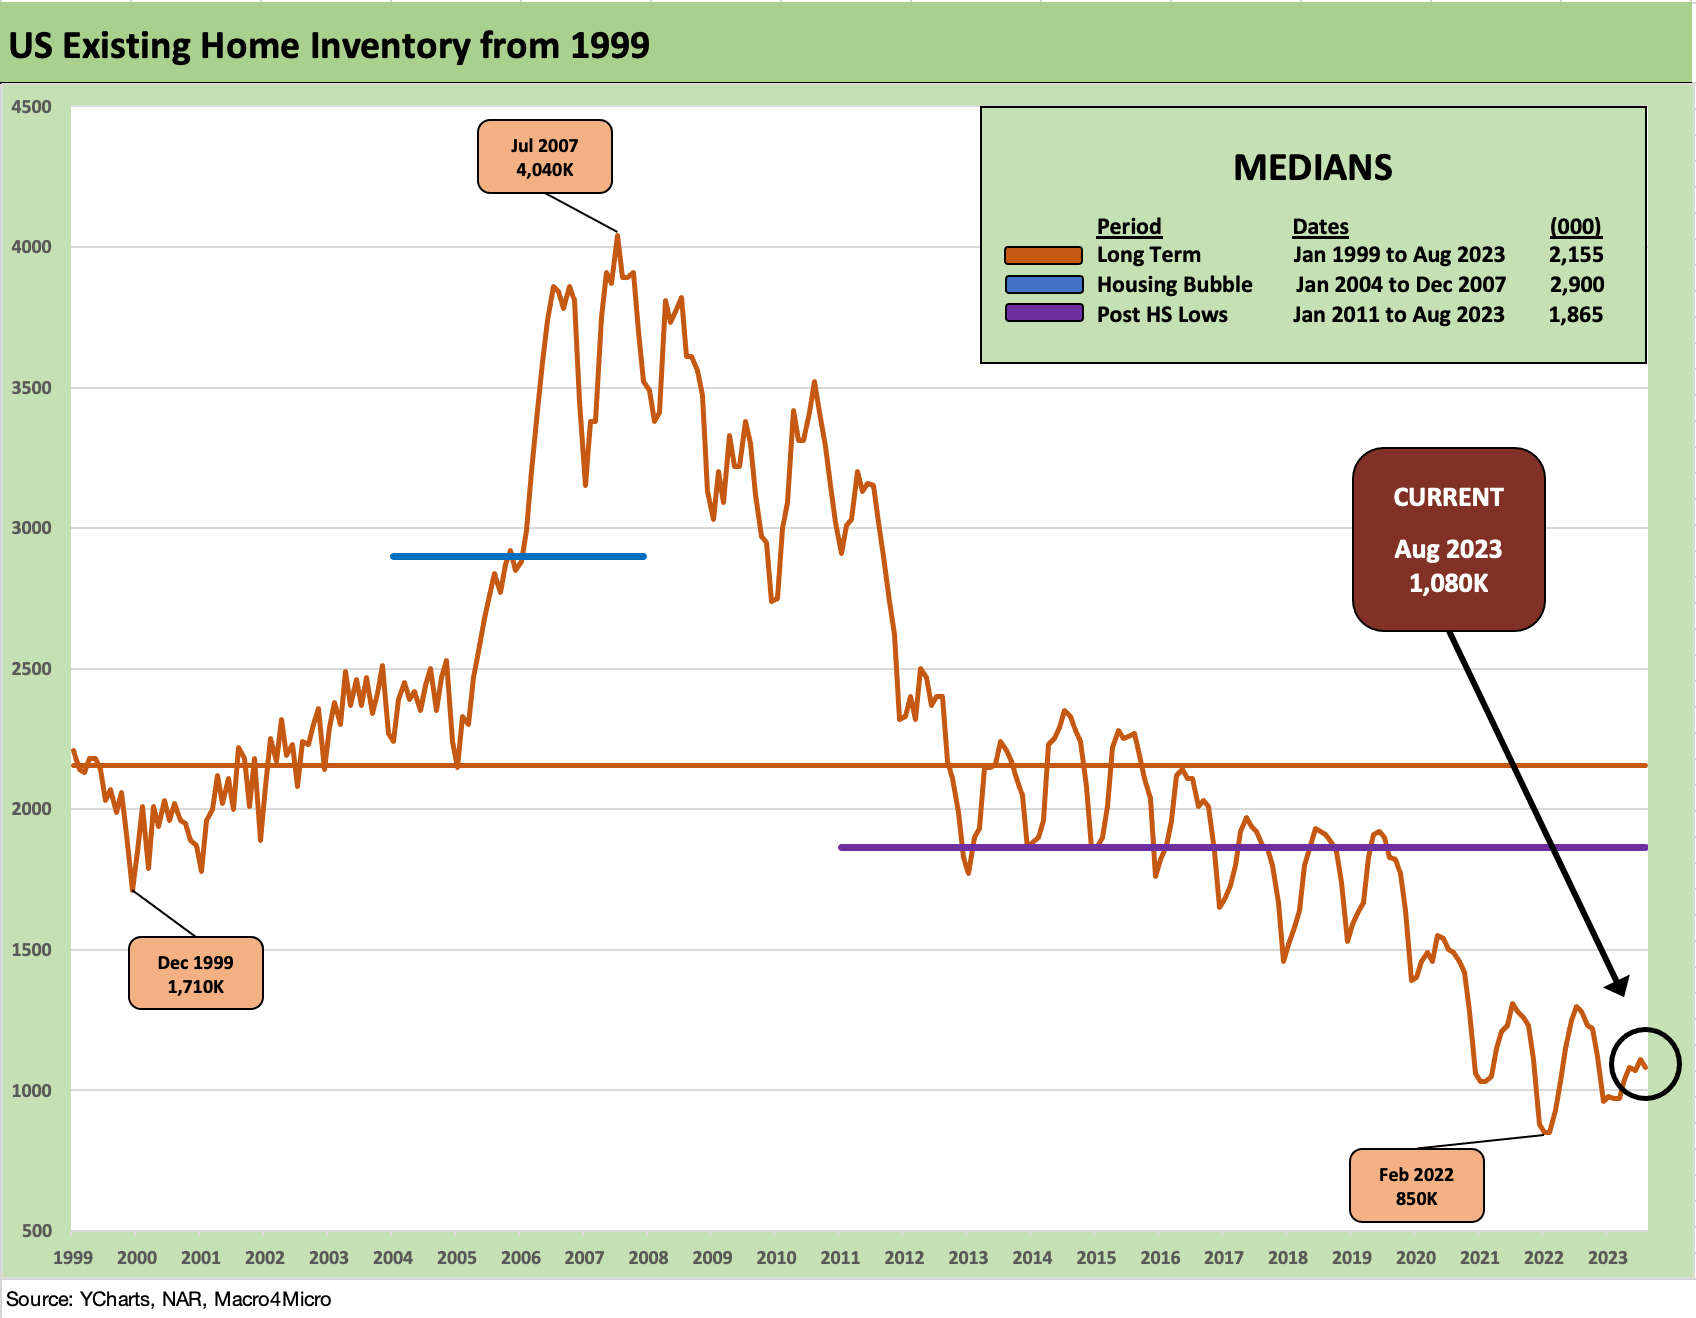
The above chart updates the inventory stats in a market where housing demand remains strong but affordability nightmares for buyers and the golden handcuff effect on sellers is keeping supply and volume in the tank. While 1.08 million is off the lows of Feb 2022 when 850K was on the market, we are now exiting the peak selling season and heading into a period where mortgages could go in the wrong direction.
Whether the consumer sector and the economic cycle also head in the wrong direction is part of the broader cyclical discussion. There was little in the FOMC news this week to get anyone excited about a sudden surge in affordability (see FOMC: Higher for Longer, Confused for Shorter 9-26-23). The 10Y UST is notching up again today to new highs. That is not helping the headlines around where the 30Y mortgage rate will be heading.
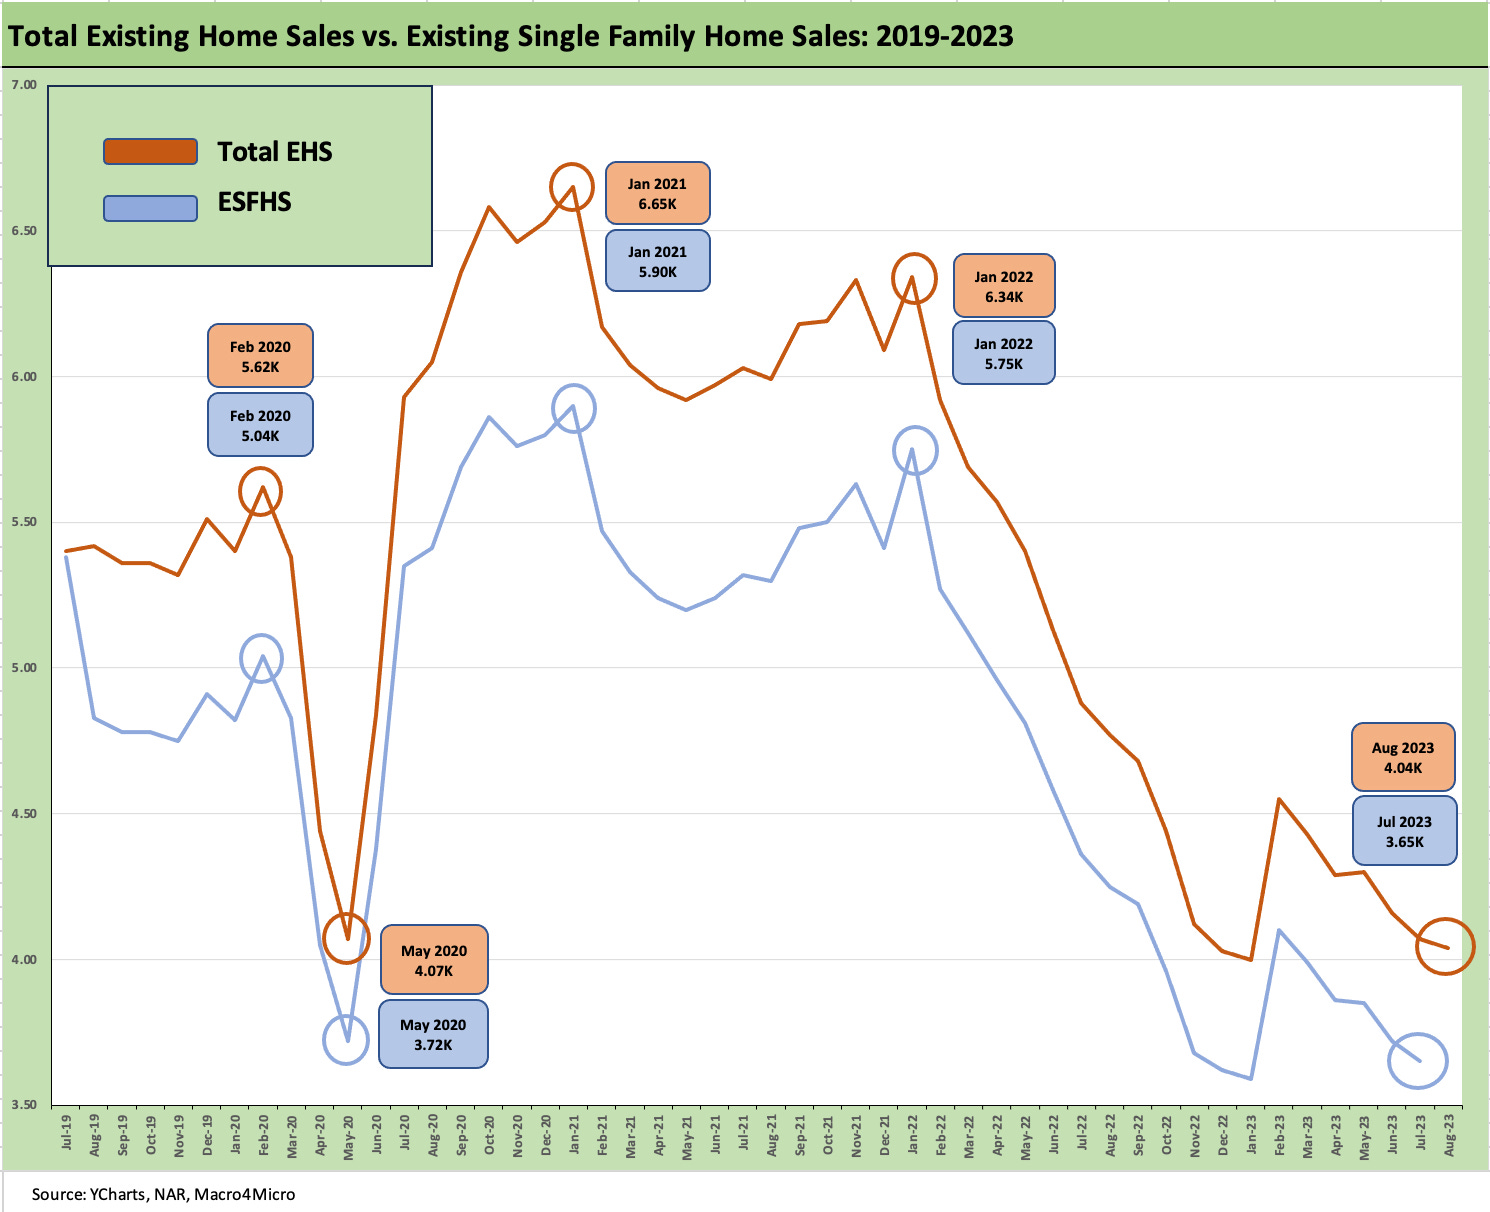
The above chart frames the time series for total existing home sales (including single family, townhouses, condos, and coops) vs. existing single family homes. The two lines offer some nuance on the same broad trend – as in low supply and low activity in historical context. Current volumes are more like the pandemic months, and the overall story is more of the same.
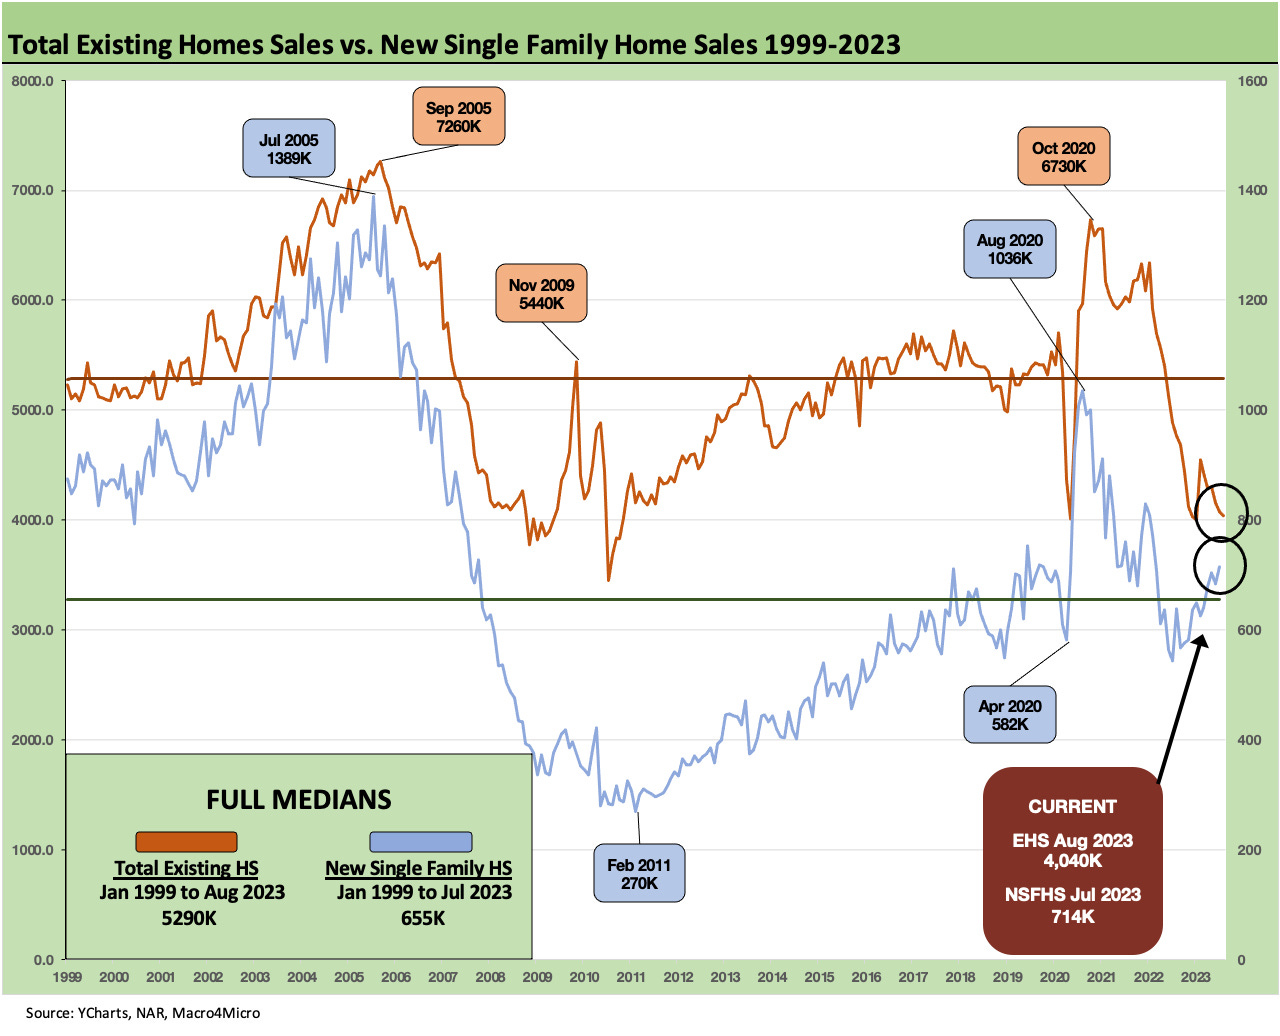
The above chart updates the timeline for total existing family homes vs. new single family homes. We will get the updates for new single family home sales in the release next week, but the trend has been clear enough with builders picking up share of the total home sales numbers. The ability of the major builders to use a range of incentives and lean on their mortgage operations for creative buydown solutions (fees, rates, etc.) is an edge they have proven out in the marketplace.
The mortgage incentive principle is similar to auto financing incentives but with bigger numbers. The personal decision for the homebuyer on how much risk to take on theoretical refinancing risk down the line is part of a more complex homebuyer decision point.
Another decision point is whether to pay more cash on the down payment and use a lower LTV. Many have paid all cash for their house if it is a priority to buy now, and they will wait to refi. That obviously is an option for only a minority of buyers.
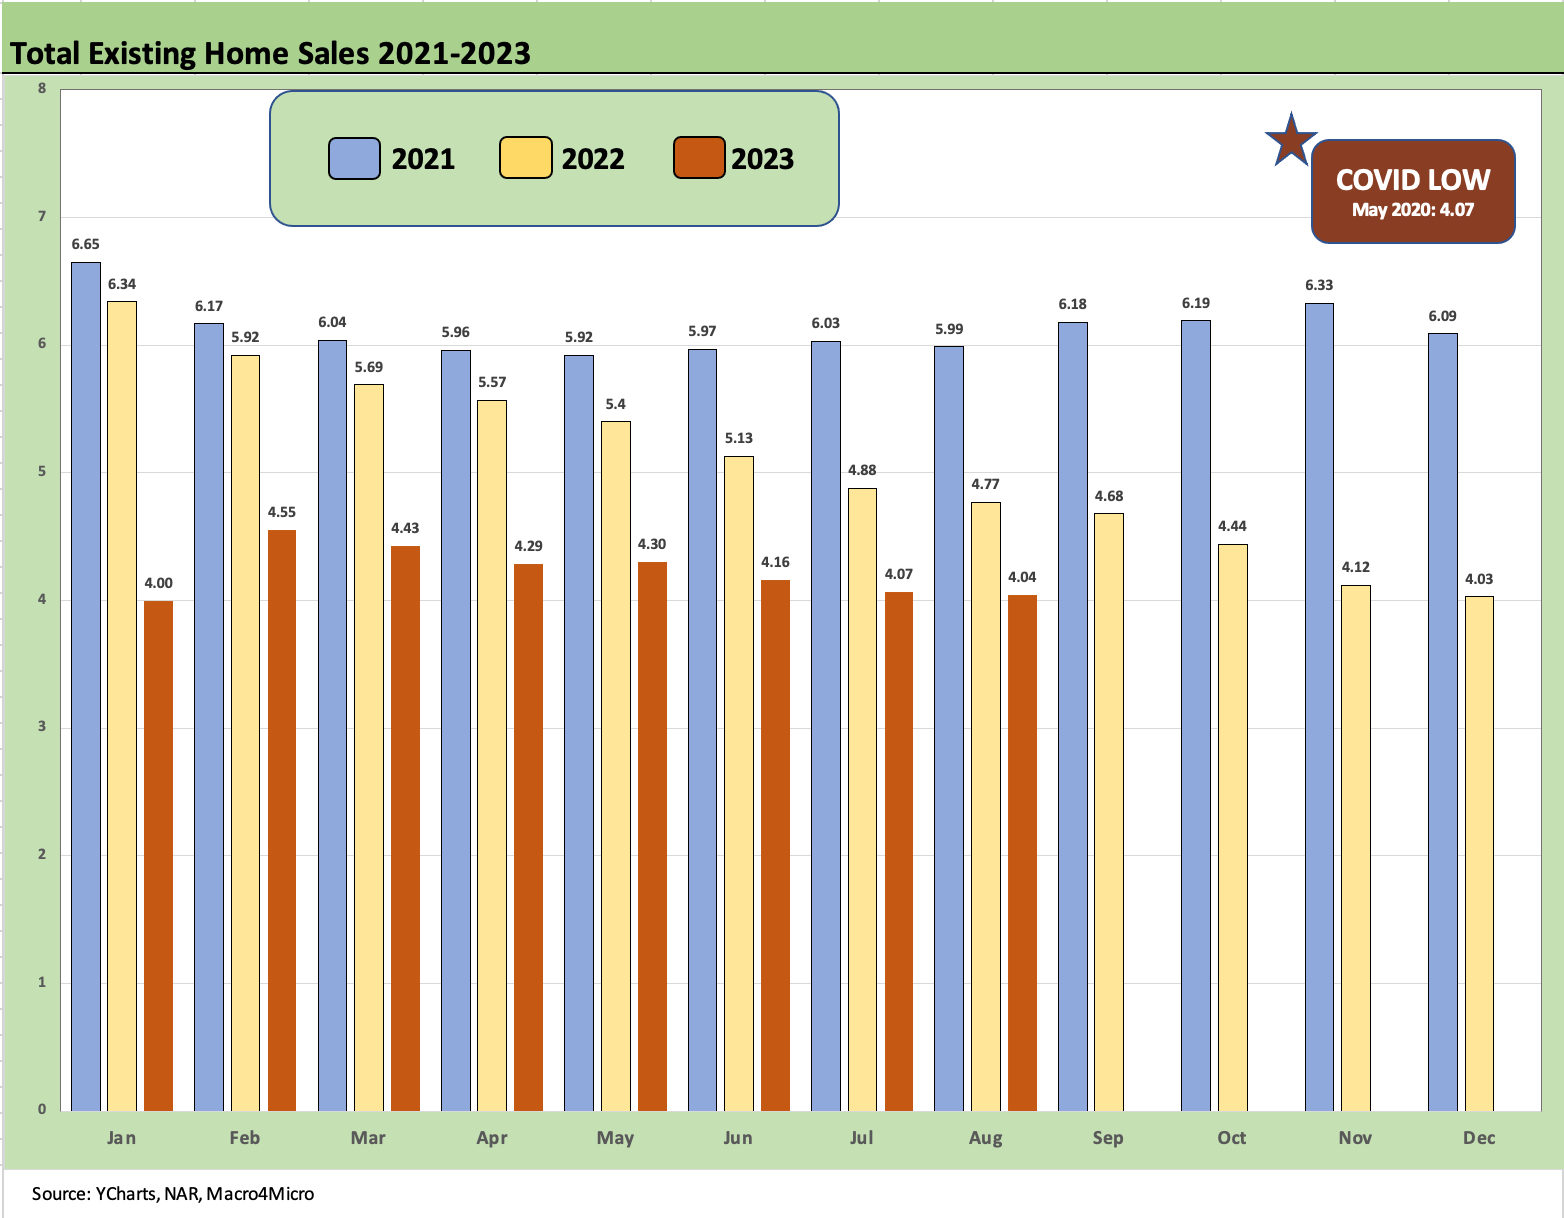
The above chart updates the total existing home sales bar chart, and the visuals are ugly enough at a glance with current numbers below the COVID low of May 2020 but up from the lows of Jan 2023. We are a long way from 2021 levels.
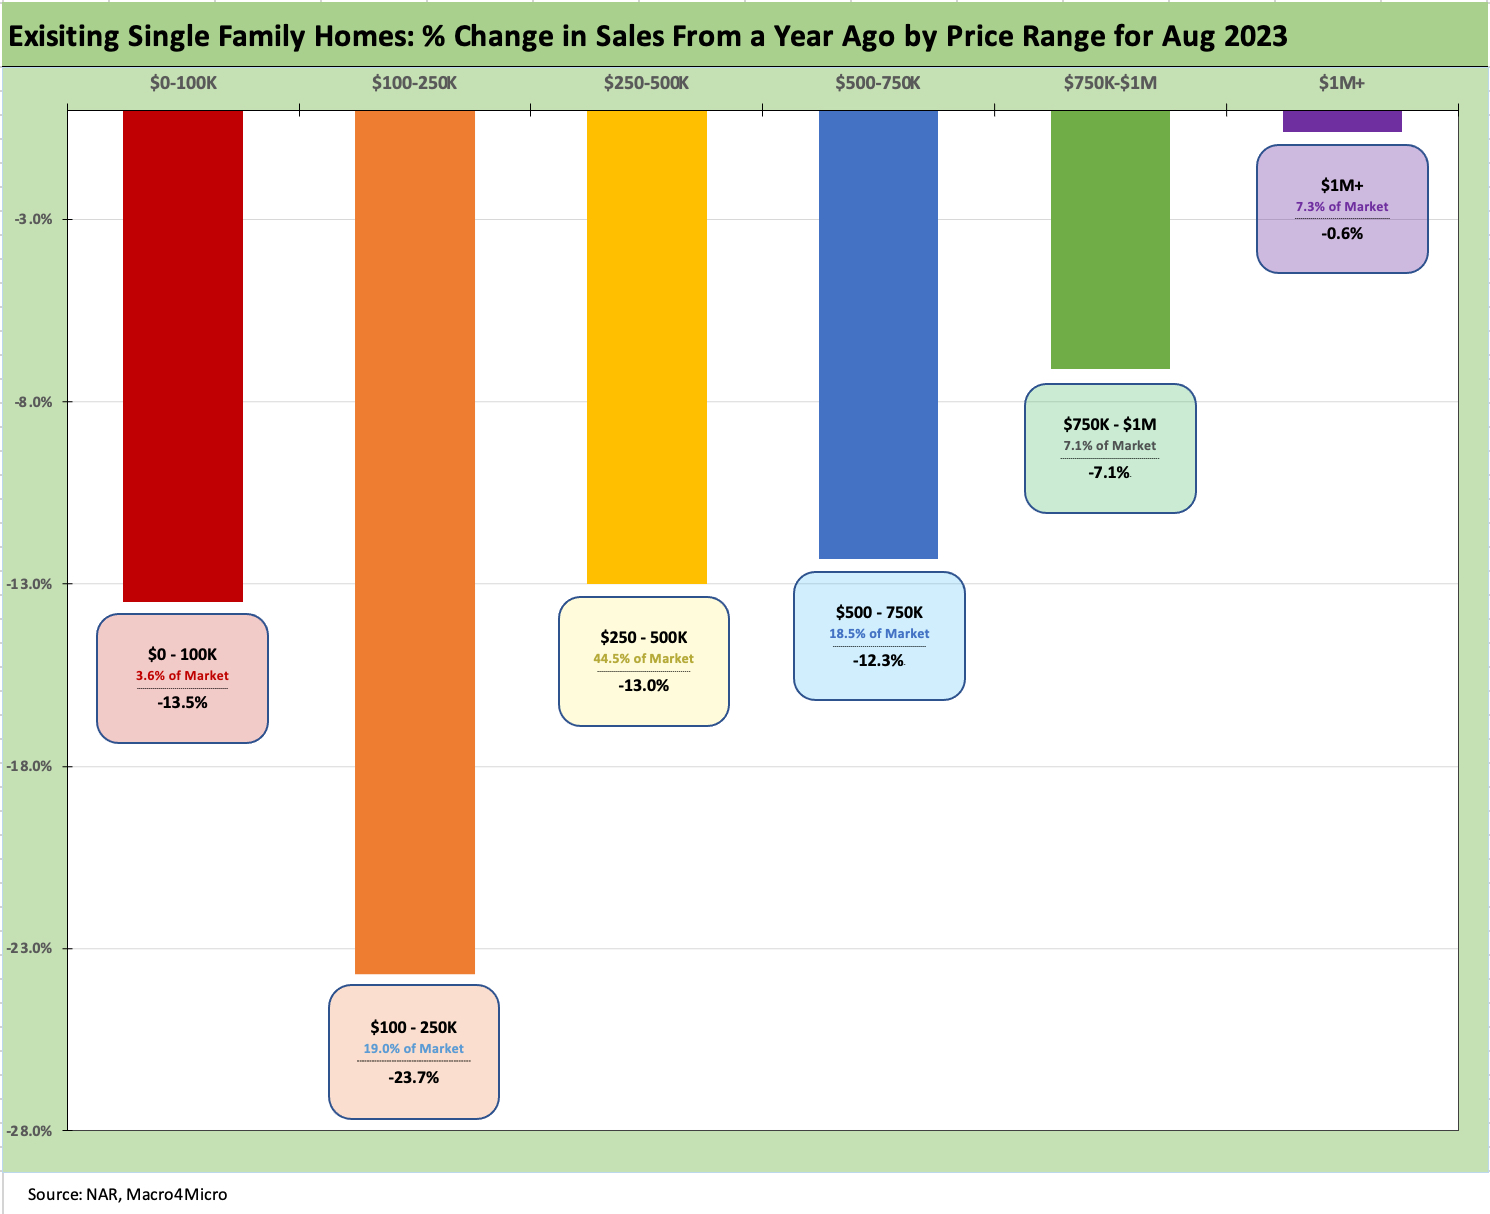
The above chart updates the trends by price tier and details the relative share of the various price range buckets. The sweet spot of the market in the $250K to $500K band that comprises over 44% of the market was down by -13% YoY. The comps for YoY are vs. an ugly period of tightening and cyclical anxiety in 2022, so the existing home sales backdrop is bleak today.
The high price crowd over $1 mn is only 7.3% of the market but is showing better YoY comps. We got a taste of that in the Toll Brothers quarterly numbers for newly built, high-price homes and the profile of their customer base (see Credit Crib Notes: Toll Brothers (TOL) 9-11-23). They are a unique builder among the majors.
The $100K to $250K range underscores the affordability challenge on the entry level segment with volumes down -23.7%. The impact on monthly payments is straining lower-tier buyers, who are more likely inclined to wait. Meanwhile, the sellers of those properties are holding off on move-up trades for many of the same reasons.
The economic logic in the lower-priced tier is clear enough, but that segment has the added worry that the economic triggers for lower interest rates include a recession. That makes for a “heads I lose, tails I lose” proposition for many households. There is a reason many multifamily projects are under construction targeting the rental market.
Recent Research:
Housing: Sequential Starts Ease, Permits/Completions Mixed 9-19-23
Credit Crib Notes: Toll Brothers (TOL) 9-11-23
Credit Crib Notes: D.R. Horton (DHI) 8-29-23
Credit Crib Notes: Anywhere Real Estate (HOUS) 8-24-23
Existing Homes Sales: Inventories Stay Tight, Prices Solid 8-22-23
Housing Starts and Permits: Single Family Advances, Multifamily Backpedals 8-16-23