
August New Homes Sales: Feeling the Burn Yet?
August new home sales highlight the push-me-pull-me mix of factors in housing.


August showed weakness sequentially in new home sales but positive growth YoY as the new home sales numbers absorb more than a few push me/pull me effects that still add up to net progress with housing supply-demand dynamics still on the builders’ side.
We see “inventory months” rising at the slower sales rate, but the release saw an uptick in homes sold that have not been started yet as the picture has some moving parts.
With some surveys of 30Y mortgages showing a 7.5% rate for some national average benchmarks (highest in more than two decades), the pressure is not easing in that last stretch of a housing season that has been prolonged into the fall since COVID.
Monthly payments are all about mortgage math, but builder creativity and sheer excess demand for housing relative to supply keeps the builders at least in the game even if still struggling relative to potential.
In the picture for today’s commentary, we went retro with Jane Fonda since the early 1980s was the last time the housing market had such a rate hangover. That was the last time the yield backdrop and inflation had come off such an ugly stretch (Her original workout video was 1982. I have to admit I was not a fan while watching the Paris peace talks on TV, but she grows on you over time).
The time-honored question the early 1980s as now is “how much house will my dollar buy, and how much house am I willing to settle for in the town or neighborhood I want to buy in.” There are a lot of factors to roll into the home buying decision at times like this around price, downside price risk-reward symmetry, the size of the down payment, the time horizon to refinancing, and more.
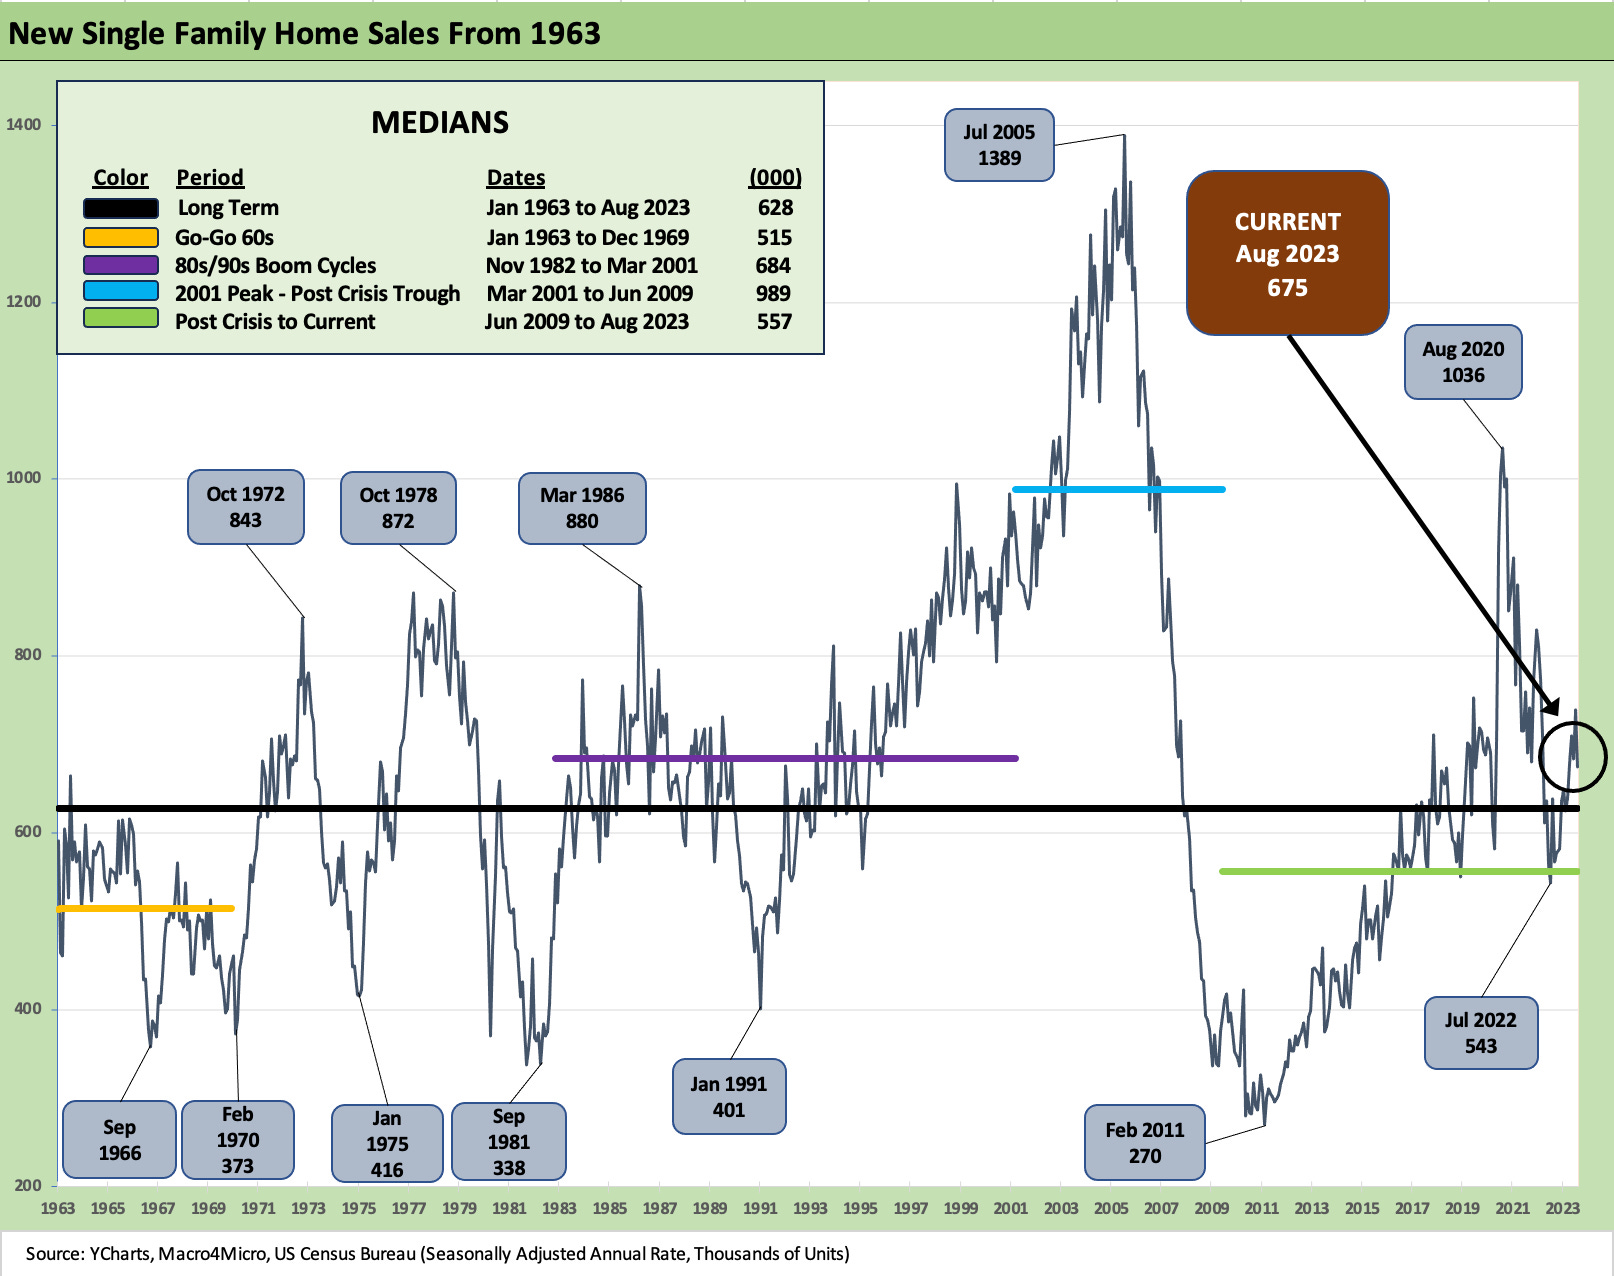
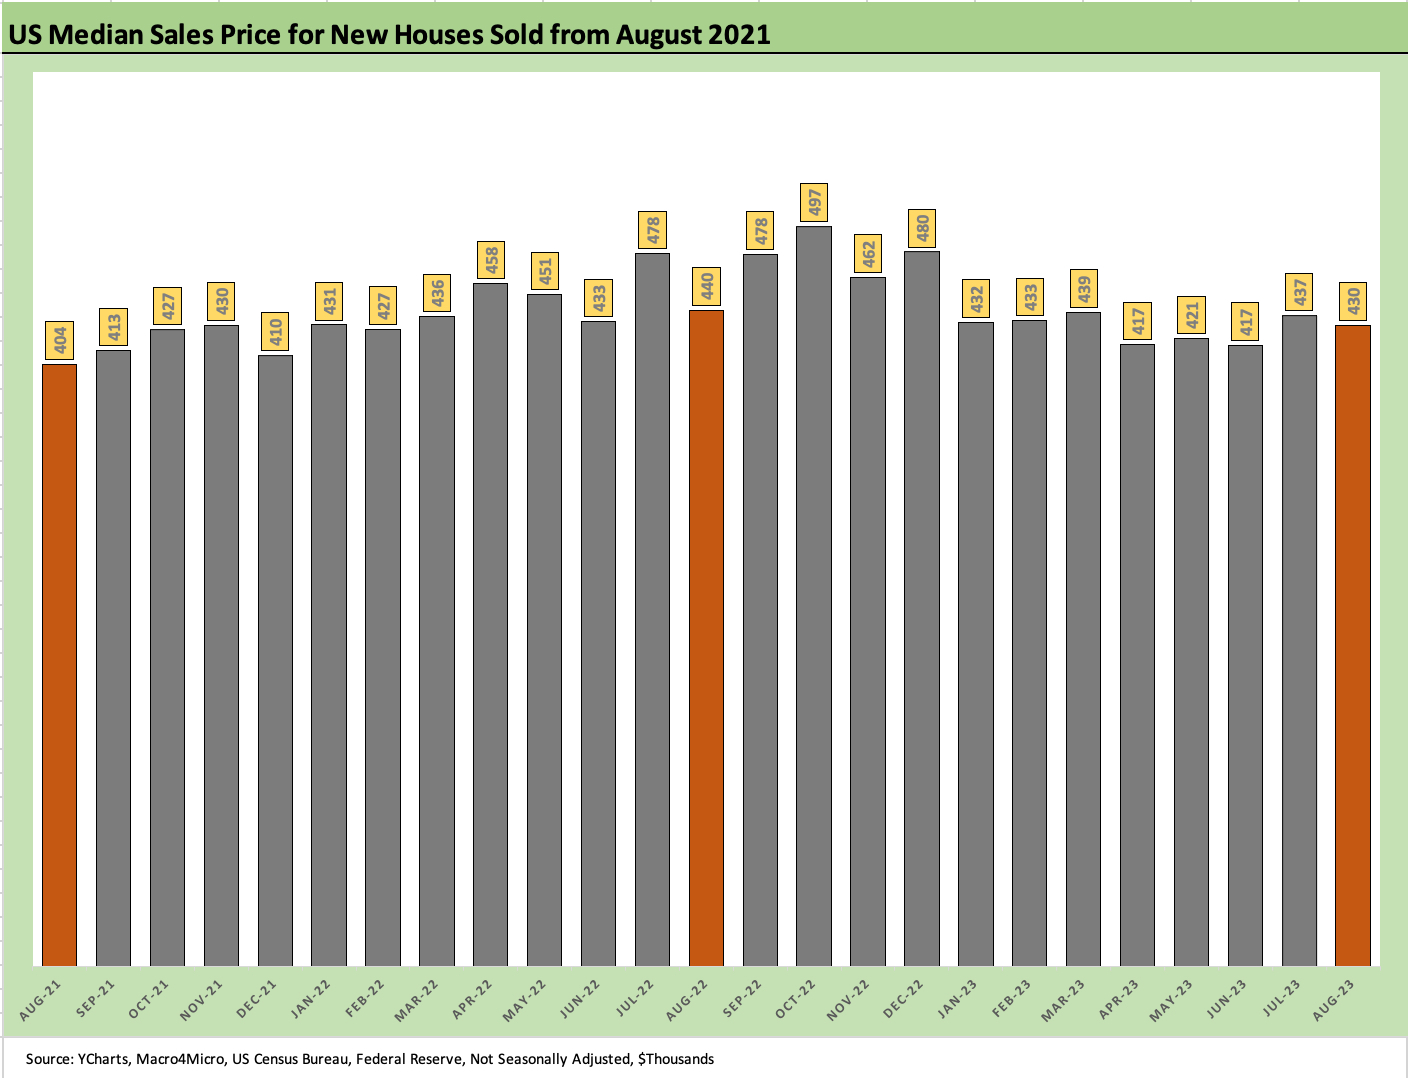
As detailed in the chart above, August saw a sequential dip of new single family homes by -8.7% from July 2023 and +5.8% increase from Aug 2022. That sums up the strange run for homebuilders.
As 2022 wound down, the lag effects of earlier signed contracts rolled into the damage of the brutal Fed tightening cycle and upward UST shift of 2022. Backlogs plunged but the supply-demand shifts kept favoring new homes in the overall mix as we have covered in other commentaries for some bellwether names (see D.R. Horton: Credit Profile for a deep dive on the #1 builder).
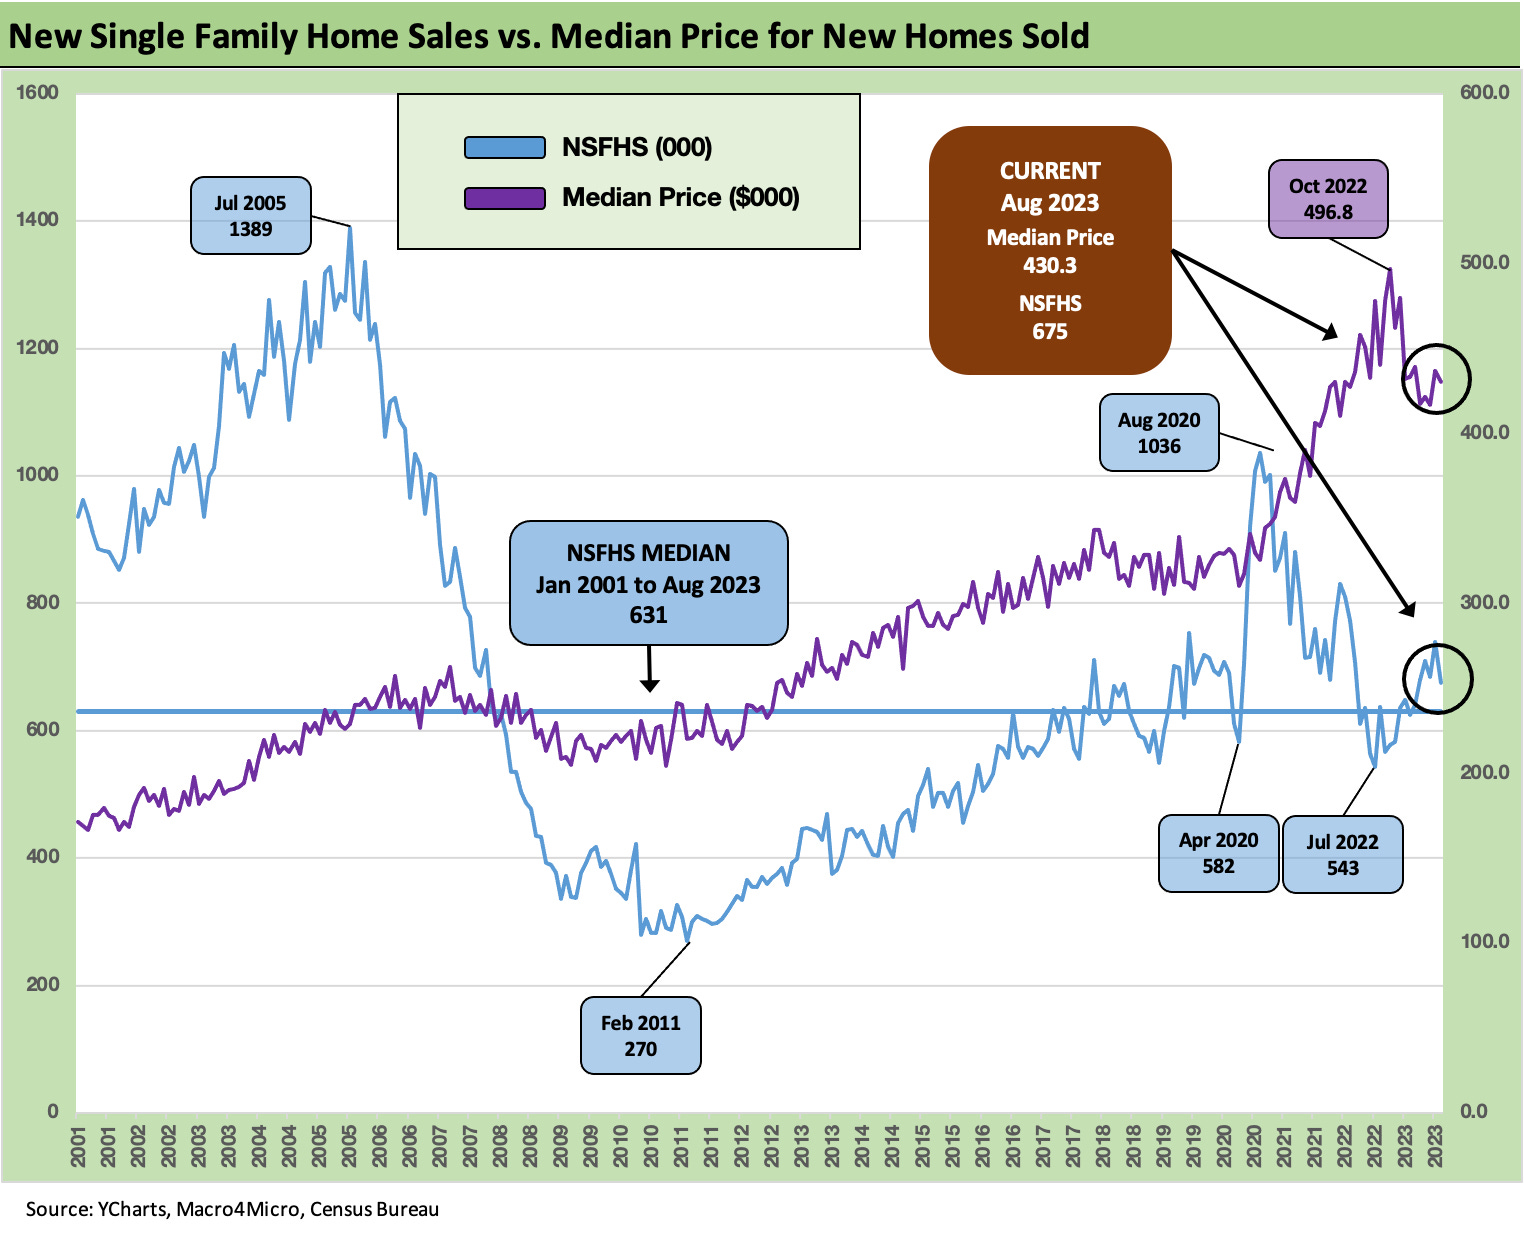
The chart above plots new single family sales volumes vs. price in a two-sided chart. High prices at volumes not far above the median show the resilience of demand and the effects of light inventory that will stay light.
As we have covered in our expanding homebuilder coverage and other housing macro notes (see links at bottom), the mix of incentives (mortgage buy-downs, fees), more favorable supplier chain fundamentals, a protracted consumer recovery, the usual favorable demographic factors, and a serious struggle for existing home sales supply (see August Existing Home Sales: Same as it Ever Was 9-21-23) all help blunt the force of what is an ugly shift in affordability.
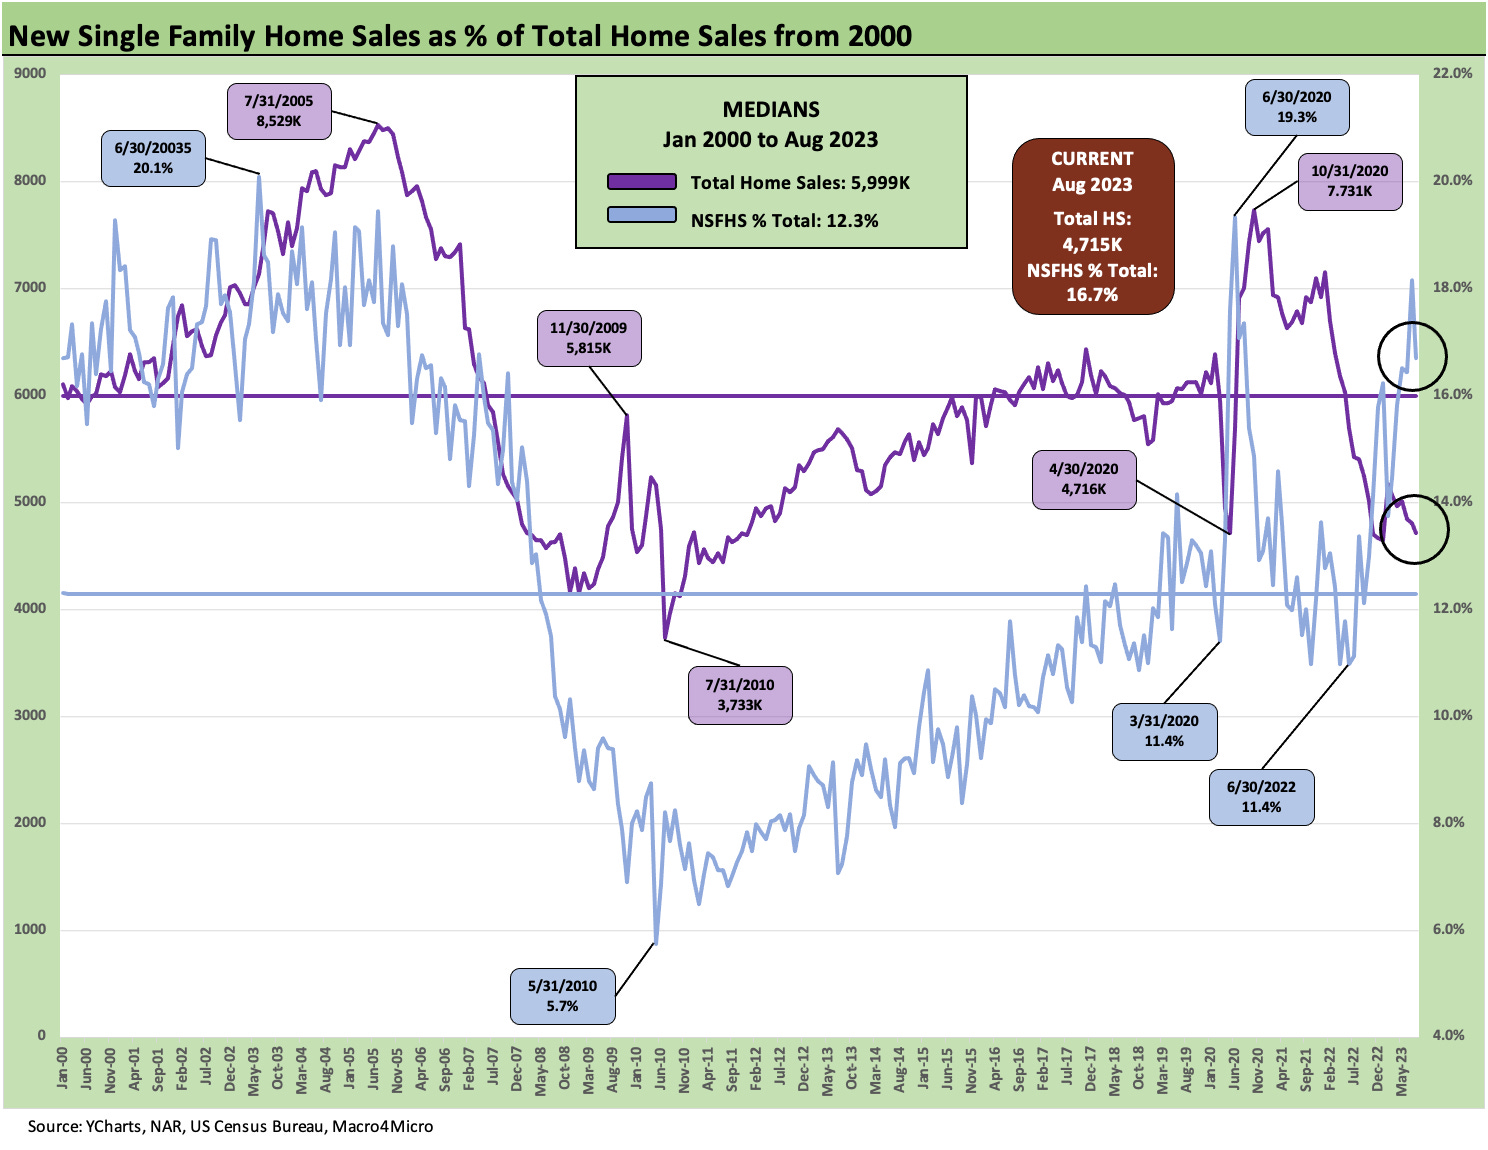
The above chart is another two-sided chart that updates the higher share of total home sales captured by new home sales. New home sales are up to 16.7% vs. a Jan 2000 to Aug 2023 median of 12.3%.
The builders are basically “performing with a net” in that they control their supply, and they know how to make a given house design in an area that will clear the market at a reasonable margin. They have captive mortgage businesses under their control or affiliated through joint ventures or alliances that can be rolled into various incentive packages (buy-downs, etc.). That edge helped propel homebuilders into the high end of the industry rankings in YTD stock performance in 2023 (See Footnotes & Flashbacks: Asset Returns 9-24-23).
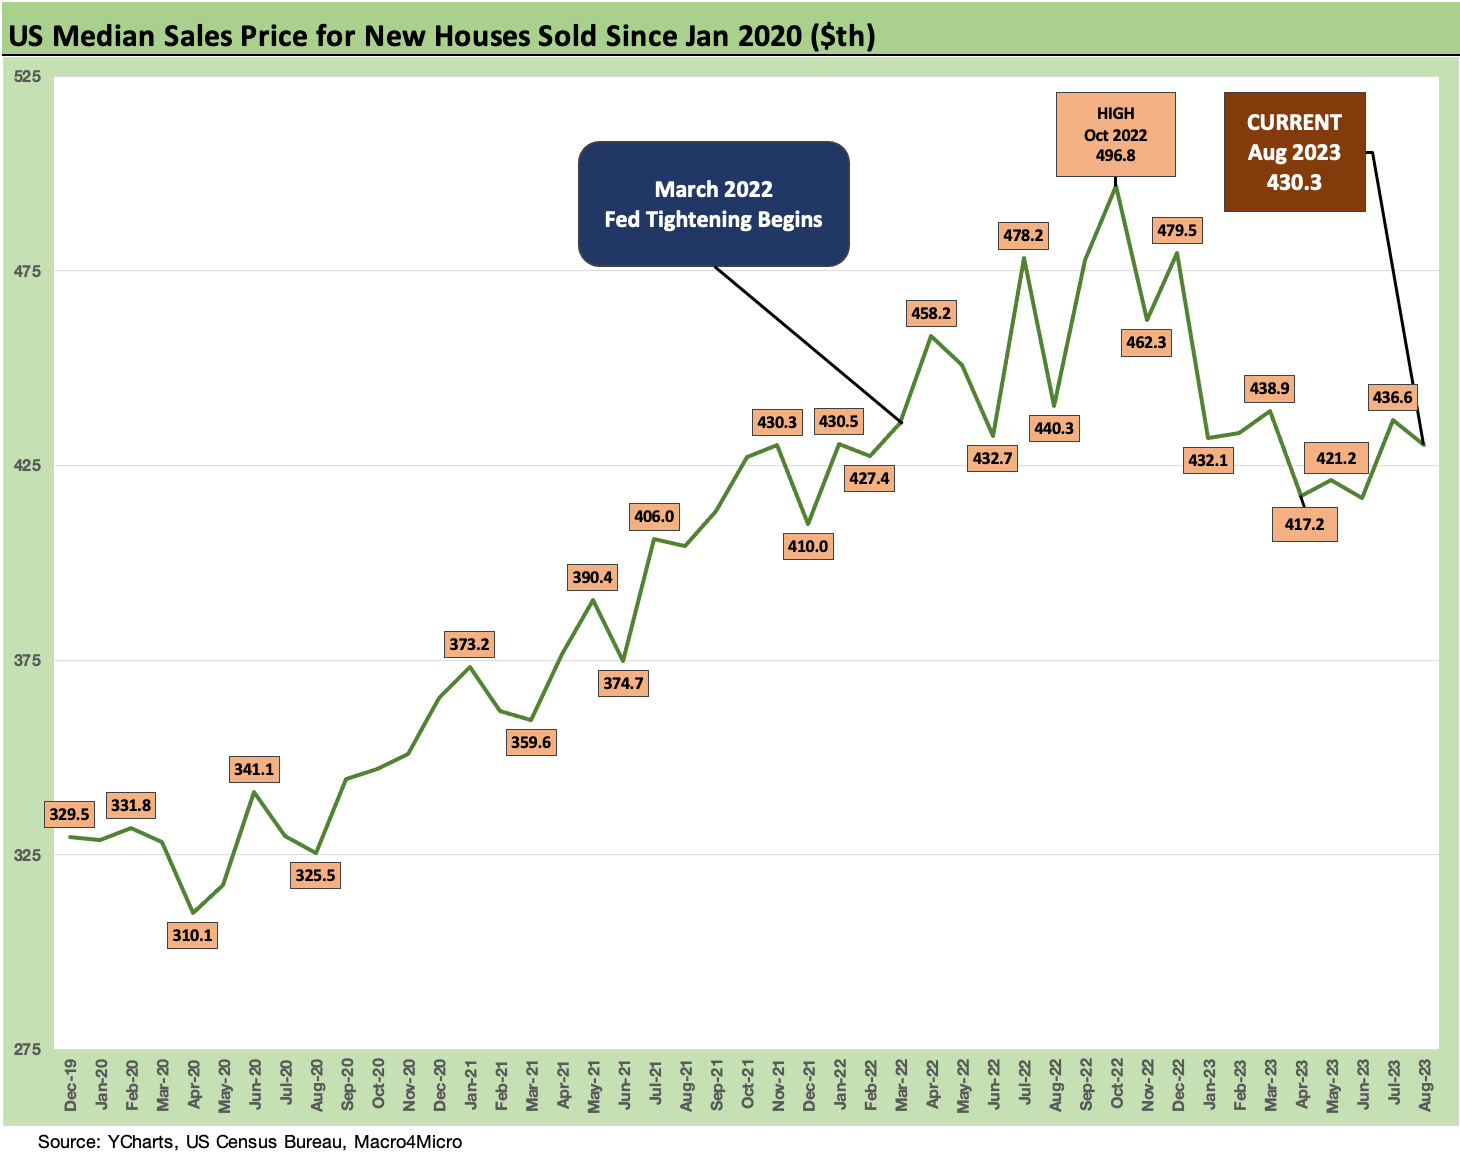
The chart above and the one that follows gets into the weeds on median home prices, and the main takeaway remains that house prices have been resilient despite the adverse trends in affordability.
The recent results for even the highest price homebuilders have hung in well enough (see Credit Crib Notes: Toll Brothers (TOL) 9-11-23 ). The real pain has shifted in 2023 to those who live and die by existing home sales (see Credit Crib Notes: Anywhere Real Estate (HOUS) 8-24-23).
Recent Research:
August Existing Home Sales: Same as it Ever Was 9-21-23
Housing: Sequential Starts Ease, Permits/Completions Mixed 9-19-23
Credit Crib Notes: Toll Brothers (TOL) 9-11-23
Credit Crib Notes: D.R. Horton (DHI) 8-29-23
Credit Crib Notes: Anywhere Real Estate (HOUS) 8-24-23
Existing Homes Sales: Inventories Stay Tight, Prices Solid 8-22-23
Housing Starts and Permits: Single Family Advances, Multifamily Backpedals 8-16-23