
Footnotes & Flashbacks: Asset Returns 9-24-23
The market sees another bruising week with curve damage, some tech swoons, and broad weakness across industry ETFs.


The UST curve and the weakness in broad market benchmarks (S&P 500 and NASDAQ) made for another bad week with the reaction to the FOMC the biggest negative.
The government shutdown chatter and the escalating UAW strike will be a bigger factor this week, but the end of the week brings another look at the Fed’s favorite inflation benchmark (PCE).
We add in the YTD performance for the ETF mix this week as we soon roll into the 4Q23 season.
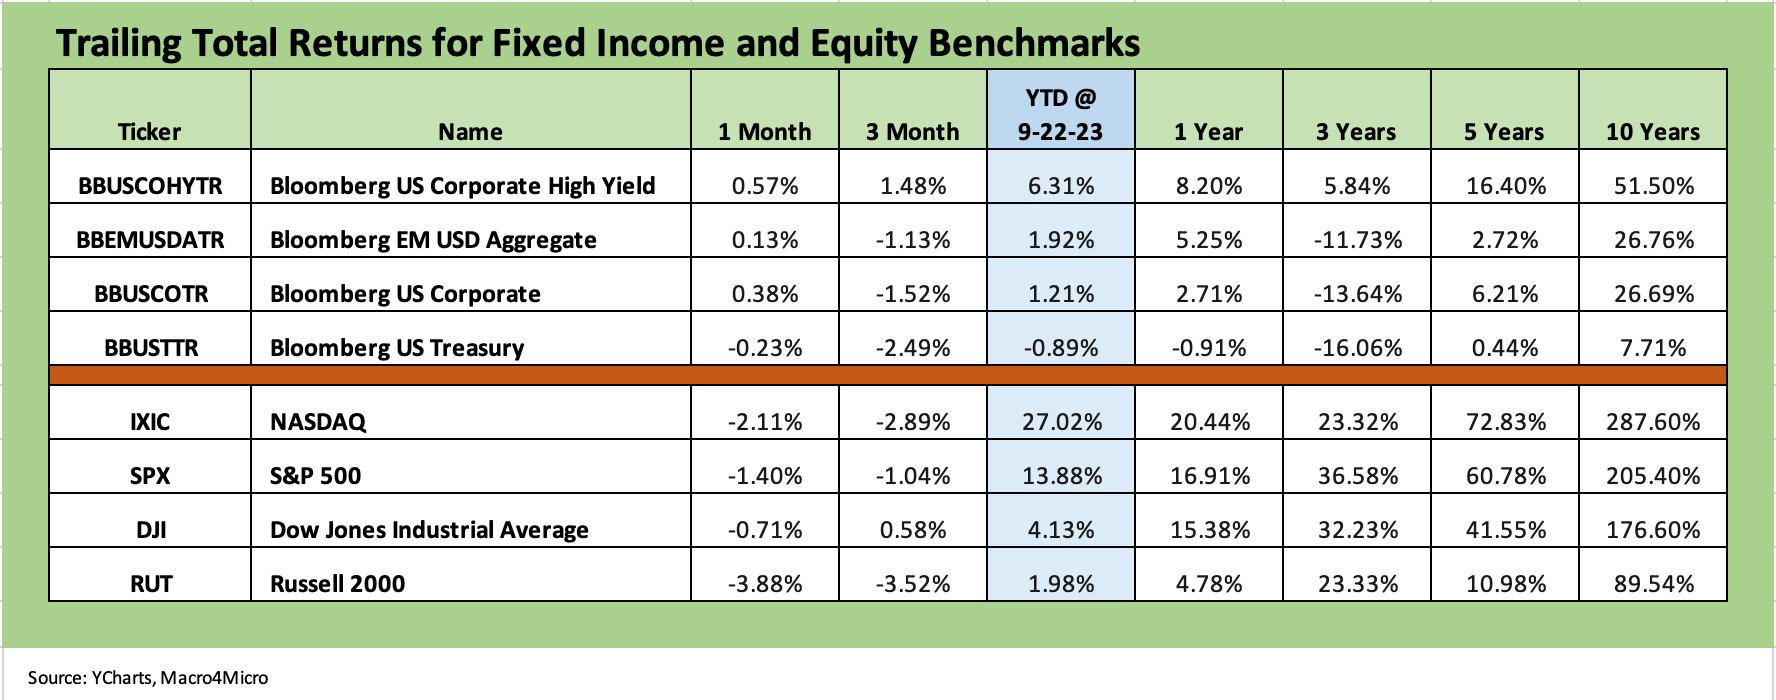
The above chart updates our debt and equity benchmark returns, and there is not much good news to report in the most recent trailing time horizons. In fixed income, we see a weak trailing month set of numbers and 3 of 4 negative for the trailing 3-month period.
The adverse duration moves are clear in the UST line and trailing time periods. US HY is still riding the big spread narrowing of 2023 from earlier in the year and lower duration exposure. HYG is over 6% YTD and that is not bad in this mix.
The equity benchmarks show an ugly trailing 1-month and 3-month period, but for the YTD period we see the power of the Magnificent 7 and their tech-centric “siblings and cousins” driving good YTD numbers overall. We see some other angles in the ETF section below where we use some equal weighted benchmarks and more industry groups. Small caps are struggling of late and YTD.

The 1500 and 3000 series are feeling some pain in 1-month and 3-month numbers and energy has lost some altitude this past month despite $90 oil. We see a lot of red in small caps recently and in industrials with Real Estate now negative back to 1 year. Financials have struggled YTD but edged into a rally attempt the past 3 months.
ETF and benchmark returns…
In our next four asset return charts, we cover 1-week, 1-month, 3-month, and YTD time horizons for a range of ETF returns. We look at 26 different benchmarks and ETFs that cut across a wide expanse of the economy.
We added the YTD version this week with the 4Q23 period about to begin and the usual question of “What kind of year was 2023?” starting to look for a general description.
We recently added equal-weighed ETFs for the S&P 500 (RSP) and NASDAQ 100 (QQEW) given the market cap weighted distortions in the total returns for those benchmarks that had been driven for much of the year by the mega-names. The YTD return profile for market cap weighted ETFs vs. Equal Weighted ETFs offer a clear reminder of what an unusually imbalanced year it was to this point.
When looking across some of the bellwether industry/subsector ETFs, it is good to keep in mind which narrow ETFs (vs. broad market benchmarks) get wagged more by the “Magnificent 7” including Consumer Discretionary (XLY) with Amazon and Tesla, Tech (XLK) with Microsoft, Apple, and NVIDIA, and Communications Services (XLC) with Alphabet and Meta.
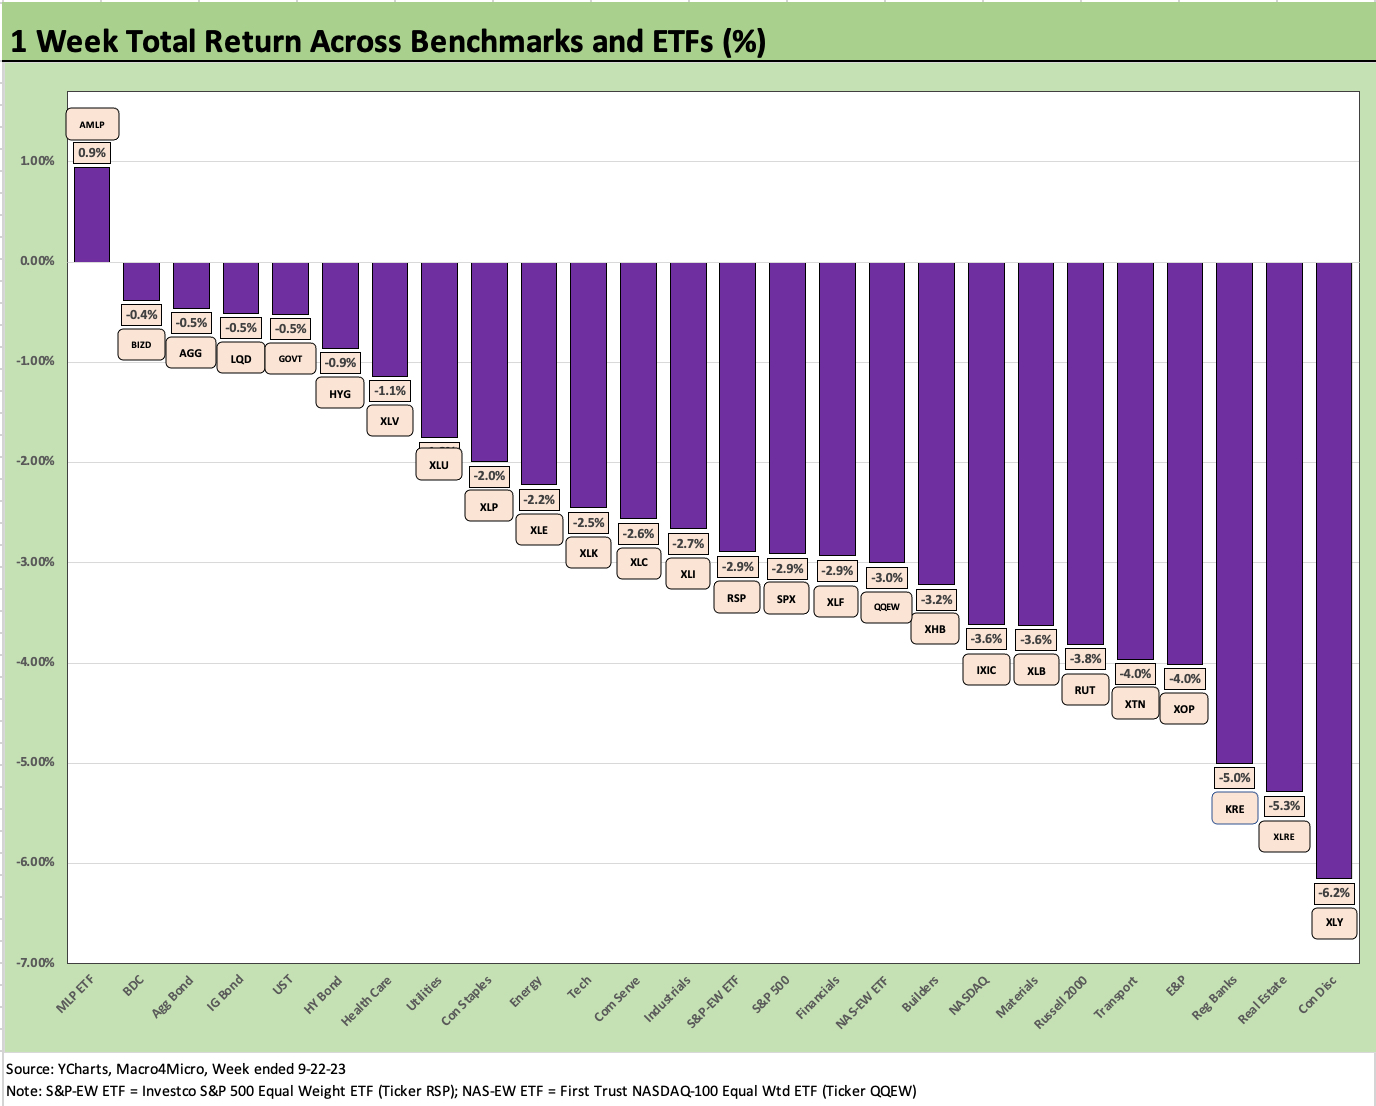
The above chart is not too hard to frame with 1 ETF positive with the Energy Midstream ETF (AMLP) as the only one in the black. We see all 4 fixed income ETFs in the red but in the Top 10 performers in another bad week for equities and tech. Real Estate (XLRE) and Regional Banks (KRE) were also surfing the bottom tier. We see Consumer Discretionary (XLY) on the bottom with both Amazon and Tesla turning in nasty -8% handle weeks.
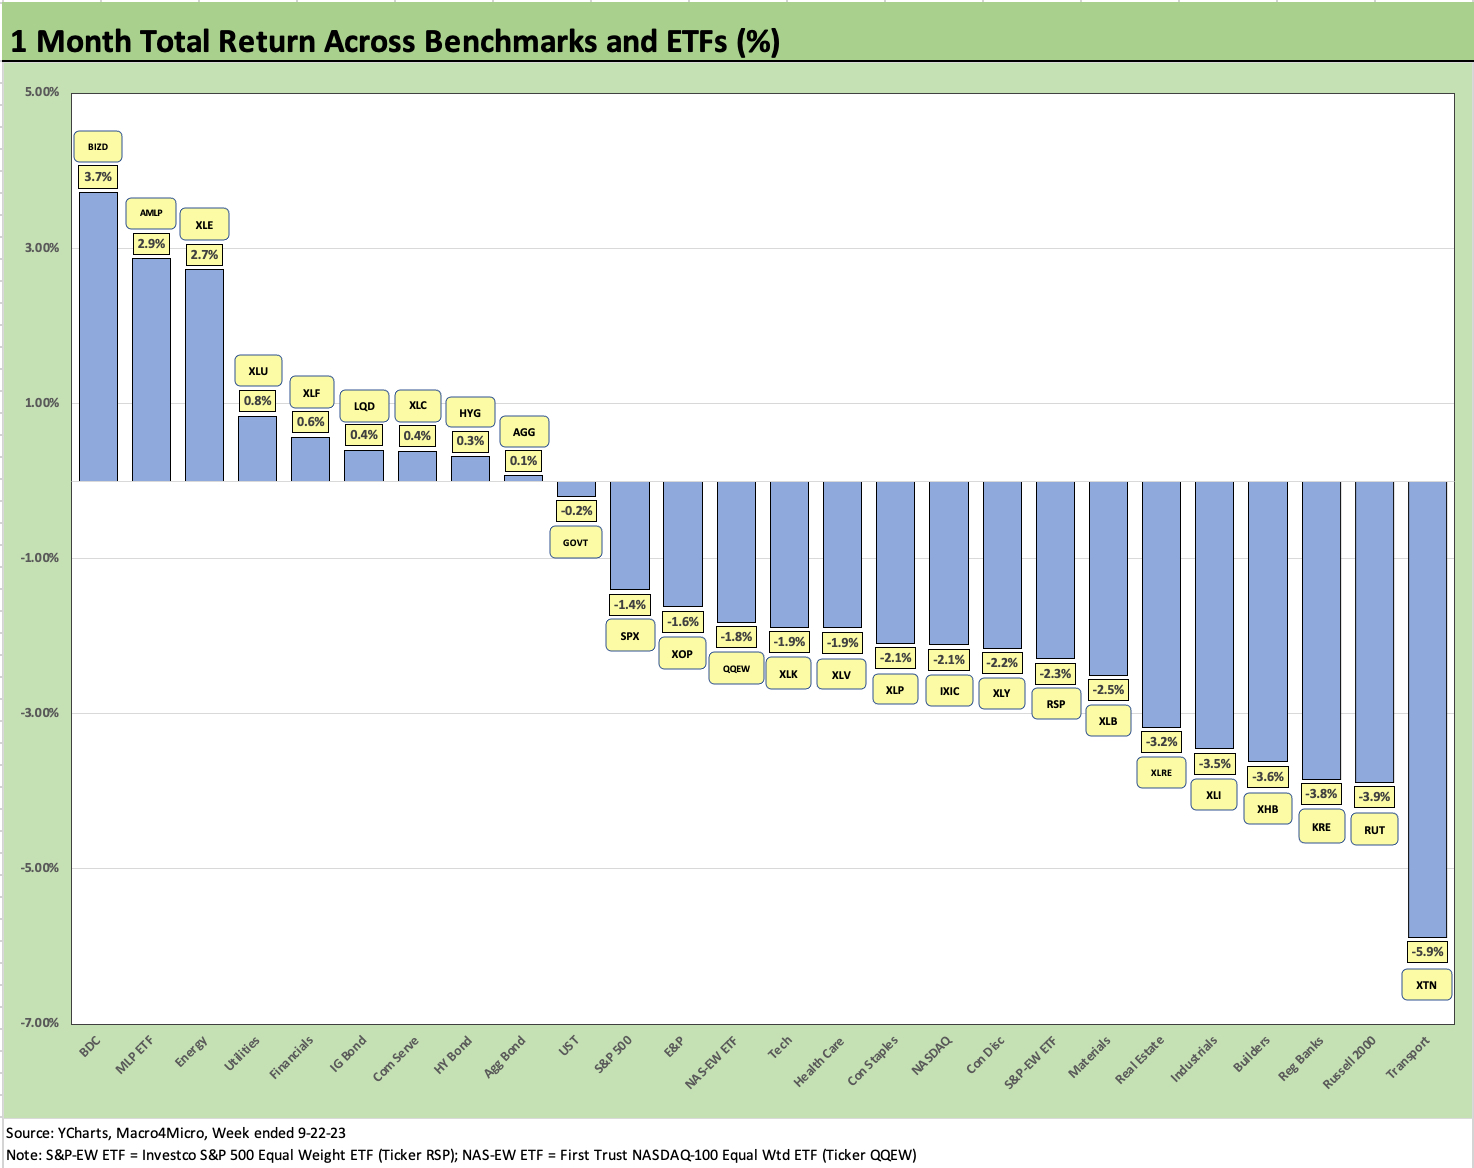
The trailing 1-month timeline shows 9 positive and 17 negative. We see two high income ETFs at #1 and #2 in the form of the BDC ETF (BIZD) and the Midstream ETF (AMLP). We see the fixed income ETFs in the Top 10 with 3 of the 4 slightly positive (below 0.5%) and one (GOVT) slightly negative.
In terms of BDCs and Midstream Energy, we have disclosed in past commentaries our interest in both of those broad groups and their underlying names. In the interest of disclosure and as noted in the past, those two sectors have been among my own personal portfolio exposures, which is heavy in high dividend payers as typified in more than a few “old guy” investor portfolios.
BDCs are not for everyone, but it is one high income way to play the credit cycle with higher credit risk holdings and floating rate assets. Along a similar vein, midstream names (whether C Corps or MLPs) have high income but with more transparent and reassuring hard asset protection and solid free cash flow fundamentals.
The bottom of the ranks shows a mixed picture. Some signal worry around the cycle (transports, regional banks, small caps, industrials) and some signal pullback on some 2023 “high flyers” (e.g., builders). Real Estate has been a consistently weak performer in this interest rate backdrop.
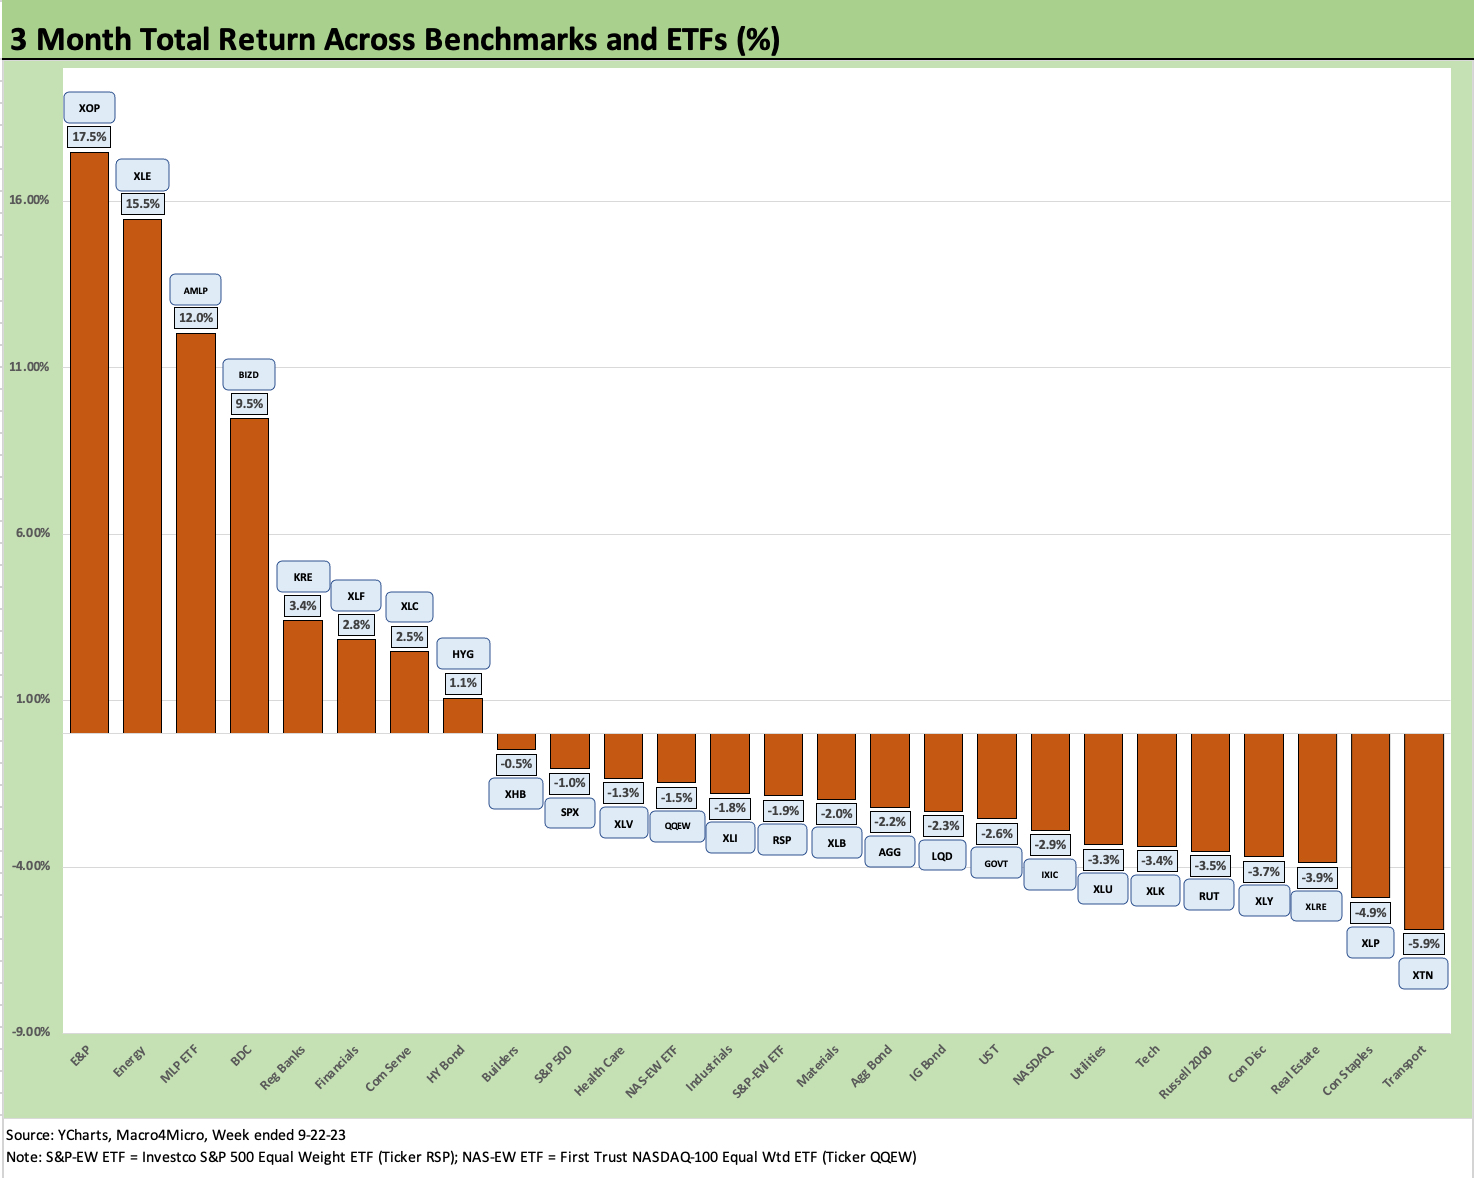
The nasty results of the trailing 3-month period show 8 positive and 18 negative. Energy is holding down the Top 3 slots with BIZD #4 well ahead of the rest of the pack. Transports (XTN), Staples (XLP), Real Estate (XLRE) and small cap (RUT) have been regular visitors to the bottom, but XLY had been a recently volatile sector to the downside even if still very strong YTD.
The past few weeks have been rough on duration and risk. That covers a lot of asset range.
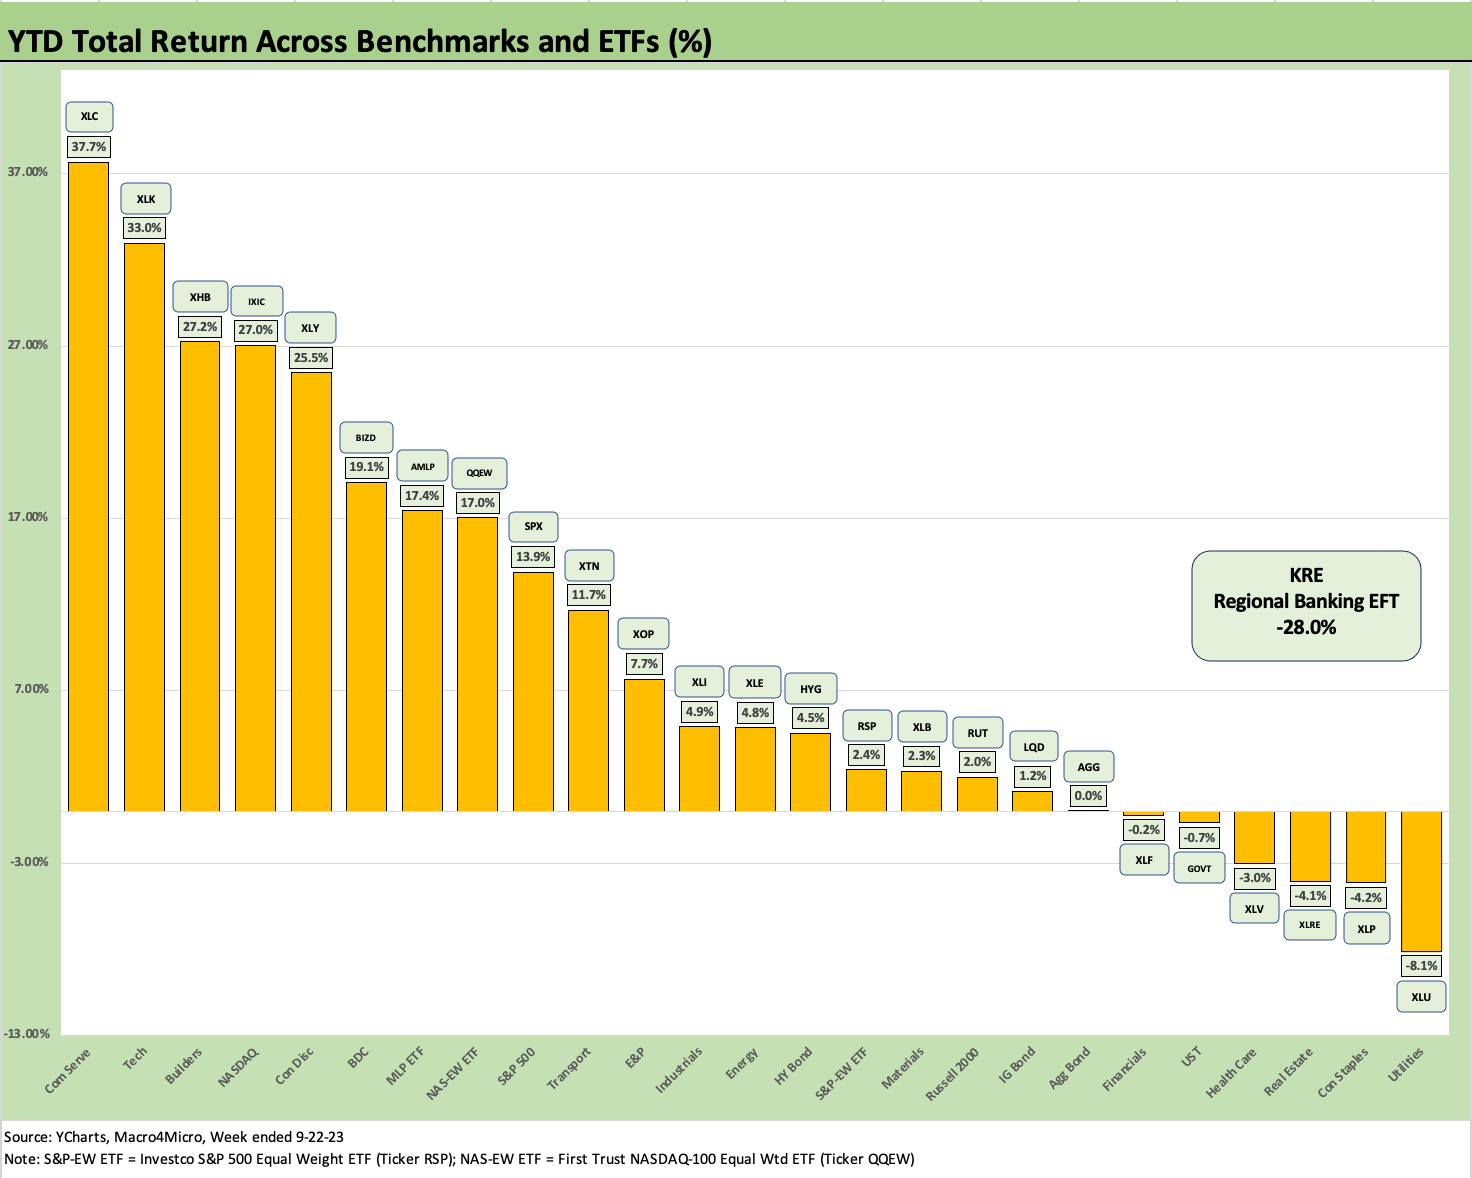
The “Footnotes” edition for asset returns now includes YTD ETF performance, and we see 19 positive and 7 negative for the year. We have one very negative outlier in the form of regional banks (KRE) that we now put back in the penalty box to avoid messing up the chart scale. At -28%, the KRE ETF is still highlighting a brutal year for a very important financial group. Utilities (XLU), Staples (XLP), Real Estate (XLRE), Health Care (XLV) and the duration-sensitive GOVT round out the bottom.
The big winners on the year are the tech-heavy ETFs including Communication Services (XLC), Tech (XLK), the NASDAQ benchmark, and Consumer Discretionary (XLY). A notable surprise to many in the market was the Builders (XHB) at #3 and the BDCs (BIZD) at #6 and Midstream Energy (AMLP) at #7. HYG was below the median with the fixed income ETFs generally hanging around the 3rd quartile.