
Existing Homes Sales: Inventories Stay Tight, Prices Solid
Another skinny month in existing home sales makes life tough for brokers.


The performance and profile of existing home sales for July was a lot like June with inventories staying very tight on high mortgage barriers to sellers and median prices up YoY and over the $400K threshold.
The rising mortgage rates in August and too much early talk of “next stop 8%” does not bode well for a loosening of the grip that sellers have on their potential houses for sale.
The net effect still plays to less activity and advantages to the homebuilders in relative context given the flexibility to customize homes to their costs and price, create their own inventory, sell from spec builds and homes under construction, and use mortgage buydowns and incentives to get the buyers to the finish line.
Existing home sales continue the theme of existing home sales inventory as a natural stabilizer of prices in a market where demand is high, but refi costs for most sellers would be prohibitive relative to existing mortgage rates they have in hand (“golden handcuffs”). The balance of factors creates a market that still favors homebuilders picking up share for those buyers naturally in need of a home based on numerous personal factors.
There is always a high level of activity in the dynamic residential markets, but builders have more ways to get there based on their local market knowledge and selling tools. For the largest builders, they can lean on their captive mortgage services offerings and fee incentives that they can play with in title and insurance services.
As we cover in this week’s “Footnotes” publication on yield curve trends (see Footnotes & Flashbacks: State of Yields 8-20-23 8-20-23), builders have useful alternatives in the tool box to keep business rolling even if total sales will intrinsically remain under pressure with mortgages this high. The imbalance of supply vs. natural demographic demand in a market with record payrolls and low unemployment make for an unusual mix of variables in the housing sector picture.
The direction of mortgages is pure and simply bad news for brokers and mortgage lenders.
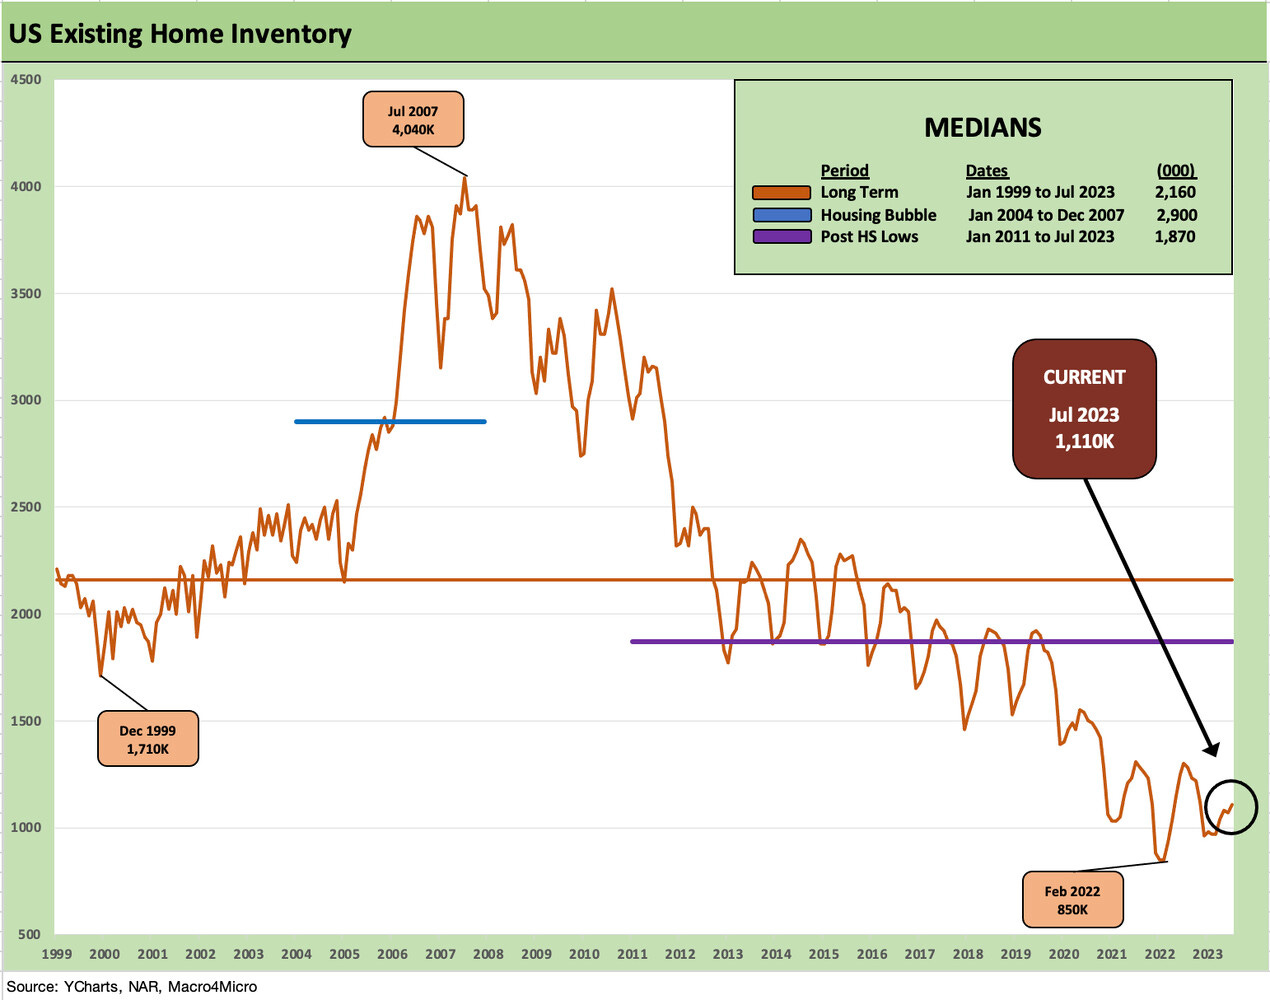
The above chart updates the current inventory balance, and themes are very much in line with what we saw last month (see Existing Home Sales: Bare Cupboards, Hungry Crowd 7-20-23). The fact that “units to move” are just not available has sent prices higher and keeps the price collapse scenarios at bay (more like entombed). Per the NAR, July was the 4th month the median price was above $400K. That helps homeowners feel good about their home equity as well (see Consumer Debt in Systemic Context 7-13-23).
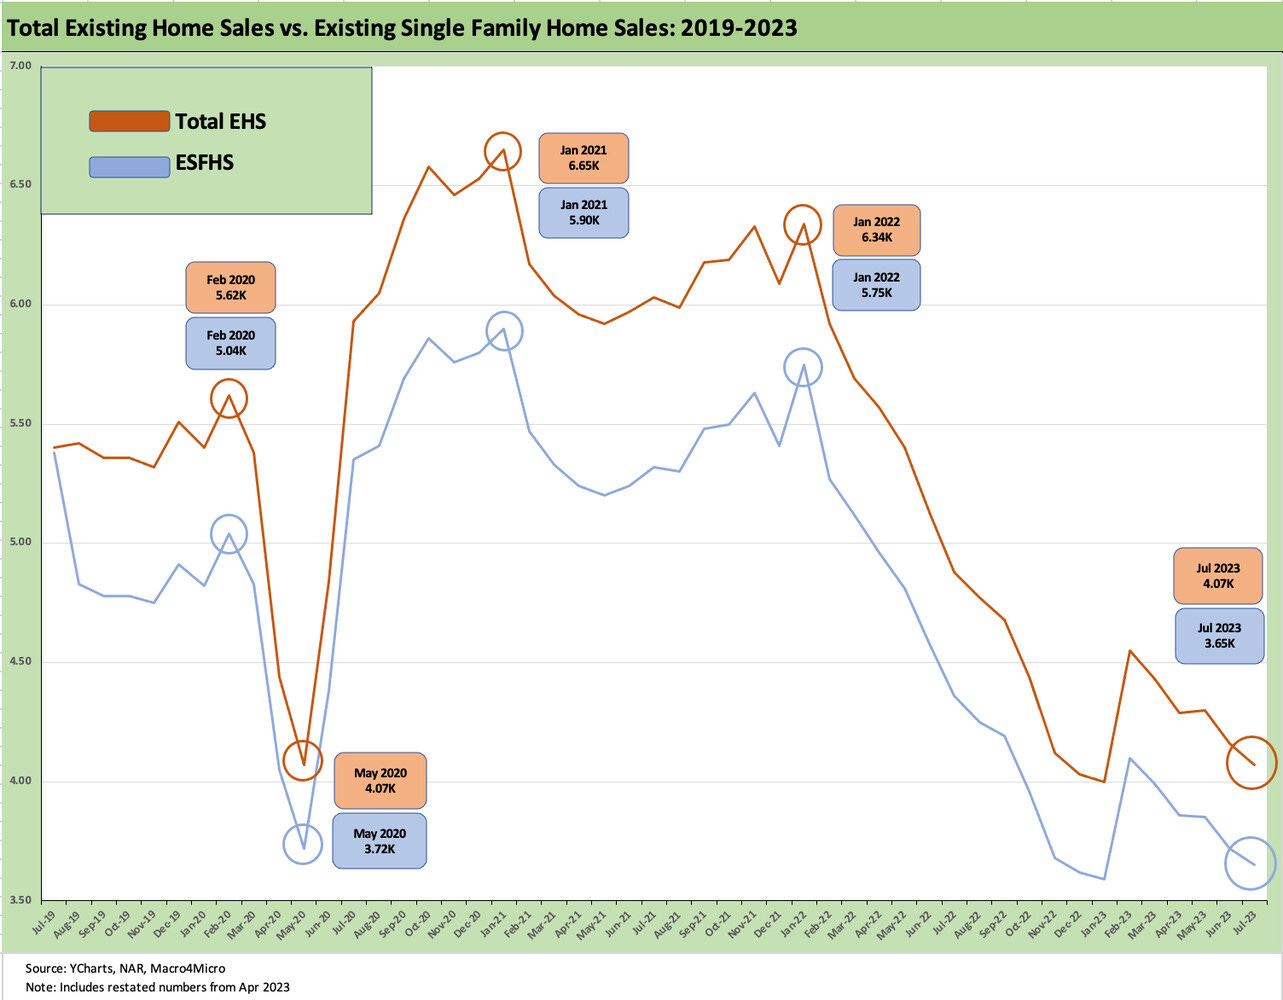
The above chart frames the time series for total existing home sales (including single family, townhouses, condos, and coops) vs. existing single family homes. The two lines are just a nuance on the same broad trend – as in low supply and low activity in historical context. Current volumes are more like the pandemic months.
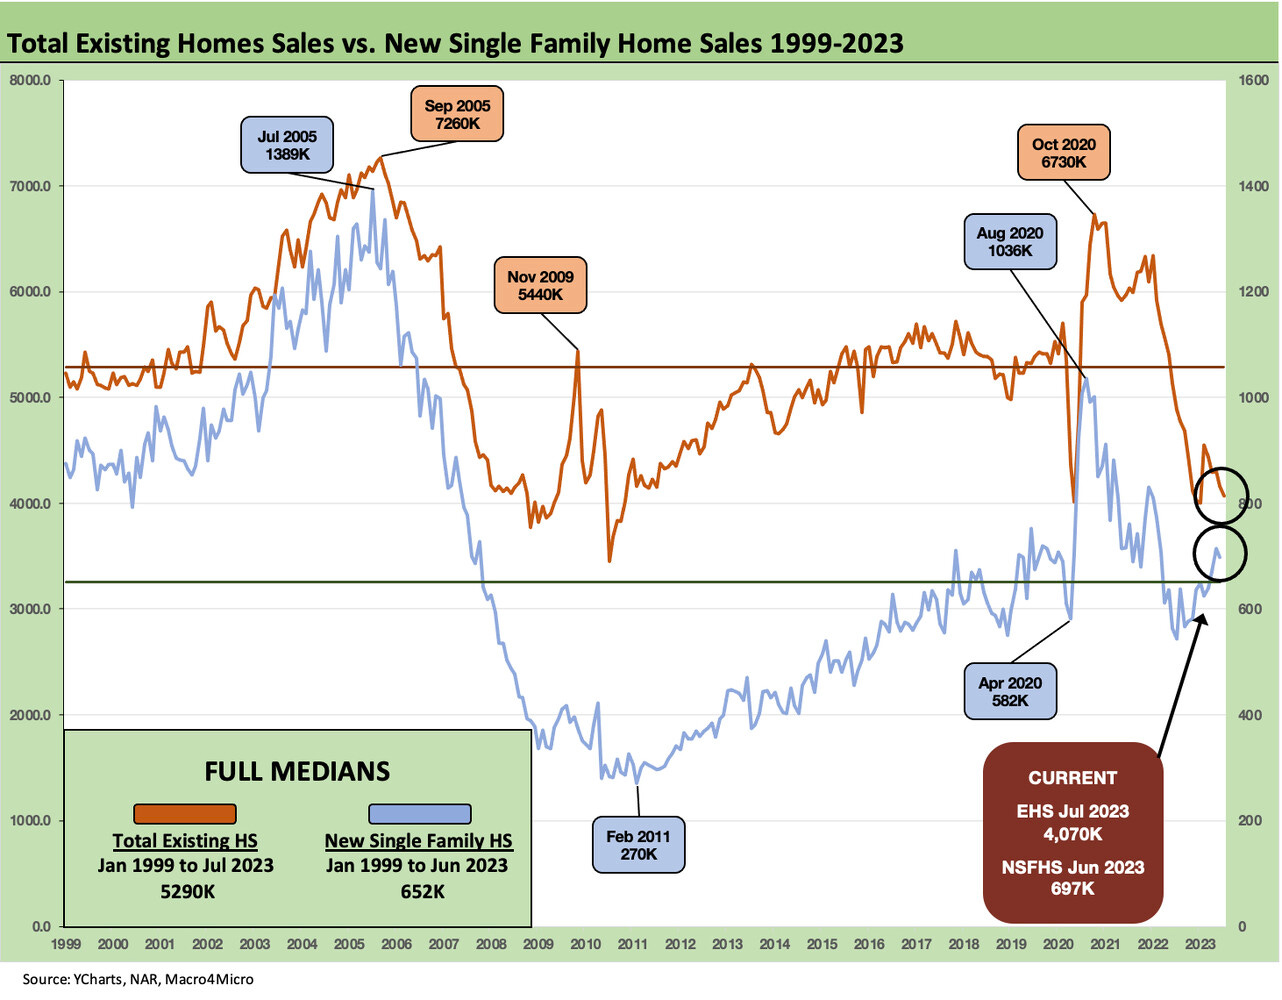
The above chart updates the trend line of volumes for existing vs. new homes sold. Existing home sales typically dominate the total historically in the 90% share area, so we need a two-sided chart for this one. The relative share has been favoring new home sales numbers as builders exploit the lack of existing home inventory. That has been covered quite a bit in past commentaries (see New Home Sales: Low Bar for Comps YoY, Sequentially Mixed 7-26-23).
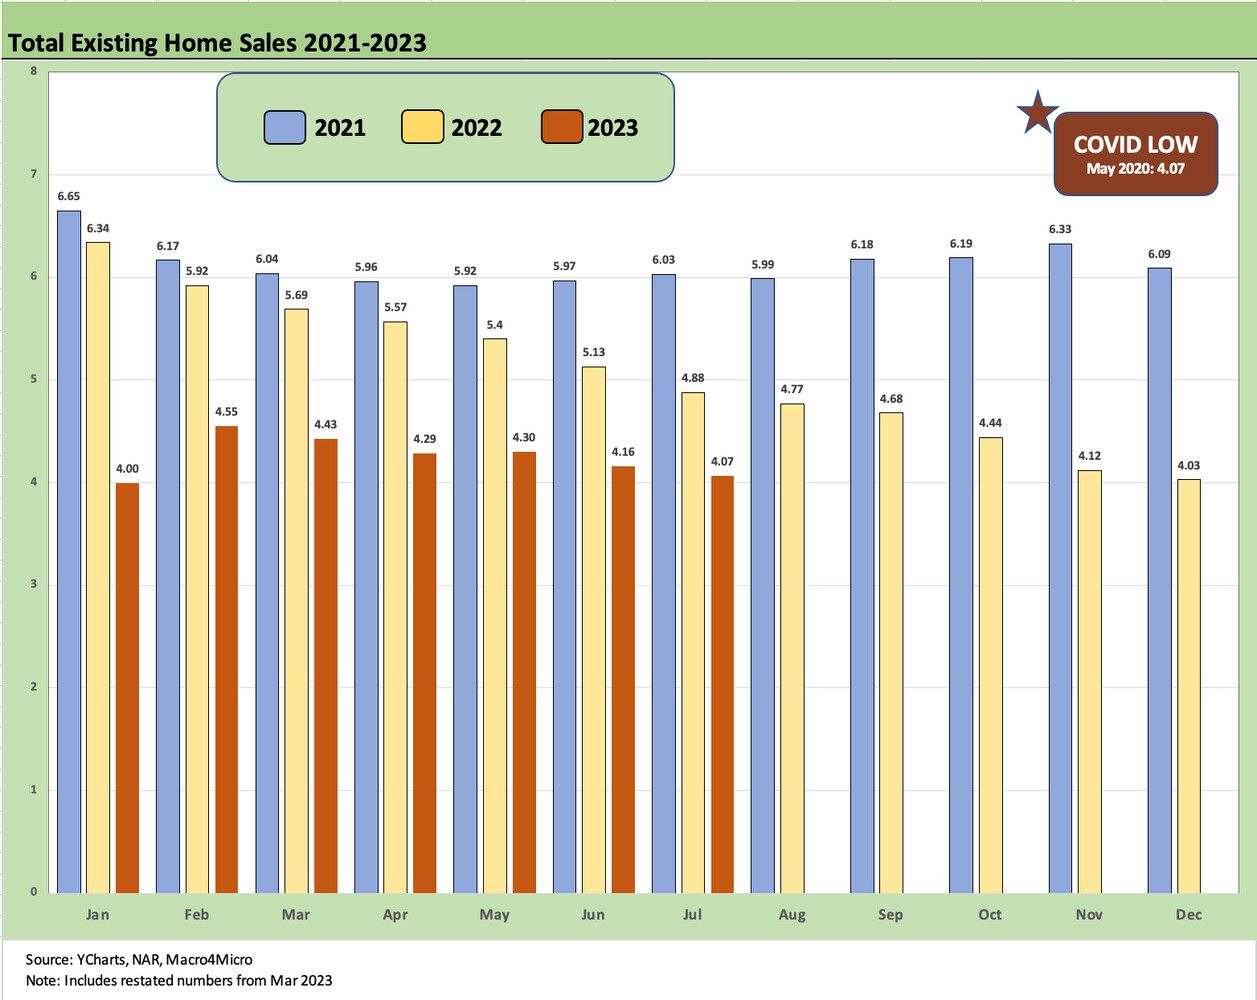
The above chart provides the monthly numbers across 2021, 2022, and into 2023. The current market is at the COVID period 2020 low at this point in sharp contrast to the post-COVID timeline highs in 2021 when rallying economic confidence and flight to the suburbs also had the strong tailwind of low mortgage rates.
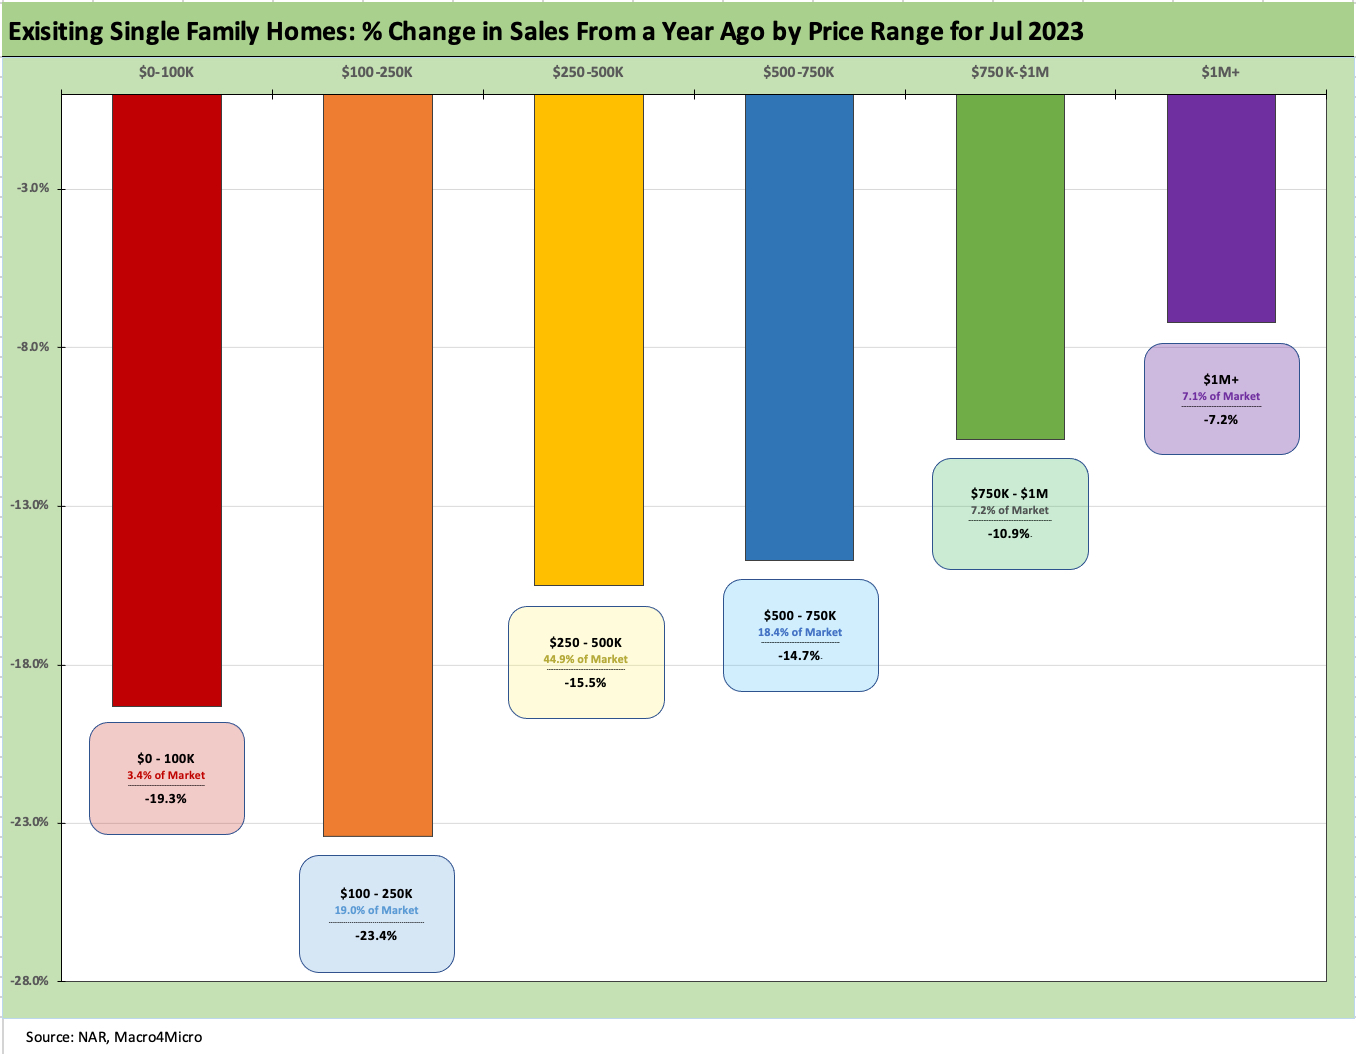
The above chart updates the YoY decline and relative market share of the various price buckets. The sweet spot of the market in the $250-$500K bucket at almost 45% of the market is down over 15%. We see smaller relative declines as the price range moves higher.
The overall trend paints a bleak picture for those business lines dependent on commissions and fees tied to total activity. That means Anywhere and Compass among others and the same for independent mortgage providers.
See also:
Housing Starts and Permits: Single Family Advances, Multifamily Backpedals 8-16-23
New Home Sales: Low Bar for Comps YoY, Sequentially Mixed 7-26-23