
Housing: Sequential Starts Ease, Permits/Completions Mixed
The housing sector is faltering from some angles, but working capital caution is good.

Total starts in August declined YoY and sequentially but with a high rate of construction still in progress as homebuilders manage their building cycles vs. projected demand.
Single family starts declined sequentially and were soft YoY, but the important South region stayed strong in 1-unit trends.
Permits were up sequentially while units under construction were flat sequentially and down double-digits YoY with 1-unit completions down as well.
Multifamily permits showed a fresh round of strength sequentially in contrast to sharper YoY declines in multifamily permits and starts with multifamily completions spiking and more supply coming on market that should help the market perception of shelter inflation.
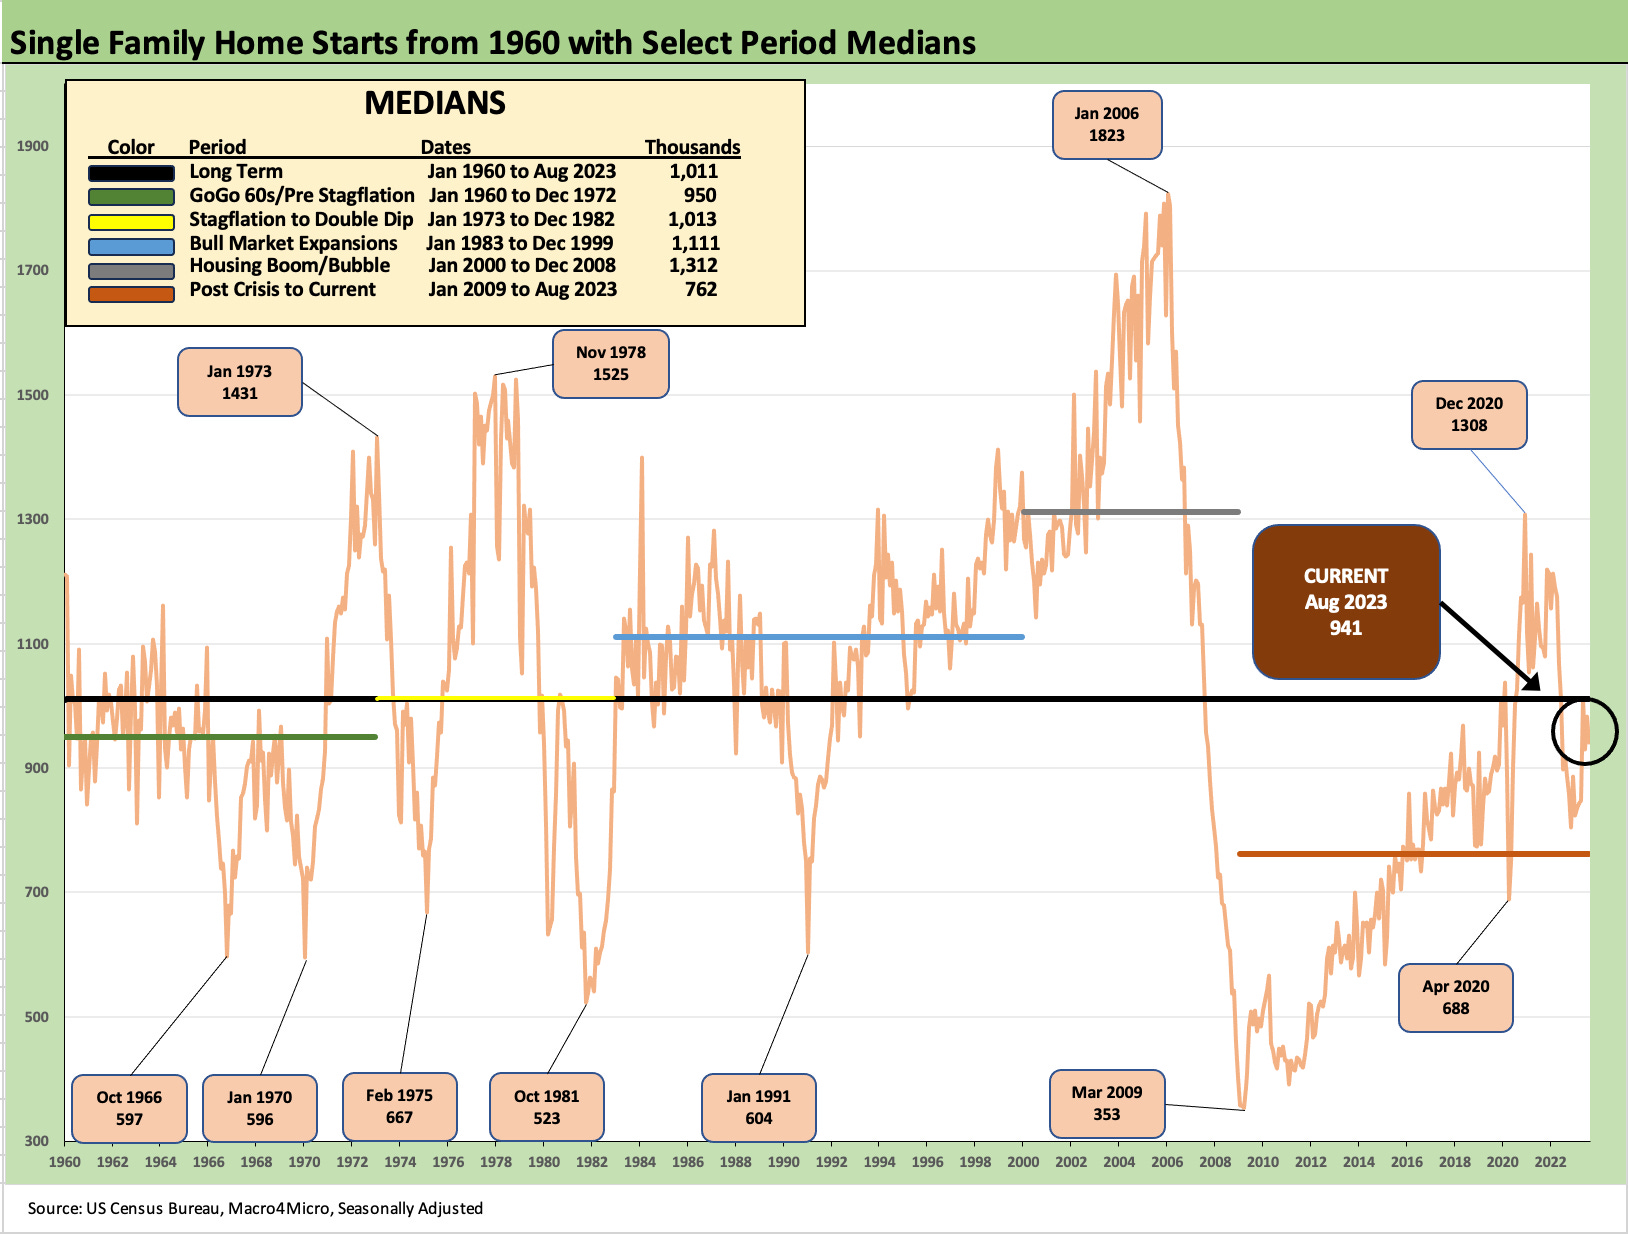
The above chart updates the single family starts time series with current run rates still below the long-term median but well above the median from the post-crisis period. We detail the timeline medians in the box. For builders, the evidence of their favorable cash flow dynamics has been reassuring for many investors.
Meanwhile, the ability of the builders to manage their working capital prudently and plan community counts and product mix for solid profitability even in a supply chain crunch has earned the major players a lot of well-earned respect. Their use of incentives and mortgage buydowns in this tightening cycle is one more favorable data point on the positive checklist.
With 7% handle mortgages hanging around in a narrow range for a while, the FOMC is teed up this week as it faces more challenges with oil creeping higher (WTI cracked $93 earlier today but is at around $92 as we go to print).
The combination of seasonal slowing for the homebuilders and uncertainty in the cycle (as certain as many may be in the bull and bear camps) is going to need more tangible macro and micro input to drive the sector more materially in one direction or another. That comes after a very heady run for homebuilder equities and an increasingly favorable view of the financial resilience of the sector broadly in the credit markets.

The above chart updates the recent timeline from the beginning of 2021 on total starts and permits and single family starts and permits. The moving targets in these areas get a little more complicated each month as the builders fine tune their pace of starts vs. sales of completed homes and homes under construction.
The increased use of “spec” builds became a necessity in this cycle on supplier chain issues but also on the highly volatile nature of mortgage rates across 2022-2023. The builders are very good about giving you stats on community counts, specs, and regional breakdowns. The builders are picking up market share in the total home sales numbers as existing inventory stays locked down. We get the existing home sales numbers later this week.
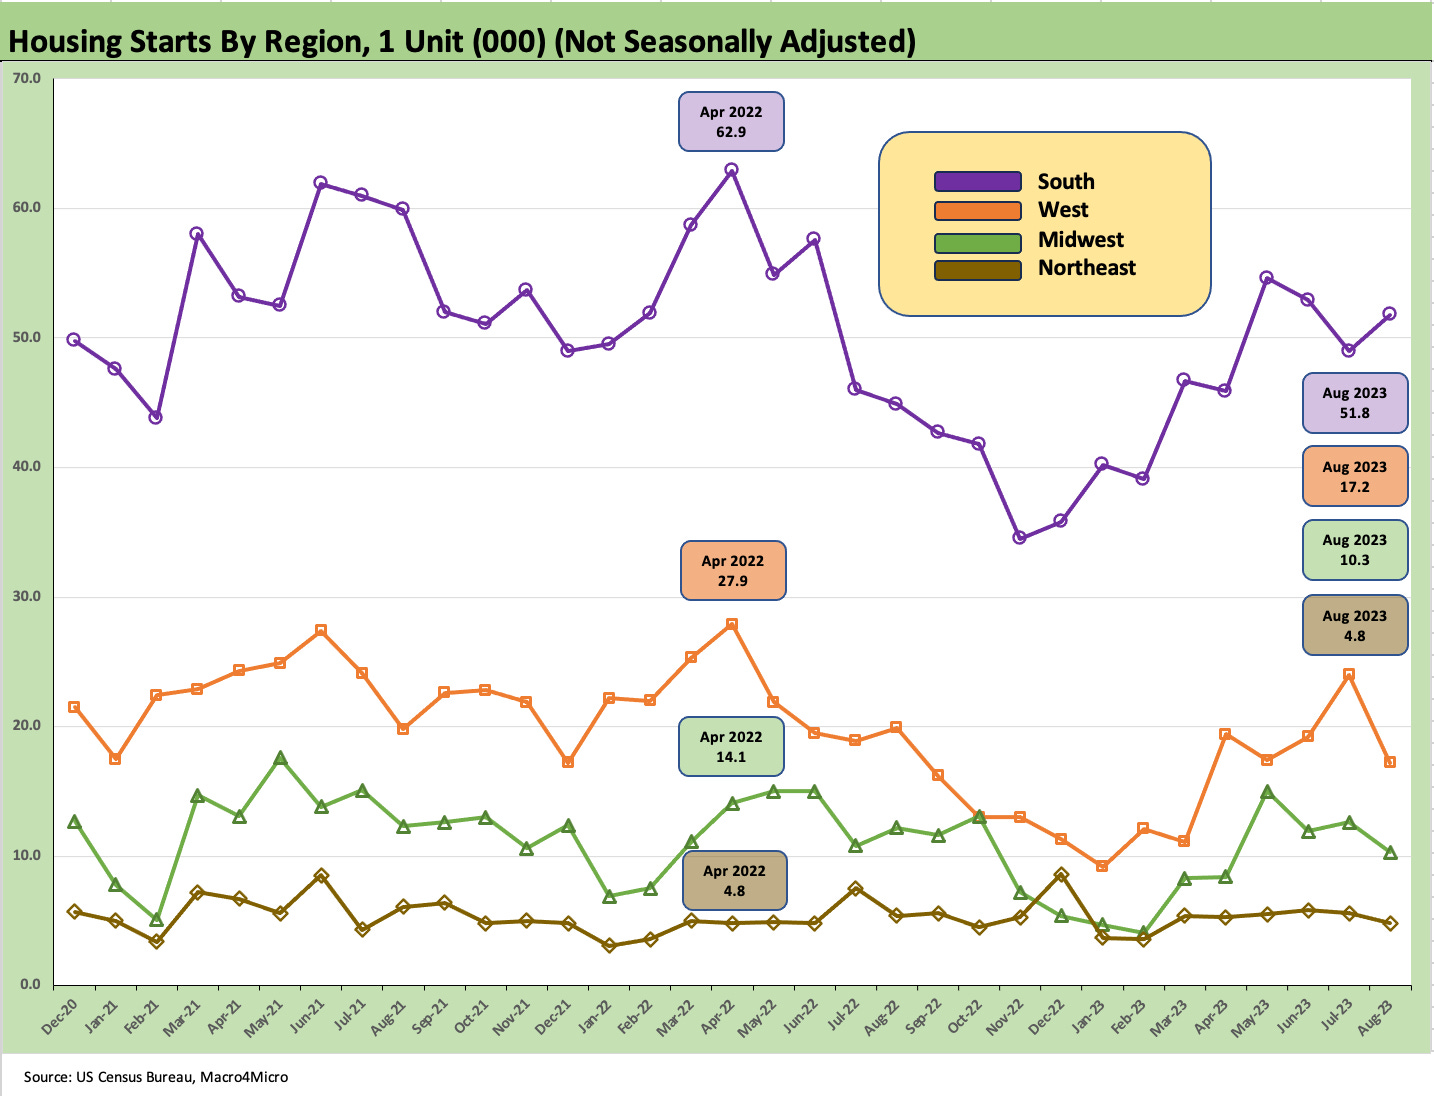
The above chart plots the breakdowns on single family starts by region on a “not seasonally adjusted” basis to get the numbers more akin to the real activity at sea level. The importance of the massive South region (with Texas and Florida) as categorized by the Census hammers home the strength of the builders in those major regions. For August, the South was the sole uptick in sequential starts.
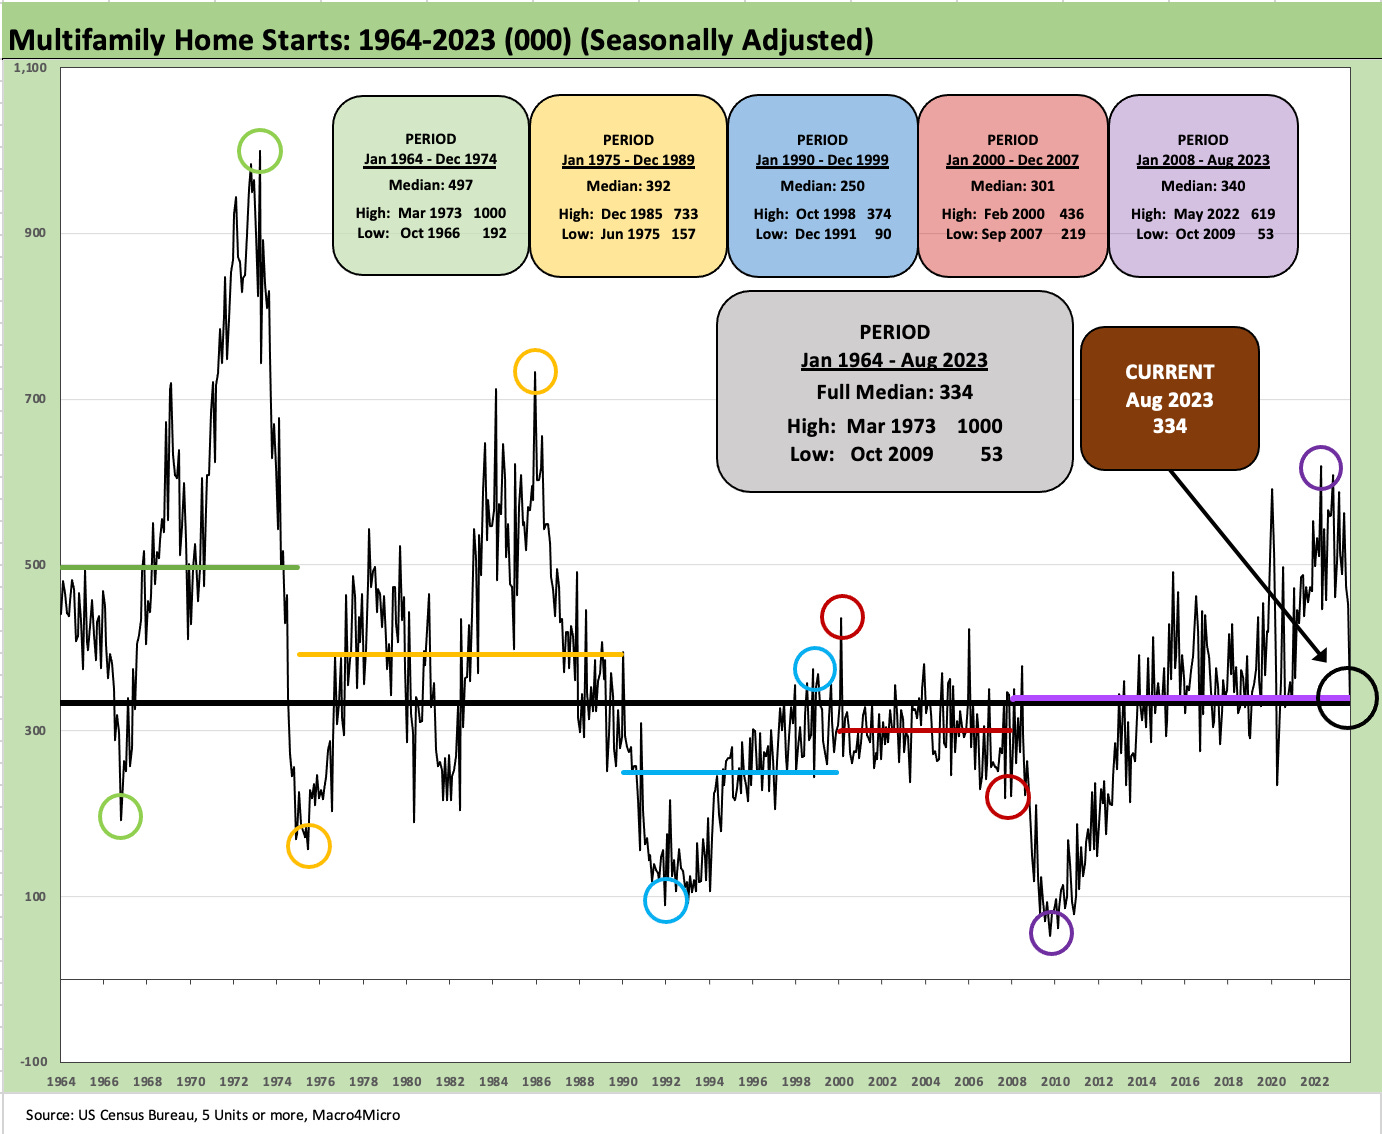
The above chart updates multifamily starts, and this sector has been getting a lot more attention than it usually does given its connection to rents and how those flow into CPI metrics.
Supply coming on the market is expected to keep pushing down rental rates even if some regions can stay solid and deviate from the broader trends. There are a lot of services and data providers out there making the case on rent metrics. The bias is lower and more importantly much lower than what we see in the CPI metrics. We see the median rents coming down on a broad level across a range of major metros. There is still a lot of supply coming.
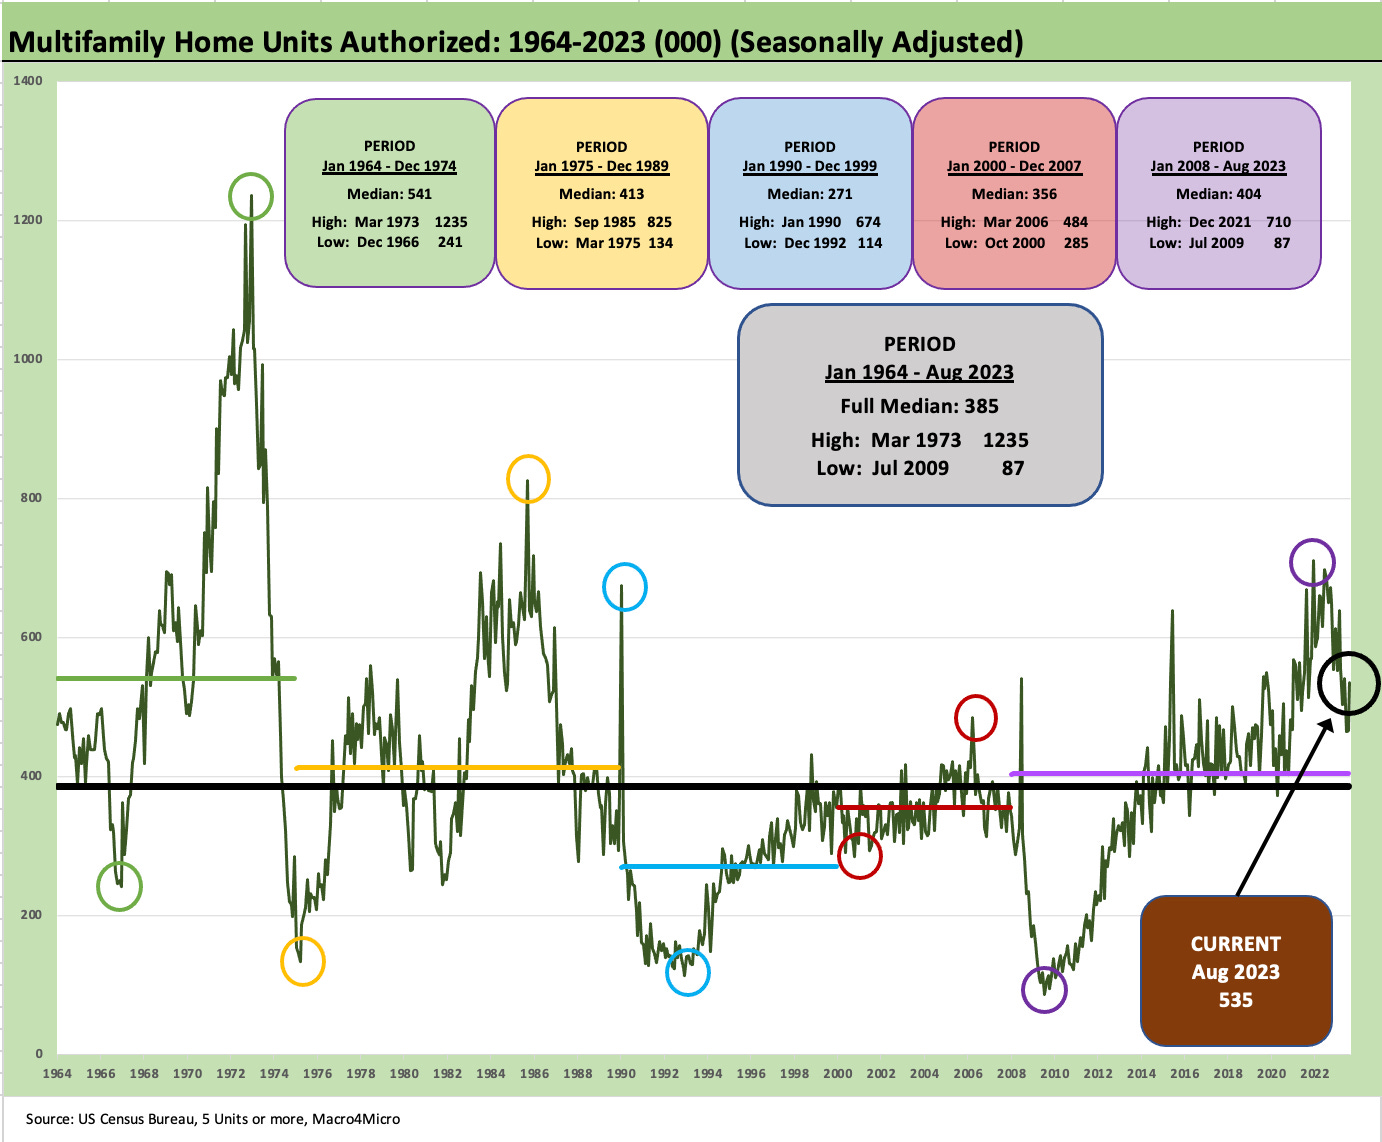
Multifamily permits rose notably this past month after a few months of declines. We still see a high number of multifamily units under construction hovering just below the 2023 highs. Completions in multifamily also had a big month, up over 45% sequentially from July and +32% YoY.
See also:
Footnotes & Flashbacks: State of Yields 9-16-23
August CPI: Inflation Fears…They’re Back?! 9-13-23