Housing Starts and Permits: Single Family Advances, Multifamily Backpedals
Housing starts tell a good story but don’t make Fed planning easier.
In the context of 7% area mortgage rates, the news out of starts vs. permits shows the builders managing their working capital as expected with starts and new home sales being consistent.
We are now in the part of the 2023 calendar year that is posting favorable YoY comps in new single family residential construction.
July posted solid sequential positive moves in single family and even better numbers in YoY in starts while multifamily starts were flat sequentially and YoY.
Multifamily is very important to monitor given that it ties into rent inflation and CPI metrics, and we are seeing the multifamily permits getting a material retrenchment to go with flat starts.
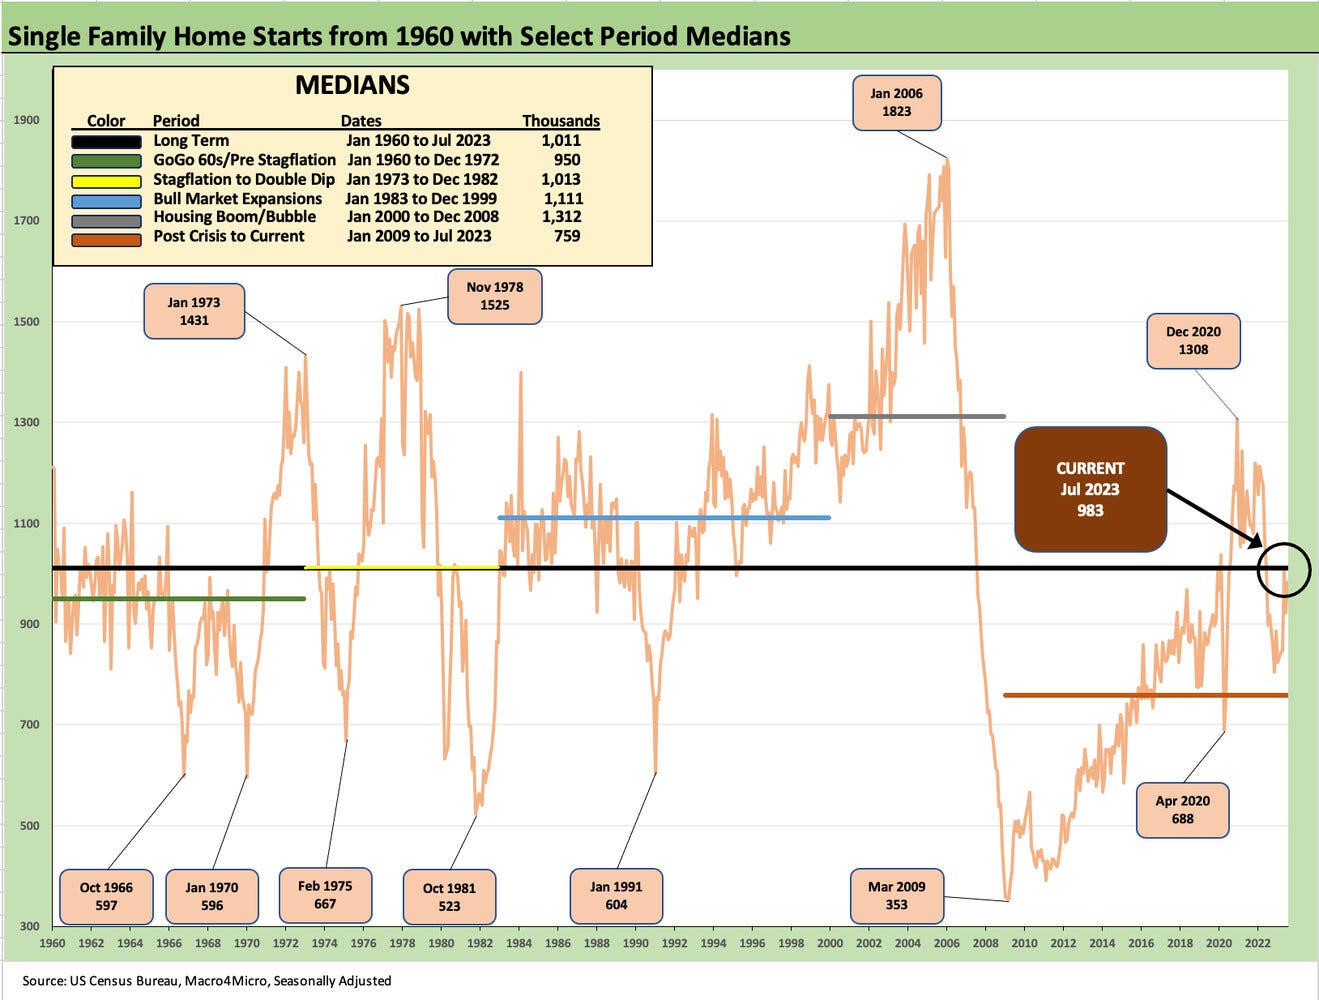
The chart above updates the long-term trend line for single family home starts as of July 2023. The 983K units (SAAR) total is below the May numbers but marks a solid move sequentially (+6.7%) and an even better YoY move at +9.5% vs. July 2022.
As of July 2023, the market had just moved past the peak inflation rates of June 2022 for YoY comps, and that swings in favor of the 2023 math. At this point in 2022, the builders were moving along in the peak selling season delivering homes that had been under contract while some were seeing incentives added. As the strong 2022 homebuilder earnings drove home, the pain of the eroding affordability and mortgage rate spike rolled in at a lag into builder earnings.
The current run rate of 983K beats any monthly numbers from 2H22 and just falls short of the 1012K of May 2023. As we show in the median box in the chart, the July SAAR number is within a respectable distance of the long-term median of 1011K.
Those comparisons to the medians plus the knowledge that the housing market is facing a serious shortfall of supply vs. current need help make a sustained good case for builders over the intermediate term. For their part, the builders are also picking up market share from existing homes in the monthly total sales volumes (see New Home Sales: Low Bar for Comps YoY, Sequentially Mixed 7-26-23). The ability to offer short term mortgage buydowns and fee incentives give the builders an edge in a stalled market for existing home sellers.
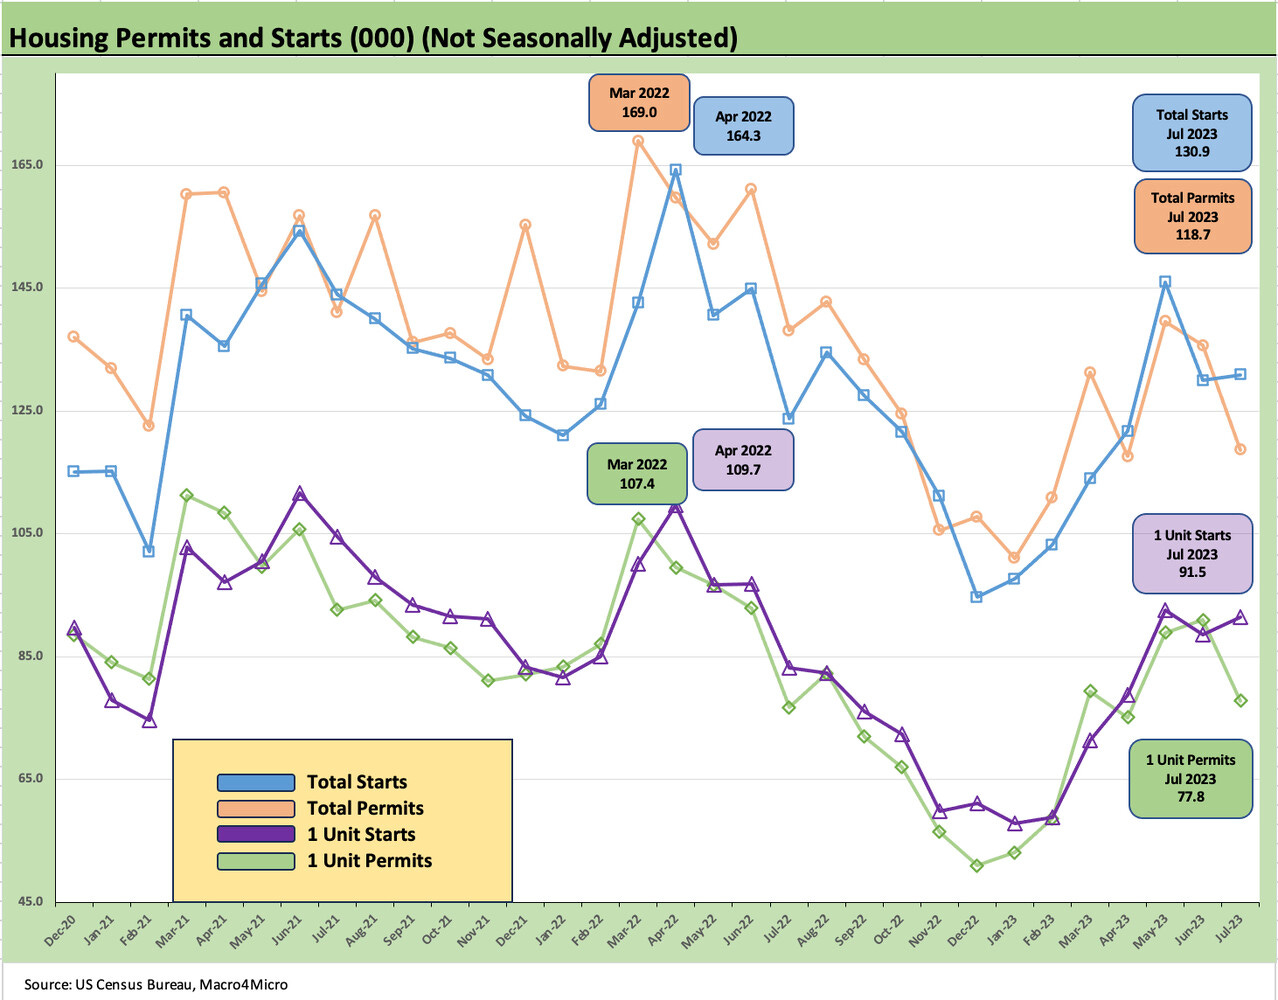
The above chart updates the running starts vs. permits trend over a shorter timeline that runs from the end of 2020 to July 2023. We look at both total and single family only timelines. We use the “not seasonally adjusted” numbers in this chart to get closer to actual activity in the trenches.
We have discussed the prudent working capital practices of the builders in prior commentaries (see Housing: Starts and Permits and the Working Capital Challenge 4-18-23, Housing: Starts, Permits, Construction, and Cyclical Moving Parts 3-16-23), and it is clear that the practices of the builders are very different than the bubble years before the crisis.
Permits are tailing off while starts are holding up well sequentially as the builders continue to prudently manage their inventory levels across a key seasonal period. The fact that mortgages have been stubbornly high and closer to 7% than 6% this season discourages too much optimism on what 2024 might look like.
The above chart updates single family starts by region again using not seasonally adjusted numbers to get closer to actual. As usual, the South region (includes Texas and Florida) dominates the numbers. The South ticked down on the month while the #2 region (West) moved higher. After rolling in the Midwest (higher) and Northeast (slightly higher), the total number trended higher for the month.
We have been looking at Multifamily from more angles in our housing sector work from the monthly top-down reviews (see Housing Starts: Multifamily Moonwalk 7-19-23) to the involvement of more major homebuilders expanding in the space. Names such as D.R. Horton have moved into new construction build-to-rent projects on the single family side as a business segment (see D.R. Horton: Credit Profile 4-4-23) after they had already been in multifamily. The strategic rationale is clear with not enough housing for the longer term demographic demand. The challenges of rising monthly payments to buy or enough cash flow for a down payment have caused residential builders to mix their offerings in both “buy” and “rent.”
For July 2023, the 460K (SAAR) in 5+ unit starts is below 5 of 6 months in 2H22 and tied with June 2023 for the lowest in calendar 2023. On a not seasonally adjusted basis, July was the lowest of 2023 and below June.
The above chart updates the permits timelines for Multifamily on a SAAR basis. At 464K, the permit level is plunging YoY by over -32%. July is the lowest number of 2023 and substantially lower than each month in 2H22. In the context of the high completion numbers that we have seen in 2023, the pullback in Multifamily makes complete sense. The 986K of 5+ units under construction gets a lot of attention and is running at a high. That is what makes the high rent inflation in the CPI index so strange, and that rent metric will be trending quite favorably into 2024 (see July CPI: All About the Bass 8-10-23).
The theme of high multifamily supply coming online has been a recurring theme in recent months as seen in the completion stats in the release. The month of July showed a sharp drop-off in completions by -38% sequentially after very high rates of 5+ unit completions from Feb 2023 to June 2023.
The overall picture from the New Residential Construction release this month is about continued strength in single family and rational, prudent planning in Multifamily. The numbers are in the healthy economic growth column for the Fed’s checklist. That is the same old “Is good bad?” question that is constantly in the discussion. At the very least, it is in line with good employment numbers and more than a few pockets of strength in goods and services.
See also:
New Home Sales: Low Bar for Comps YoY, Sequentially Mixed 7-26-23


