Anywhere Real Estate 1Q23: Company Comment
We look at the 1Q23 earnings of Anywhere as LTM GAAP leverage creeps above the logical EV multiple for HOUS.
1) Lower mortgage rates 2) More home sellers and 3) Easy credit
We look at the 1Q23 numbers for HOUS (the real estate brokerage operation formerly known as Realogy) as another quarter of pain keeps stock action ugly while the credit march to the CCC tier remains in process.
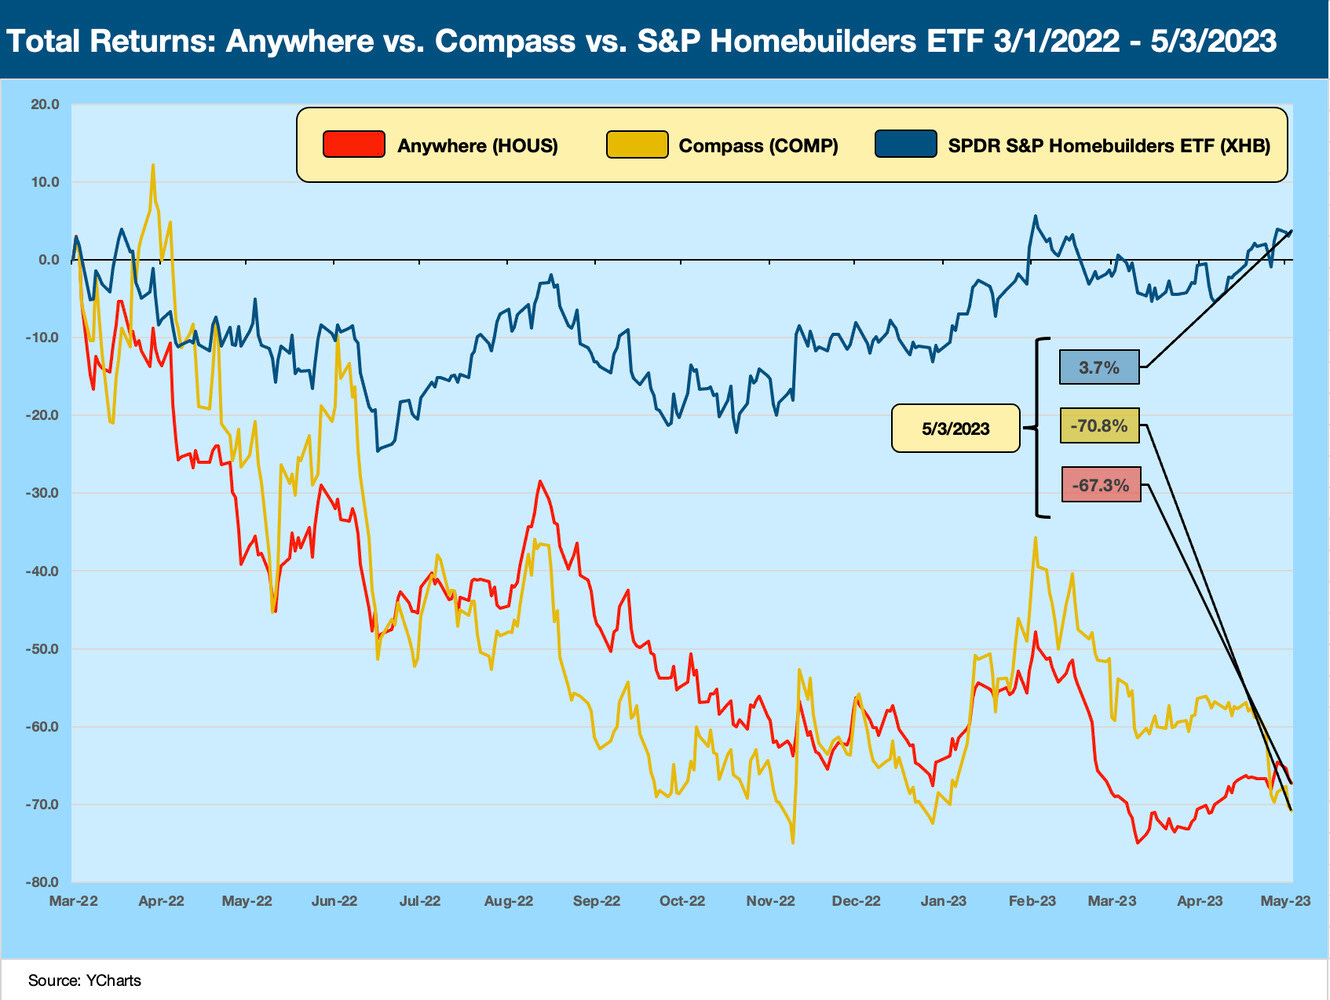
The divergence of companies tied to new residential construction (homebuilders) and those tied to existing home sales (RE brokerage) makes for an eye-opening charting exercise since early 2022.
The fate of the brand-heavy, asset-lite, and commission-driven brokers continue to feel the pain with mortgage rates as stubborn as inflation and extraordinarily wide mortgage spreads. The 1Q23 reporting period for Anywhere Real Estate (HOUS) brought more pressure to an already depressed stock below $5 as we go to print, down from the high teens in the fall of 2021.
We already generated a detailed Credit Profile on HOUS with more history earlier this year (see Credit Profile: Anywhere Real Estate 3-1-23). We bring the charts and numbers up to date in this commentary, but the bleak outlook has not changed much in a business that is all about volume and transaction prices that drive commission revenues from existing home sales.
We update existing home sales each month, and it has not been pretty (see Existing Home Sales: Dead Calm 4-20-23, Existing Home Sales: The Sun Will Come Out…When? 3-21-23). High price homes have seen some of the steepest volume declines as we break out in those commentaries. Setbacks in “tech-land” and in the banking sector presumably will not help that luxury home story in 2023.
We look at some stock return time series below, and that is a grim tale. The charts that follow do not include today’s sell-off at a decline of $1.03 or 17.5% to $4.85.
The stock chart above plots HOUS and Compass (COMP) (real estate brokerage) against the homebuilding ETF (XHB), which includes the builders and suppliers. The visual tells the story. The new residential construction markets have diverged with a vengeance in the equity markets since the existing home sales market has been partially paralyzed by mortgage rates and cyclical defensiveness in the face of recession fears and inflation uncertainty. Buyers can’t buy what sellers won’t sell at the prices they would get or the mortgage they might face on the other side.
The interesting twist is that plunging supply of existing home sales feeds into a better outlook for builders in a market where there is still a supply-demand imbalance favoring new homes built at a price that can bridge the affordability problems. We look at flagship builders (see Signals & Soundbites: D.R. Horton 2Q23 4-21-23, D.R. Horton: Credit Profile 4-4-23) and the monthly builder trends in other commentaries (see New Home Sales: Feels Like a Light Tailwind 4-25-23, Housing: Starts and Permits and the Working Capital Challenge 4-18-23). In the end, the personal and financial nature of the homebuying decision comes down to how much house you want for your dollar and where you want that house to be.
The frame of reference that we usually use for HOUS is COMP since they are both public companies (COMP IPO March 2021) and the two were billed as the clash of the titans in luxury real estate. There are some very strong brokerage competitors broadly in the form of Keller Williams and Berkshire Hathaway (BRKs HomeServices unit) with some (formerly) smaller players such as RE/MAX and more recently eXp Worldwide seeing the revenue differentials to HOUS converging along with the market caps. Keller Williams has been very successful with its traditional agent-intensive business model.
There is no shortage of intensifying competition in the business for agents, and investing in tech capabilities has been a major theme for all. That in theory cuts into the Compass securities market sales pitch since they all invest heavily in tech. Similarly, Compass had been one of the most intensive recruiters of real estate agent talent and teams in the business. That takes some of the sales spin off the idea that “it is all about tech.” It is all about agents and tech combined.
The housing sector had been targeted for the next wave of innovation in the tech services side of the business since early in this cycle. As detailed in the above chart, that has led to a lot of disappointment. Arguably, iBuying was the biggest fiasco (see the next chart below), but the value of data also became much more competitive and commoditized. The tech-centric players took a beating in the first half of 2022 with most not looking so bad over the trailing 6 months with the damage already done (some stayed ugly and got worse). Some of the biggest high-flyers peaked in Feb 2021 with the tech equity buying wave.
The HOUS LTM leverage metric is in the high single digits (based on a GAAP view not per the secured bank agreement) and that is a problem. That leverage is above the EV multiple that would be seen as appropriate these days. That means a lot has to go right from here in mortgage rates and existing home sales volumes during peak selling season. The stock market is making it clear that it is not expecting the EBITDA run rate to meet the more optimistic forecasting assumptions.
EV multiples always come down to what EV multiples you are using and in what year. When earnings are this depressed, you end up picking a theoretical year too often to back into your price target. The market is not rewarding this business with some of the multiples discussed earlier in the pre-COVID cycle when double digit EV multiples were kicked around. This subsector does not have much of a history in the public stock markets by any stretch. The EV multiple discussions have been more mired in the mid-single digits even if some might see that as harsh.
For one final pile-on, we plot a timeline total return stock chart for Zillow, Redfin, and Opendoor Tech. Zillow has been the headline leader of the larger cap tech service strategies in housing for some time, and it hit a high stock price of over $203 in Feb 2021 on the way down to the recent $40 handle. We chose the start date of 12-21-20 above to capture Opendoor Technologies IPO and given its role is the leader in the iBuying space. OPEN hit a high of just under a $36 share price in Feb 2021 on its way to the current $1 handle. The iBuyer initiative for Zillow, which also chased the space, was a major setback that hammered its stock price and perception in the market. Zillow exited the space in the fall with a flurry of unsightly headlines.
Zillow and Redfin have struggles in recent periods while some of the new IPOs and new business models have struggled even more. We just cite these as good examples of how the market is struggled to find the solution to a more streamlined and efficient real estate services business model. For HOUS, they have all the advantages of the traditional agent model but also all the risks and question marks of where the business will evolve in terms of combining the human and tech centric.
The traditional legacy leaders also come with a lot of contingent liability and antitrust risk as we cited in the credit profile on HOUS. We plan to do a more in-depth look and update on those cases separately. The numbers are as scary as one might expect in such massive cases, and the trial timelines shorten.
HOUS by the numbers…
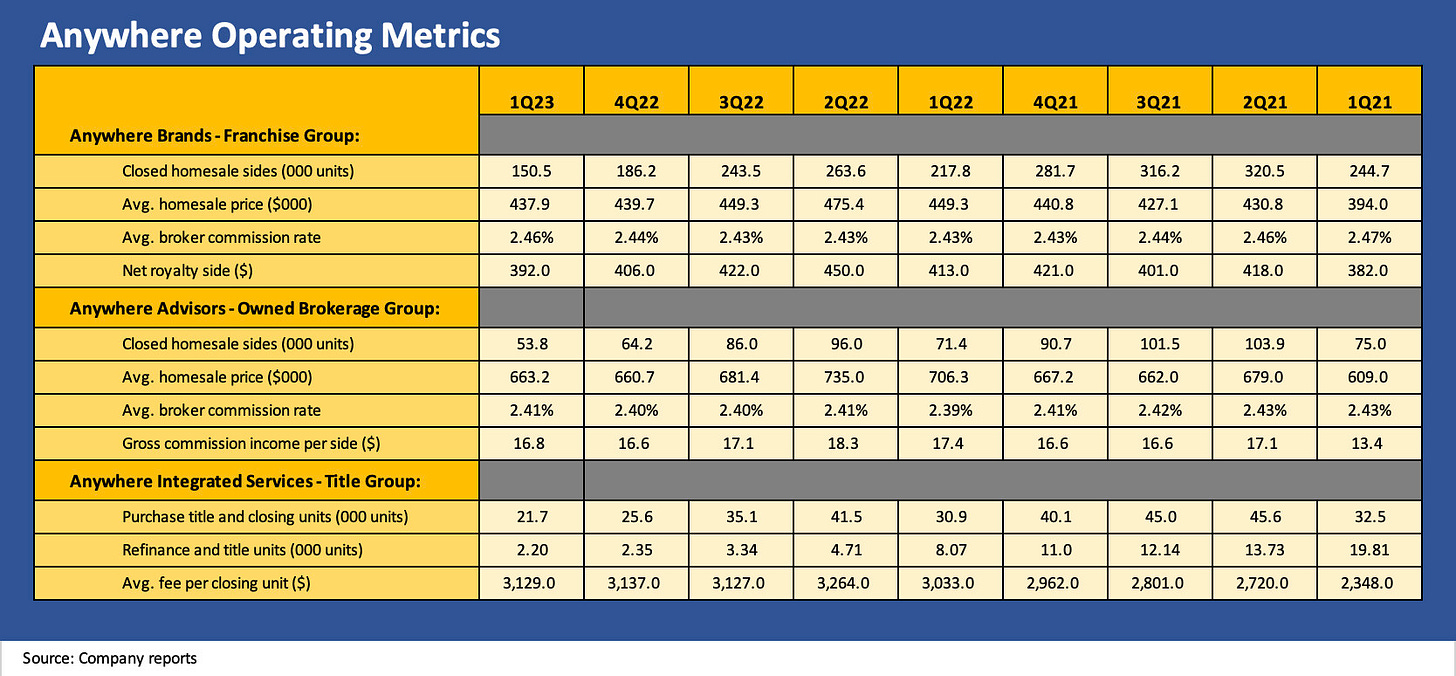
The financial highlights for 1Q23 are broken out above, and the trend is no major surprise. With volumes down hard, the effects naturally translate into materially lower commission levels. Refinancing is down as well with high mortgage rates and that flows into other areas of the business mix such as the Title Group segment. We look at those business lines and operating metrics in the following two tables.
The segment results added up to negative EBTIDA this quarter for a rolling LTM segment EBITDA of $328 mn. That EBITDA run rate is set against the net debt balance of $2,756 mn. That translates into 8.4x. That needs to improve sharply or you will be staring at EV multiples vs. leverage that implies very little stock value. You can extend the time horizon and lower the discount rate and play with the multiples to get more bullish, but some moving parts need to work out in peak selling season.
Anywhere is a very valuable franchise with good prospects across a cycle. The leverage is simply too high for the foreseeable future. The company is going to have a hard time staying out of the CCC tier on the bonds if the next move is some transaction that layers in more secured debt.
For the critical Owned Brokerage segment, that is a negative EBITDA line for the second straight quarter (not adjusting for the fees and royalty payments to the Franchise Group as detailed at the bottom of the table). On a 1Q23 vs. 1Q22 basis, that is an unfavorable EBITDA variance of $121 million. Using the combined 1Q23/4Q22 segment EBITDA run rates, that is an unfavorable swing of $266 mn in total segment EBITDA vs. 1Q22/4Q21.
Last years peak 2Q22 EBITDA was $202 mn just as ZIRP had ended and inflation was racing higher along with the UST curve and mortgages. The 6.4% area on mortgages in the current market has been swinging around by 100 bps this year, so the next leg of that move will weigh heavily on valuations and confidence levels to turn that EBITDA line in the right direction.
The operating metrics above give a clear read on volume and price. We looked at these in more detail in the bigger credit profile, but the sharp drop in “sides” (volume) is the main event. Price has not been the prime driver in the Franchise Group or the owned Group. The catalyst for pain has been the freefall in existing home sales (see Existing Home Sales: Still in Freefall 2-21-23).
We also see the title volume plunge on fewer sales and fewer refinancings. The recurring theme is that the legacy homebuyers and potential sellers are holding tight and will not sell into a high mortgage rate market. That undermines the move-up pace and slows down the multiplier effect for existing home sales.
The balance sheet story is last but not least since the leverage metrics at these EBITDA run rates are awful for equity valuation. They also damage the sentiment in the credit markets. The clean maturity schedule and room to maneuver with such an unsecured-heavy liability structure is a plus in the debate over default risk. The question is how much will they need and when. We refer to you to the credit profile for more discussions of the liability management planning the company had successfully navigated in recent years. The refi actions are evident in the tables and charts above.


