Existing Home Sales: Dead Calm
Existing home sales were relatively static and did not show much in directional signals in March 2023.
We look at existing home sales numbers and inventory showed little clear direction during March 2023 ahead of the spring selling season.
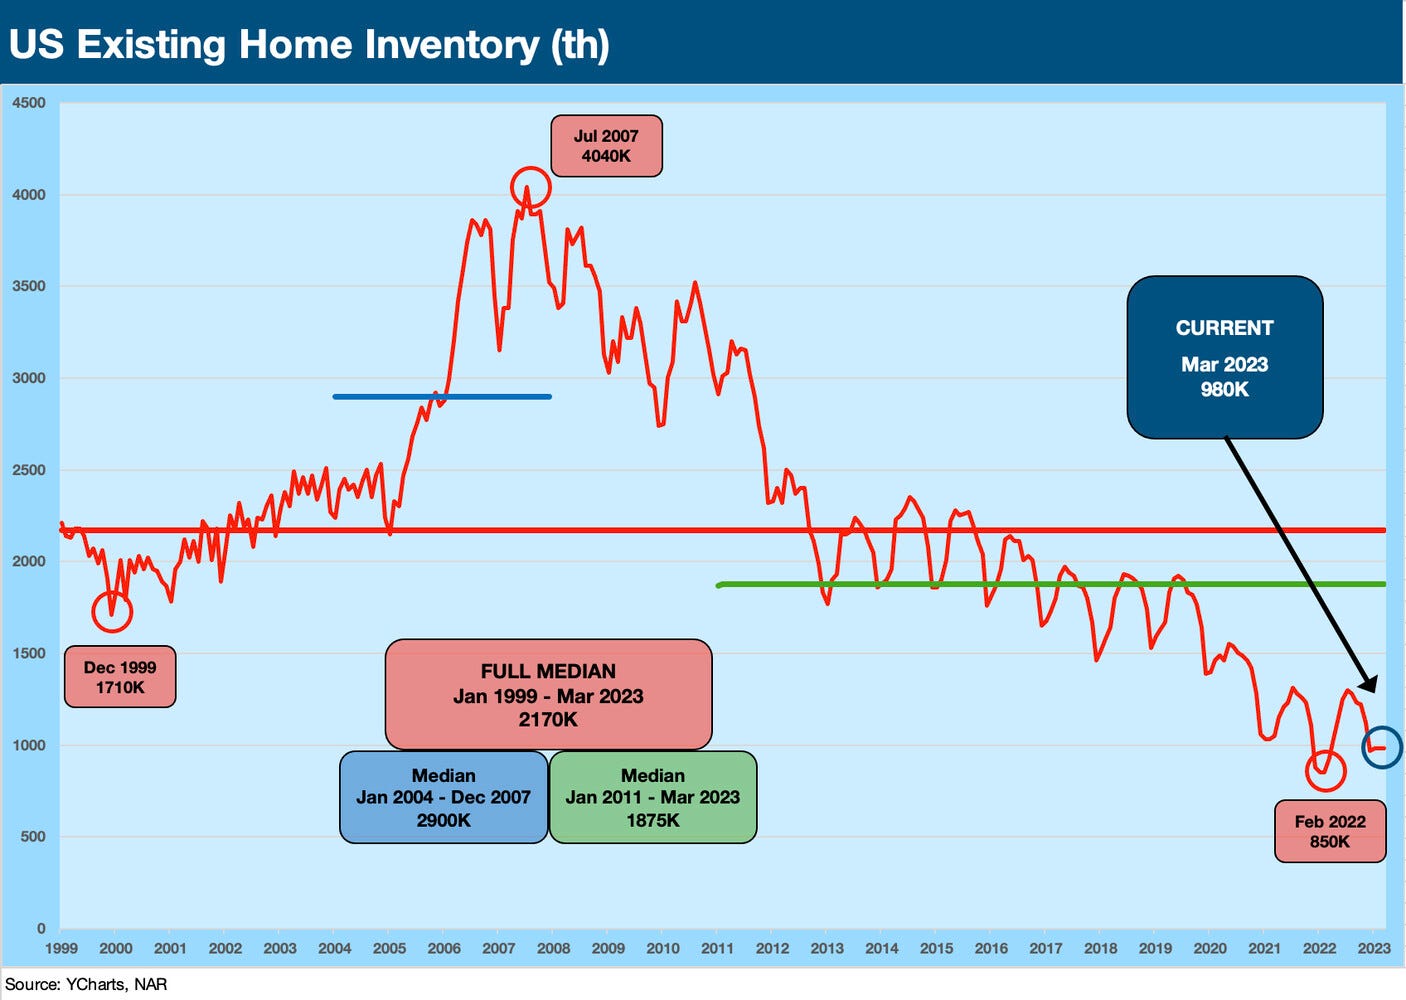
Sub-1 million inventory levels keep supply tight in historical context while the lower price tiers still need some “help” (as in lower prices) on decent demand among first time buyers and those searching at the entry level.
Existing home sales median prices dipped very slightly by 0.9% to $375.7K.
With three of the four regions showing sequential declines, only the smallest market in the Northeast showed a sideways move from Feb 2023. First time buyers were 28% of sales, up slightly from 27% in March after 2022 posted the lowest share of first time buyers in the time series history. The spike in mortgage rates and prices jacked up monthly payments, and the market is still adjusting and handicapping mortgage rates. We have seen a 100+ bps range in 2023. Many are waiting for a return to 5% handles.
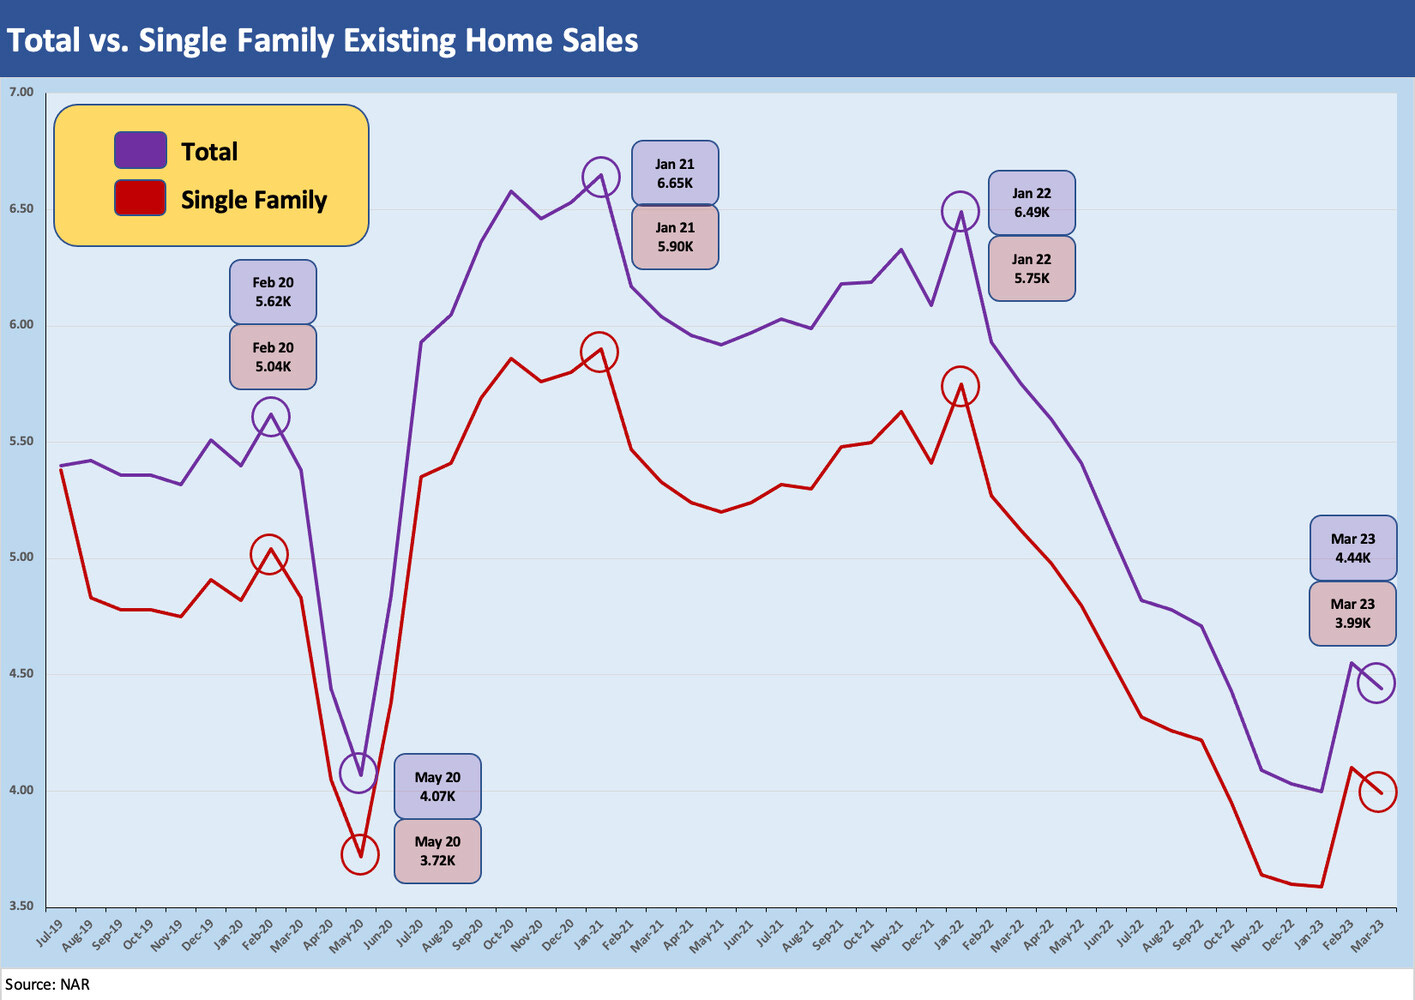
The above chart highlights the uptick off the lows followed by a small dip this past month. Depositor threats and recession fears might have fed anxiety for some potential buyers and sellers alike. The macro evidence still shows hesitancy to take the plunge at rates a few tenths above 6% at this point. Some sellers are wary on what is on the other side of the trade in a mortgage. There is also the headwind of buyers who expect home prices to be an eventual swing factor to mitigate the rate effect as the peak season kicks in. Some are simply waiting to see if the recession threat gets more visibility on the odds of something worse and they can make their decision with a fresh game clock on mortgages.
The above chart gives some timeline context to the monthly existing home sales volume. We are only modestly above the May 2020 COVID low as highlighted in the box in the upper right of the chart. Simply put, these are low numbers that signal the supply-demand balance for housing is getting some light support from reluctant sellers and buyers who expect lower prices.
The other X factor is the rising inventory of rentals coming online in the multifamily and single-family inventory pool. As we have covered in other commentaries, record payroll counts help demand, but there is a disconnect on the monthly payment side. The relative aggression of lenders also will be a variable to watch as the year goes on.
The above chart plots the existing home inventory in cyclical context, and the sub-1 million threshold qualifies as low in absolute count. That number comes with the asterisk of regional variances and price tiers. The long-term median of 2.17 million is a world apart from where we are now while the post-Jan-2011 median of 1.87 million is likewise extremely high compared to what we see today. A qualifier on that stat is that the demographics are more favorable for intermediate term demand. The headwinds in this market are about price and rates that flow into unfavorable monthly mortgage payments.
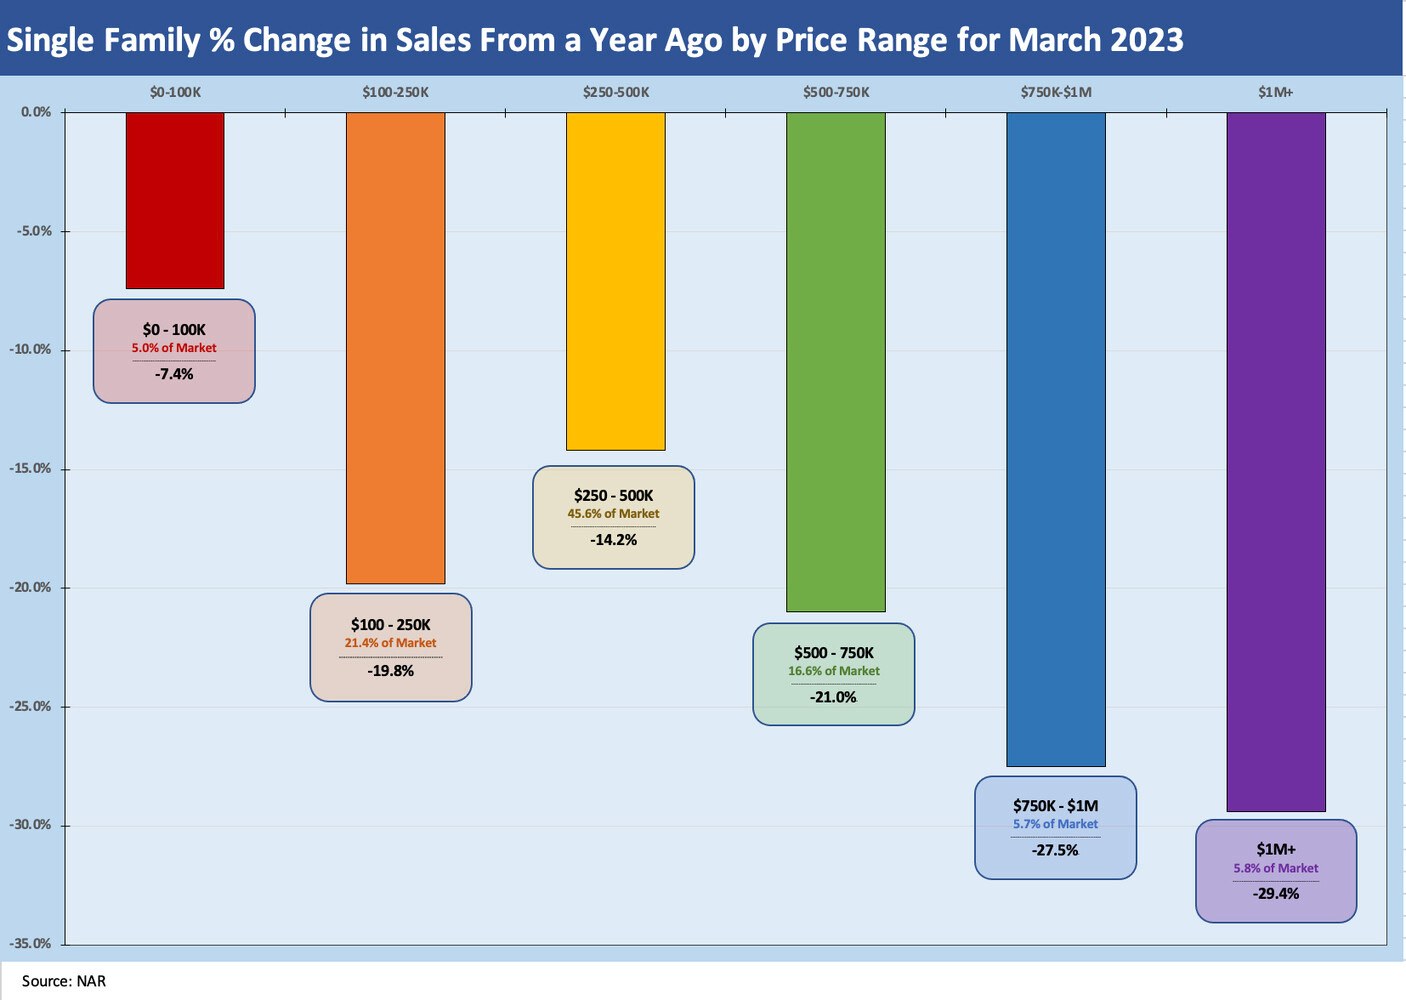
The above chart updates the volume declines in single family sales volume by price tier. We also highlight the market share of sales from each price tier in the box at the bottom of each bar for the price ranges. The YoY relative declines are starting to improve for almost all of these as the comps get easier. That is consistent with the sequential patterns we have been seeing from new homes sales to existing.
Action is low, and that includes starts. The only variable that is very high is construction in progress. That said, existing home sales dwarf new home sales, so the existing number is the best indicator of supply and demand in housing. With the peak selling season still ahead, the signals should get clearer although the Fed and mortgage wildcards remain the main event.
Overall, this month was flat out dull for this metric although perhaps depressingly dull for real estate brokers.


