Existing Home Sales: The Sun Will Come Out…When?
Existing home sales turn in a big jump from lowest to low.
“The sun will come out tomorrow. It’s only a year away.”
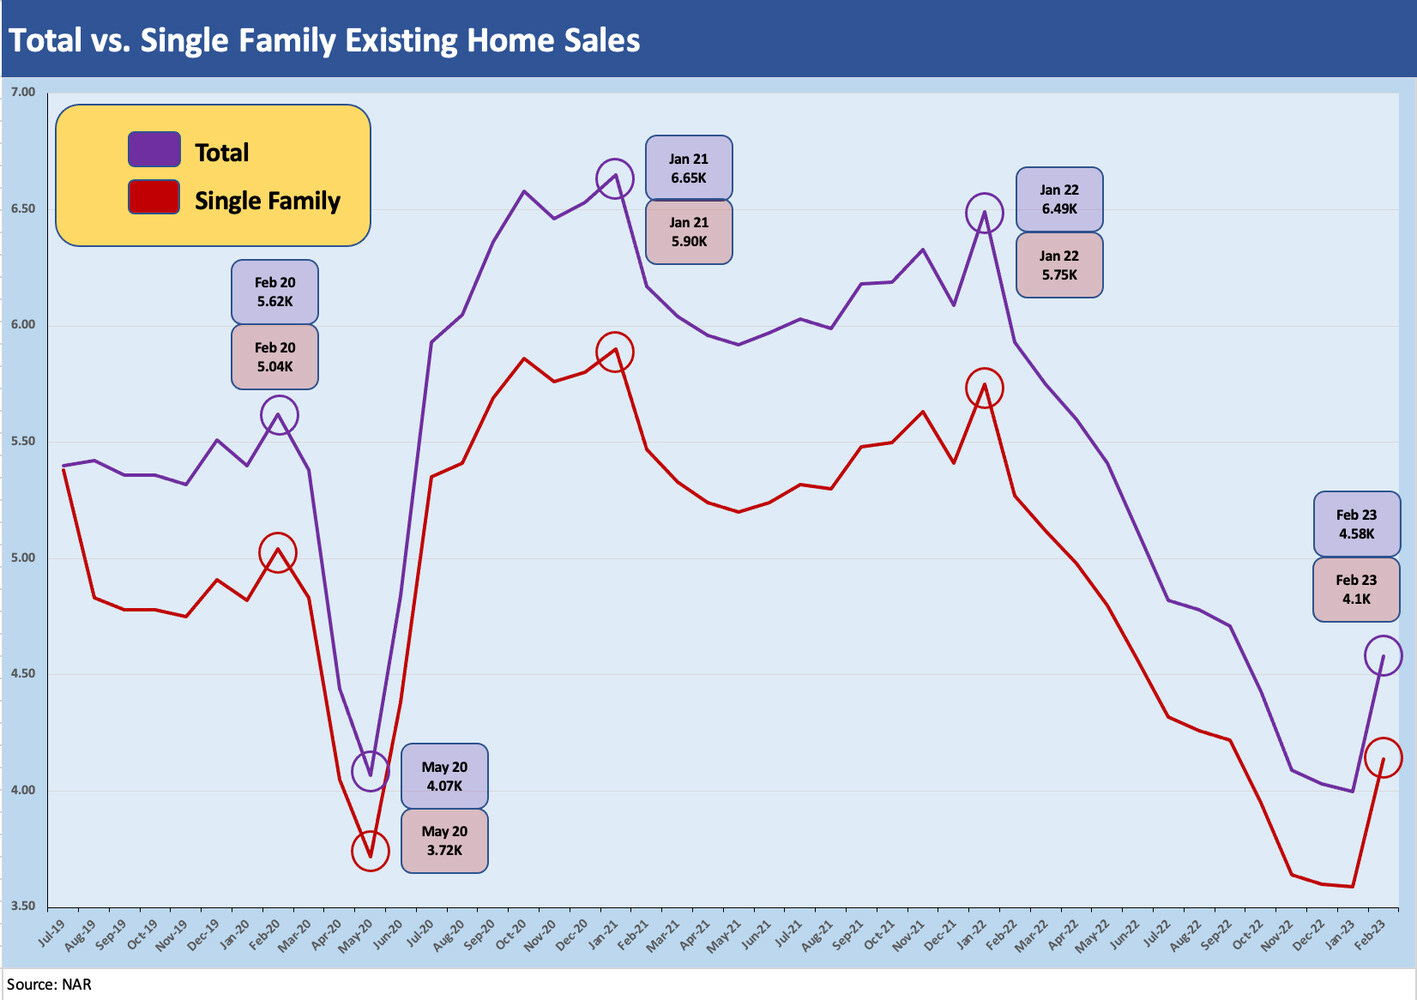
In the midst of a regional bank meltdown that may not see a symmetrical melt-up but a slower rally when the smoke clears, the existing home sales numbers for Feb 2023 brought some good news just ahead of a fresh round of inputs from the FOMC this week.
The favorable volume variances drove the largest sequential increase since July 2020, but the absolute run rates were down over 22% YoY and will remain constrained by affordability and low inventory at 980K.
The median price for purposes of the NAR release saw the $363 price down a fraction of a percent from the previous year.
Feb 2023 existing home sales bounced back from a rough January (see Existing Home Sales: Still in Freefall 2-21-23), and the results brought another reassuring sign that the large base of home equity in the hands of so many owners still means a lot to many, and “many” is good enough. Whether first time buyers or all-cash buyers – which together make up over half (55%) of the buyers – the demographic tailwinds are still calling for sustained need and demand for housing in some form. Timing and price is the tricky part for all the reasons we have also been discussing in the new home commentaries (see Housing: Starts, Permits, Construction, and Cyclical Moving Parts 3-16-23).
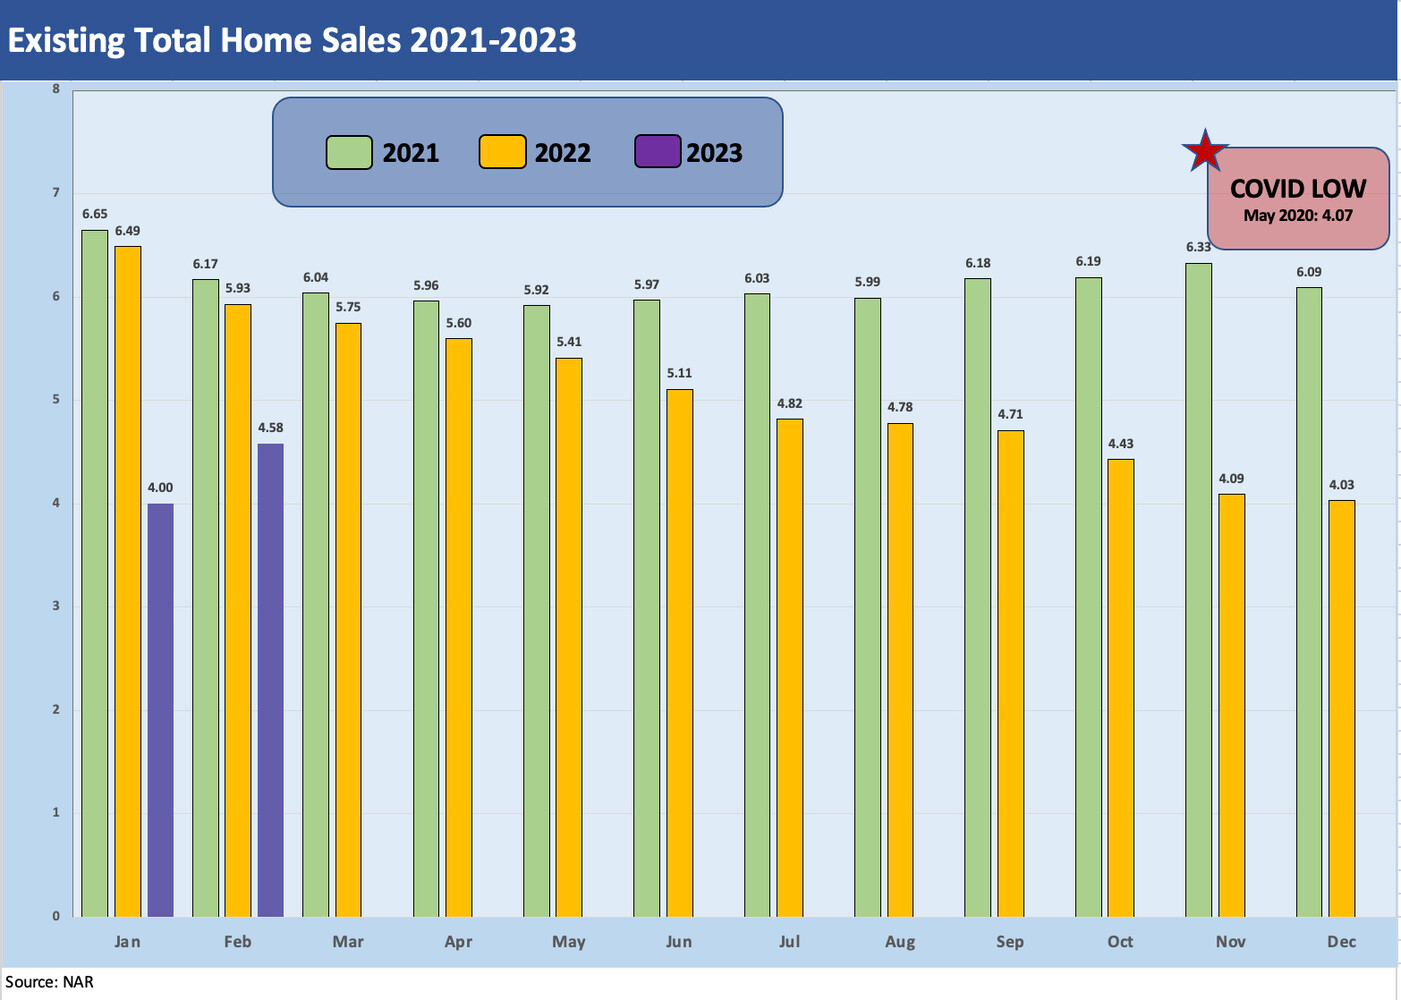
The above chart shows the months since 2021 lined up against one another with the Jan 2023 number even lower than the COVID low in May 2020. The February 2023 jump is framed against a very ugly month. The chart helps put what was a “strong Feb 2023” in context.
The mortgage rates are at least in a 6% handle range that was commonly seen in the housing boom before the crisis. The combination of mortgage payments on higher interest rates plus high prices make for a challenging story on buyer volume. That is also the case for companies whose numbers are directly tied to existing home sales and especially in the brokerage business (see Credit Profile: Anywhere Real Estate 3-1-23).
The above chart updates existing home sales inventory which remains very low in unit terms and was flat sequentially. That inventory was 2.6 month in total and 2.9 months for single family only.
The balance of inventory across existing home sales, new home construction, multifamily, and rentals from multifamily or single family supply will remain the juggling act. Affordability remains strained with prices still high and mortgages still lofty at around 6.7% last night, so the market still faces major headwinds.
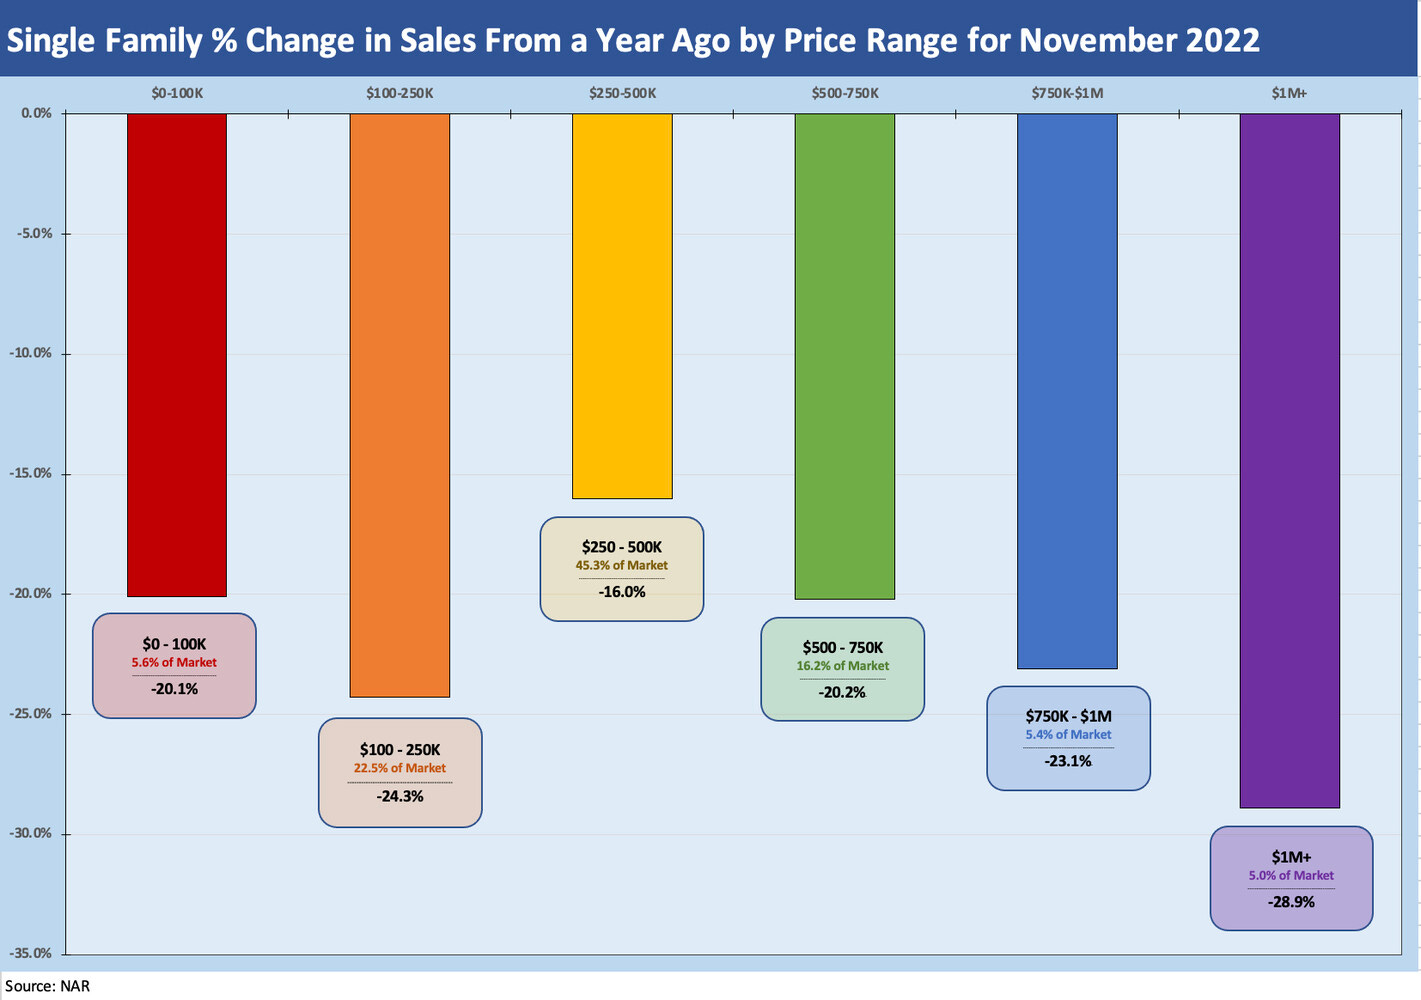
The chart above shows the declines by price tier where we also show the share of the overall market held by each tier. The luxury tier of over $1 M is showing the biggest decline but the $100-$250K tier is showing wear and tear also on mortgage qualification and rising monthly payments. The sweet spot of $250 to $500 has held up better.
The cross section of swings across the price tiers is always interesting from lower price segments to the luxury end. The housing market is diverse by product offerings, metro area price trends, and in terms of the natural diversity across urban, suburban, exurban, and rural. We like to watch the wide range of average selling prices by the homebuilders as a good illustration (see Homebuilders: Average Selling Prices by Company 2-17-23).


