D.R. Horton 2Q23: Company Comment
We take a look at D.R. Horton and its strong 2Q23 in a very tough market.
D.R. Horton - Seeing beyond the storm.
D.R. Horton posted respectable numbers in a very tough market with homebuilding gross margins at 21.6% and consolidated pre-tax margins at 15.6% on the way to a $1.9 bn 1H23 bottom line.
Resilient cash flow brings steady buybacks and dividends to keep stockholders happy and the rock-solid balance sheet is more like a single A credit quality than a BBB tier.
Homebuilding debt is lower sequentially as a maturity was paid down in cash before factoring in the nonguaranteed debt of the other profitable operating units.
We already have drilled down in a lot of detail into the D.R. Horton (ticker DHI) credit story and its extremely low financial risk profile (see D.R. Horton: Credit Profile 4-4-23). The themes and trend lines did not change much with the reporting of the March quarter and F2Q23 (F1H23) for this September FY company.
As the #1 builder with low average prices given its scale but with a diverse product mix across the price tiers, DHI offers a good read on how some homebuilders can adapt in a much tougher market. The stock market reaction to earnings was immediately favorable on earnings day at+5.6% (giving a small fraction back this morning as we go to print). DHI’s very healthy free cash flow allows steady dividends and over $421 mn in stock buybacks with $1 bn expected for the FY 2023 (9-30 fiscal). We update some of the segment numbers further below in this note, but we keep the segment details brief and refer the reader to the bigger credit profile for segment histories.
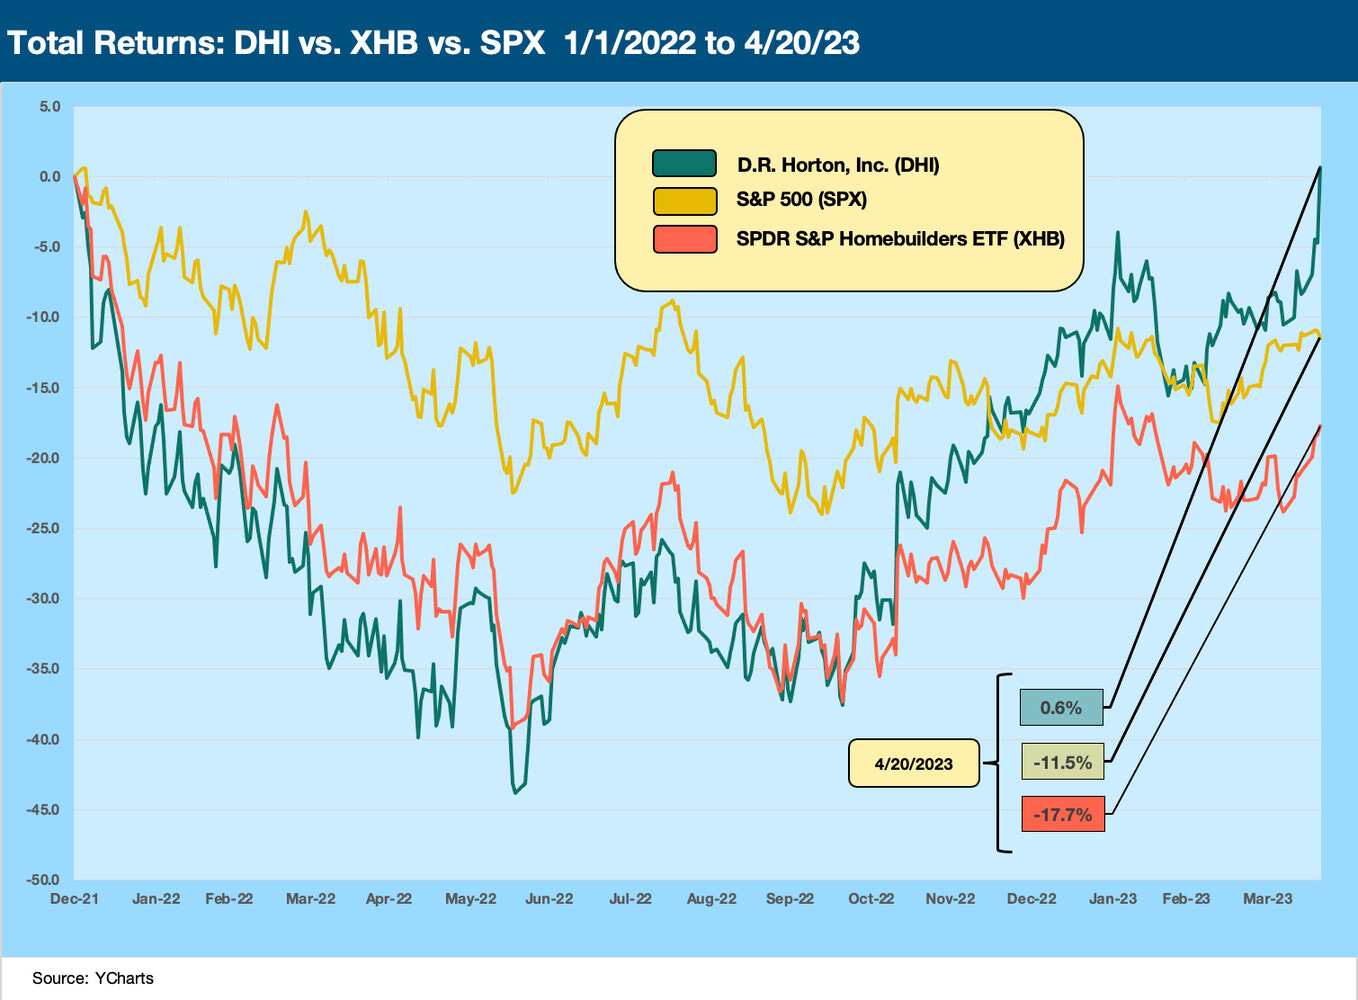
The history of the D.R. Horton stock is worth a look vs. the performance of the market and the industry group in the recent turbulence of the 2022 yield curve shift. Inflation fears brought Fed tightening and a nasty upward migration of UST curve that painfully influenced mortgage rates in the most rapid move since the Volcker years. Mortgage spreads are disproportionately higher now relative to where the UST curve stands. In an earlier piece (see Footnotes and Flashbacks: Week Ending April 2, 2023), we compared 30Y mortgage rates today vs. the days of the housing bubble (2005-2006) when 6% handle mortgage rates were evident but with a materially higher curve in 2005-2006 than we see in current times.
The above stock return chart frames DHI up against the overall markets and XHB. The ability of DHI to navigate such a market is getting a favorable vote in the stock markets and notably vs. other homebuilding operators as evident in the XHB (builders and suppliers both included). The fact that DHI beat the S&P 500 might be more surprising to some than the fact that it beat the homebuilding exposed companies. Track record and low financial risk helps.
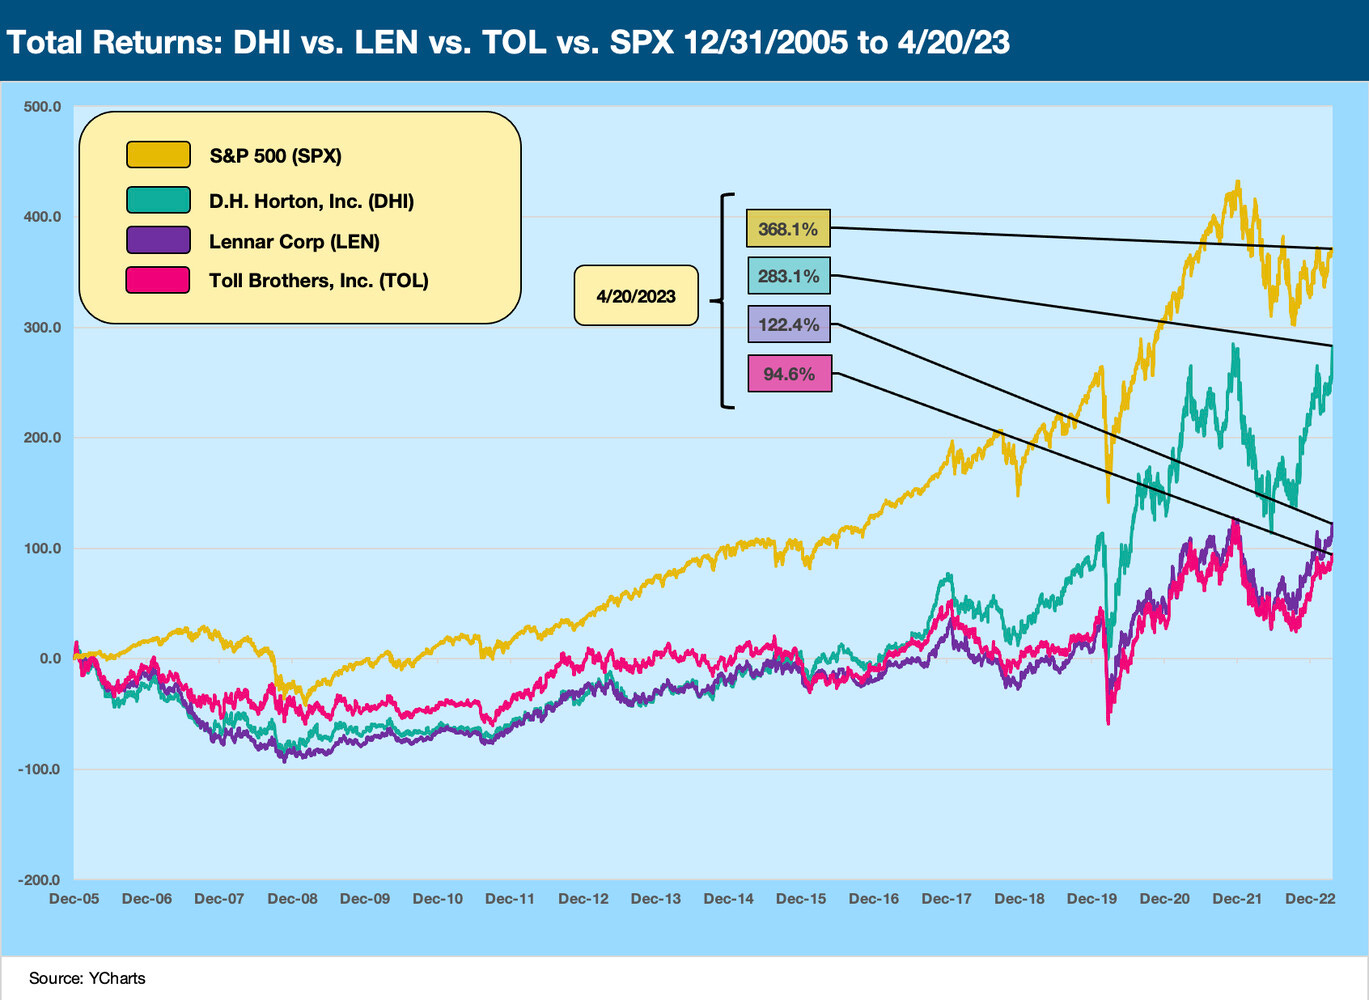
This chart makes for an interesting peer group frame of reference. We plot the total return time series for DHI vs. Lennar vs. Toll Brothers. We start the time series at the end of 2005, which was the peak of the homebuilding cycle during the housing bubble years. We plot those three vs. the S&P 500. Given the killer swoon in the housing market, it is no surprise the S&P 500 posts better long-term numbers since the housing peak, but DHI turned in the better performance vs. its two successful and well-respected peers. A lot has happened since then obviously with a lot of consolidation, but DHI posted numbers that stand up well.
Those three builders – DHI, LEN, and TOL – are names that were active in the debt markets across the cycles. In the aftermath of the credit crisis, each of them had a journey from financial crisis era HY ratings on the way into the IG index. We like the business mix of these three as a peer group comp with DHI showing the lowest average selling prices of the major builders and TOL the highest (see Homebuilders: Average Selling Prices by Company 2-17-23).
We would argue that LEN as the #2 builder has been more diversified across the cycles with myriad business line strategies in asset management and multifamily. They have been simplifying the mix in more recent years. The three give a broader angle on a narrow industry group.
By the numbers….
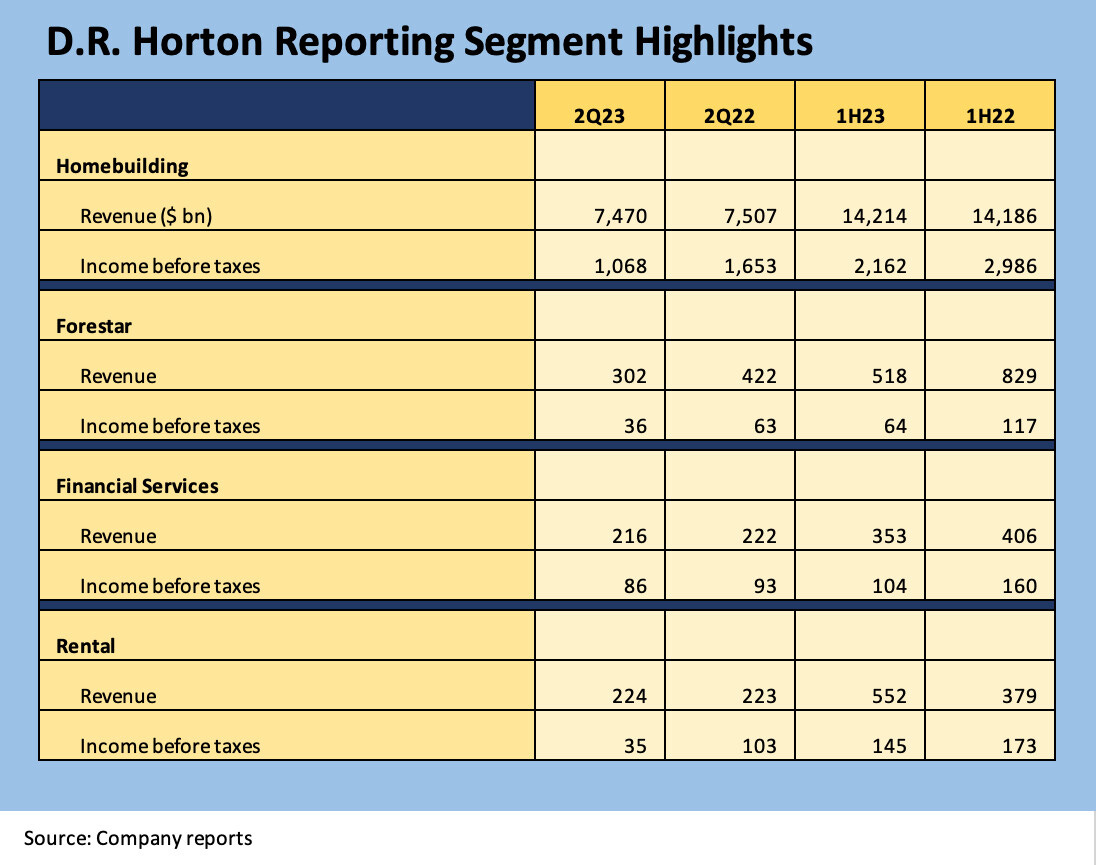
Below we post an excerpt of the D.R. Horton segment numbers. We detail the segment reporting revenues and income before taxes but skip the disclosure of corporate intercompany reconciliations to consolidated total. The guidance was constructive set against the reality of the housing market, but an important guidance number was for “cash provided by both consolidated and homebuilding operations greater than fiscal 2022.” To us, that is the main event as the markets await the next move in mortgage rates and the performance in the peak selling season.
We cover the segment stories and business mix evolution in detail in the credit profile report. The important structural risk factor is that D.R. Horton and its building unit do not guarantee the debt of the non-homebuilding operations (Forestar, Financial Services, Rental). The Homebuilding segment debt of $2.68 bn (the debt owned by bondholders) is only around 45% of the total DHI debt of $5.97 bn. The other segments are stand-alone borrowers not guaranteed by D.R. Horton or the homebuilding units. Each segment is profitable with solid margins as a stand-alone operation.
We highlight the steady rise of the Rental segment as a stand-alone operation over the last few years while also flagging the Forestar majority owned subsidiary as the most cyclical as a lot/land development operation. The business lines present a pure numbers game in many ways with volume in a downturn and pricing softening. Net sales orders were down 5% in 2Q23 and total value was down 11%. For 1H23, sales orders were down 20% and total value down 25%. As noted earlier, cash flow from operations will be higher vs. FY 2022.
We have looked at the cash flow dynamics of the working capital cycle in other commentaries. The main point is the peak selling season is unfolding and the sell-down of inventory and construction in progress will drive cash flow. Starts and completions are the inevitable balancing act as mortgage rates remain the wildcard (see Footnotes and Flashbacks: Week Ending April 2, 2023).


