Credit Spreads: Quality Differentials 2022-2023
We look at spread trends and quality differentials in 2022-2023 as risk appetites and pricing get reassessed.
"Navigating 2022-2023: this isn't so hard."
We look at some of the benchmark quality spread differentials along the credit spectrum across a timeline of Fed tightening, energy shocks, an upward migration of the UST curve, and crisis event scenarios that still leave us with below median spreads.
The HY market is generally not easily spooked, and the past years and recent months bear that out as the market stood firm in 2023 in the face of the debt ceiling threat and shook off the regional bank crisis relative to the pricing waves of summer/fall 2022.
We look at spread and quality differentials for HY vs. IG, the BB vs. BBB speculative grade divide, and the Hi-Lo differential of the CCC vs. BB tiers.
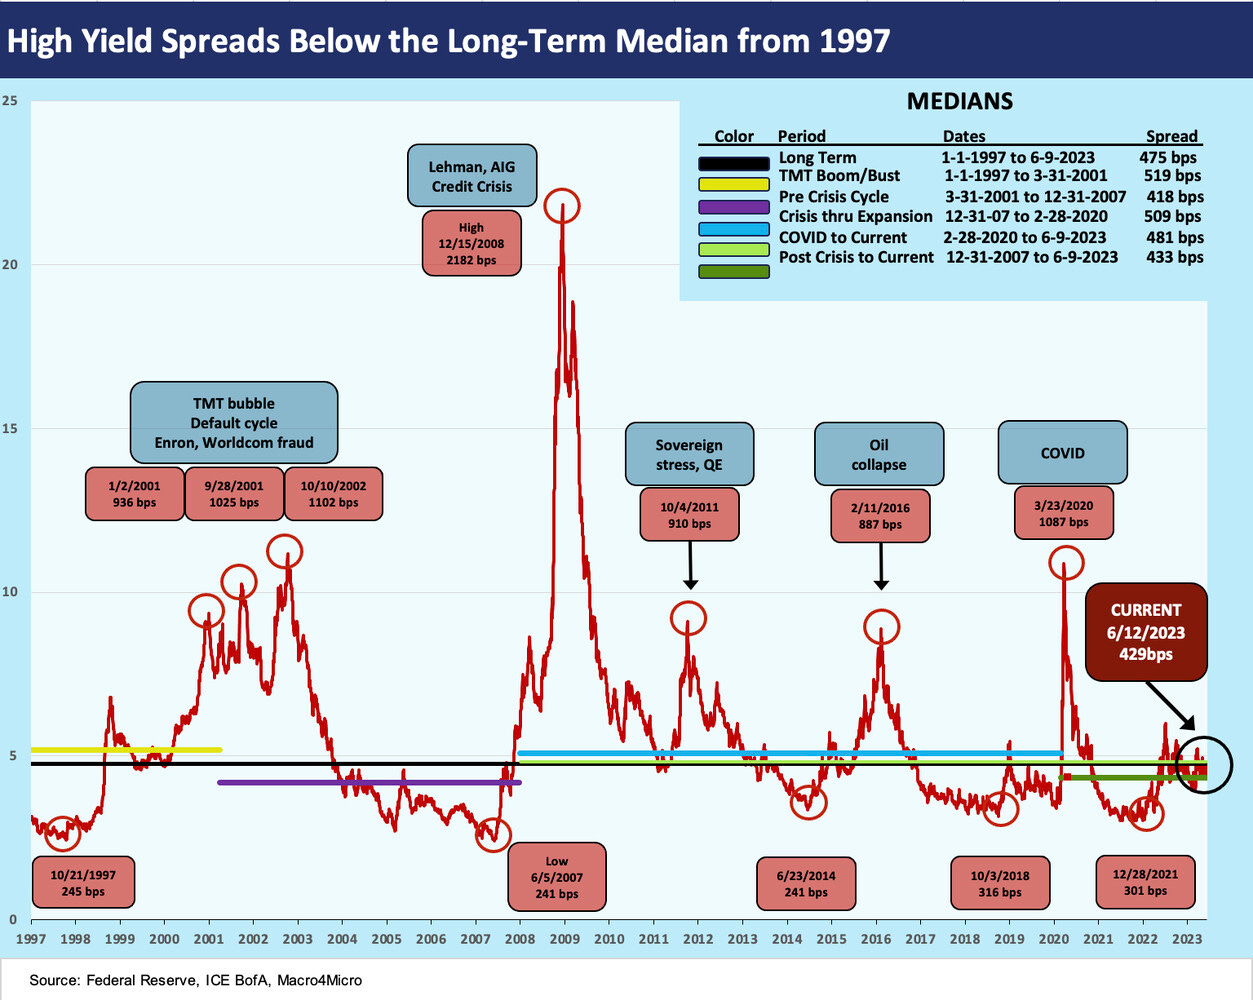
We will provide more commentary on long-term multicycle quality spread differentials in a separate commentary, but we include the chart above for a look back to the TMT years and across the ensuing credit cycle. The history offers perspective for the 2022-2023 timeline we look at in this commentary. The long-term median of +475 bps offers a good benchmark guideline on what is “normal” in US HY pricing. The chart above offers a range of medians from different time horizons as highlighted in the box.
Factoring in the BB tier heavy nature of today’s market is a factor, but the overall B1 composite rating does not make it much different even if less concentrated in the B tier than in the pre-crisis cycles (note: the Index was a B1 composite in 2007 and 1997). The investor demand mix is also quite distinct with more IG buyers stepping down into the BB tier. HY Classic demand may be similar, but the middle section of the credit tiers (BBB and BB) is where more mainstream funds navigate now than in prior cycles.
The credit risk premiums during the inflation ride 2022-2023 and the accompanying tightening cycle leave us with current spreads below the long-term median from 1997 as well as the median since the start of 2022. That underscores the high confidence in credit resilience but also the relatively light compensation for taking risk.
The backdrop of US HY now is that default rates have been extremely low and remain so. As history has shown, default rates are a lagging indicator and spreads are influenced by the combination of expected default rates, recoveries, and outflow risk in a market with impaired secondary liquidity (no matter what people say in good times). For now, however, the expected default rates remain low, credit stress is well contained, and the economic cycle is holding in better than most expected in the summer and fall of 2022.
The spike in rates materially raises the cost of refinancing HY bonds, and the unwillingness to redeem bonds on unfavorable economics means a steady accumulation of a maturity wall that heightens structural risks in the market. That includes refinancing risk that could unfold during a recession. That has been leading to a steady upward rise in default rate forecasts looking out 2-3 years.
The chart above plots HY vs. IG spreads since the start of 2022 ahead of the end of ZIRP in March 2022. We don’t have to revisit the Russia-Ukraine energy turmoil, inflation rise, and Fed tightening here, but that was a turbulent stretch for risk pricing. HY OAS neared +600 bps by early July 2022 vs. the current +429 bps.
We plot HY OAS vs. IG OAS while highlighting the highs and lows of each time series. We then highlight Max and Min differentials across the period plus the current differential. We include the starting point above (1-3-22) with US HY on the way to a HY OAS Min for the timeline of +327 bps (4-5-22). That was not far from cyclical lows and well inside the current +429 bps.
The few major spread waves experienced in the 2022 turmoil (early July and late Sept 2022) were set against some ugly macro variables with inflation spiking, the energy markets roiled by Russia-Ukraine, and Fed tightening in fast and furious mode. That sent the HY-IG differentials wider to +432 bps (7-5-22) vs. the current +288 bps (6-12-23). The recent differentials are a long way from the +208 bps HY-IG differential of early 2022.
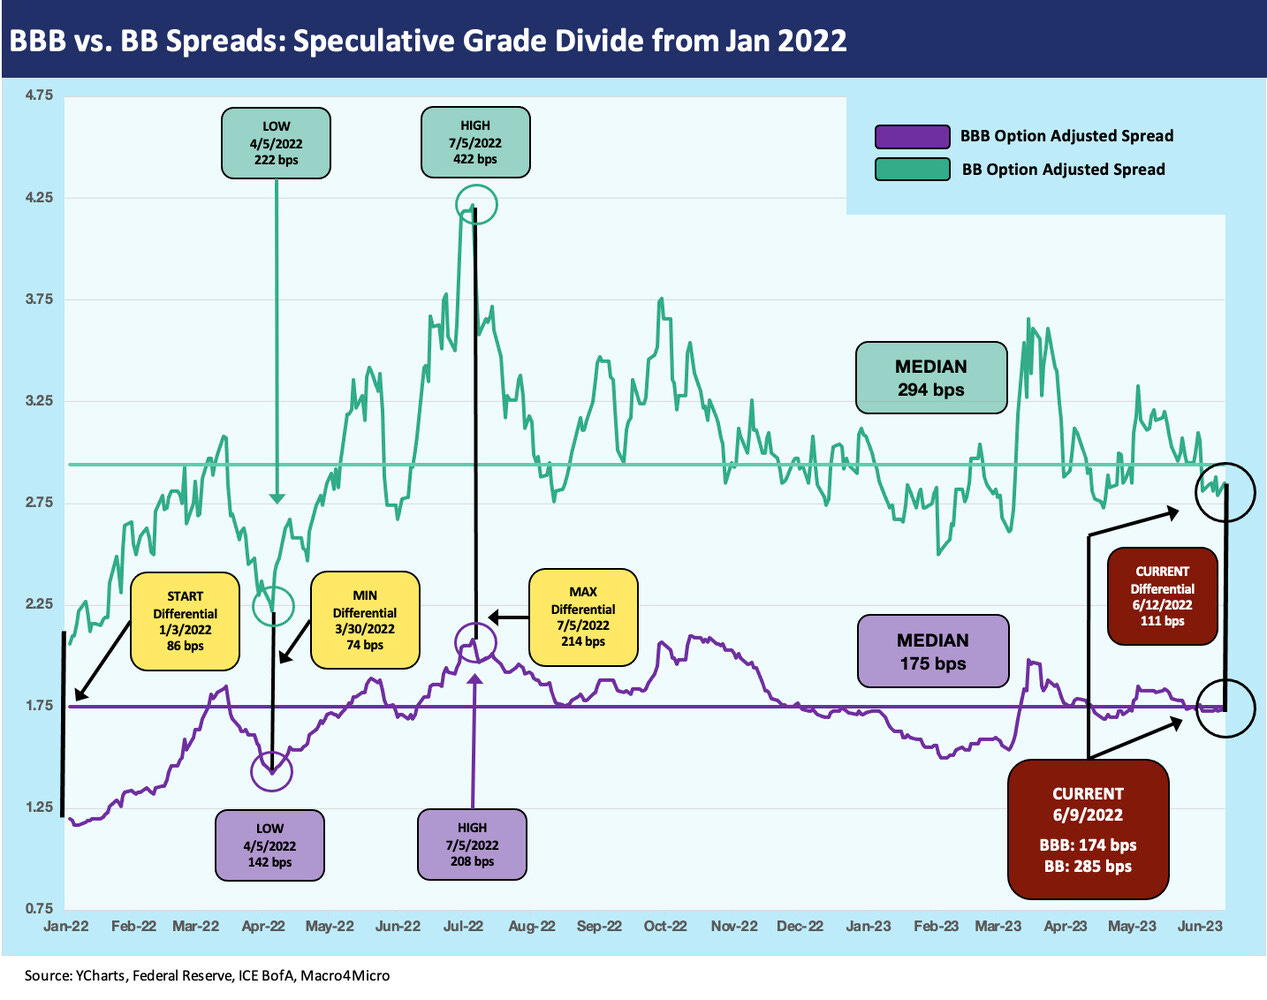
The above chart captures the credit spread moves along the speculative grade divide with the BBB and BB tiers detailed. The differential of the two tends to still get a lot of focus as the somewhat arbitrary dividing line of what is speculative grade vs. investment grade. The regulatory distinction has allowed rating agencies, street P&L managers, and mutual fund product architects, among others, to use this distinction “for fun and profit” (and market power) for decades rather than looking at the risk-reward continuum as part of a logical pattern. The idea is that Baa1/BBB+ to A3/A- is a hurdle, but Ba1/BB+ to Baa3/BBB- is a pole vault. The downside is a stumble and a face plant, respectively. So much for the continuum. It used to be called “regulatory arbitrage,” but that price distorting effect has eased over the years.
Looking at the spread time series, the BB tier OAS is now modestly below the 2022-2023 timeline median of +294 bps while the BBB tier Is currently slightly below the median. The differential of BBB vs. BB has widened by around 25 bps from only +86 bps to start the time series.
The above chart frames the same set of metrics but instead using the Max-Min differentials of the CCC tier vs. the BB tier. This measure gives a sense of how the market is pricing the lowest risk HY sector (BB) vs. the riskiest sector (CCC).
The theme in this comparison is that the B tier posts exponentially higher long term default risks than the BB tier and the CCC tier exponentially higher than the B tier. In other words, this spread differential of CCC minus BB spans a very material increase in risk and tells you what the market is paying for you to take it.
The BB tier is inside the timeline median (2022-2023) and so is the CCC tier. Both are materially wider now than at the start of 2022 as noted. The current CCC OAS is a long way from the 600-handle of Jan 2022. The Max CCC-BB differential of +935 bps (11-9-22) is now down to +717 bps. That is still well above the differential Min of +447 bps (1-20-22). The gross OAS for CCC and BB and differentials are highlighted in the chart.
What next?
The timeline we plot from 2022 to current days cuts across recurring worries around how the economy would hold up under the strain of a spike in oil and gas, inflation soaring, and the Fed tightening. Back in the fall of 2022, many commentators (even beyond Washington politics) announced the US economy was already in recession. In the minds of many, the hard landing would be home by Christmas. We did not see it that way even if just on employment trends and manufacturing demands after a supplier chain crisis (see Unemployment, Recessions, and the Potter Stewart Rule 10-7-22). That said, we did expect a mild recession and softer landing (definitions vary) in later 2023. At this point, that recession outcome is still a very debatable point for 2H23 and may extend the uncertainty of a slowdown into 2024.
As we put the debt ceiling crisis in the rear view mirror and realize that the stimulus legislation, the infrastructure bill, the CHIPS Act, and IRA are printed and flowing into investment and jobs, one might argue the conditions are in place for the strong jobs and PCE lines to play out with some decent numbers flowing into fixed asset investment as well. That leaves us with inflation and monetary policy on the front burner.
We will get a detailed inflation read on Tuesday with CPI and on Wednesday with the Fed reaction. The geopolitics of Russia-Ukraine and China-Taiwan will remain a lurking reality that are very hard to price until after something very specific unfolds. Trade stress with China looms large. The next leg of the ride begins, and we are sticking with our view that HY spreads are too tight for the overall balance of risks. The FOMC will have something to say to the risky asset markets after CPI, and HY holders will be watching the equity market reaction. That has been a source of support for risk appetites.


