
HY Spreads: Proportions and Risk Compensation
We revisit and update HY spreads as a % of 5Y UST for some perspective on relative risk premiums.


While the debate on the cycle and the degree of correlation of HY with equities are always variables in the discussions, the absolute level of HY OAS vs. the proportionate relationship with UST and investment alternatives allows for some objective time series to ponder.
We rerun the multicycle timeline on HY spreads and frame OAS in % terms vs the 5Y UST as a gauge of proportionate (or lack of) compensation in the risk premiums.
Higher returns for higher risks is as old as investing, and in credit markets spreads is the baseline measure in terms of what gets tacked on to UST.
With UST rates moving so quickly and absolute yields much more attractive, it is good to rethink the risk premium part of the contribution to all-in yields in historical credit cycle context.

Looking at spreads and making quantitative and qualitative assessments along the yield curve is a routine drill in credit research and in framing relative value. Every now and then it is good to look back across time to consider any patterns in the relationships. In this note, we look at HY OAS vs. 5Y UST. We chose the 5Y UST given that the 5Y UST is at least in the zip code of US HY benchmark duration and the 5Y UST is a useful benchmark generally. We do the simple exercise of HY OAS % 5Y UST. What the ratio lacks in technical virtuosity it somewhat makes up for with common sense.
A quick look at HY OAS…
The above chart replays HY OAS histories with some medians for relevant time horizons and a few events associated with spread highs. We note the 200-handle lows of 1997 and the 2007 bubble and a few 300 bps handle lows in OAS in the post-crisis era (2014, 2018, 2021). The fact that we have been down into mid-200 range spreads before keeps bears honest with UST rates now very similar to some of those earlier credit market record lows in HY OAS (Oct 1997, June 2007). It is worth noting that the low OAS of Oct 1997 was set against fed funds of 5.5% and the low of June 2007 saw fed funds of 5.25%. The differences out the curve are for another day and commentary. We also see several HY OAS trips to the low 300s in the post-crisis era including late 2021. We almost cracked 300 bps in HY OAS in Dec 2021.
The idea that a rejuvenation of risk appetites in 2H23 cannot be ruled out, and surprise HY rallies are a matter of history. We don’t see that outcome in 2H23 with services inflation unlike anything we ever saw during those early periods. The market is now way beyond ZIRP (2014, 2021) with more Fed tightening still a threat this year. The aftermath of those lows (including a brutal 4Q18) are worth remembering with each having its own set of risk factors and distinctive industry stories (notably energy in 2014 and 2018 and TMT in 1997).
We have looked at the spread histories for US HY in the context of today’s profile of “below median spreads for above median risks” (see links at bottom of commentary). Spreads were beaten up after the Silicon Valley meltdown (see US HY Spread Histories: Weird Science, New Parts 3-19-23 ) as they headed north of the 500 bps line again as they did in the fall of 2022 (+550 late September) and after they almost hit 600 bps in the summer of 2022 (+599 bps early July). The cyclical debates continue in HY just as in the broader risky asset markets, and the coming weeks will hold some very important indicators (notably CPI, PCE, and employment) and potential FOMC actions (or lack of).
Refi and extension anxiety…
The recession case has lacked a sea level fundamental catalyst right now despite the steady upward revisions in expected default rates and some fears of a shortening maturity wall. HY faces disincentives tied to the costs of refi and extension, and that starts to weigh on the structural risk checklist.
The words “maturity wall” get mentioned in every cycle early and often, but the latest differentials on coupons vs. market clearing coupons leaves treasurers in a tough spot. Jobs (the Treasurer’s job that is) ride on a bad decision. The shortening maturity calendar could become a dangerous game if the Fed gets more aggressive or more cyclical or commodity industries falter in quality. That is true with the consumer as well, but that part of the story has defied the bears (e.g., housing, autos).
The hope for lower rates and a soft landing (or no landing) keeps many in the game in US HY even if just on the basis that 8% handle yields are like marching down memory lane. After years of ZIRP and QE, the all-in yields are a magnet even if risk pricing is well below median spreads and well inside the highs of 2022.
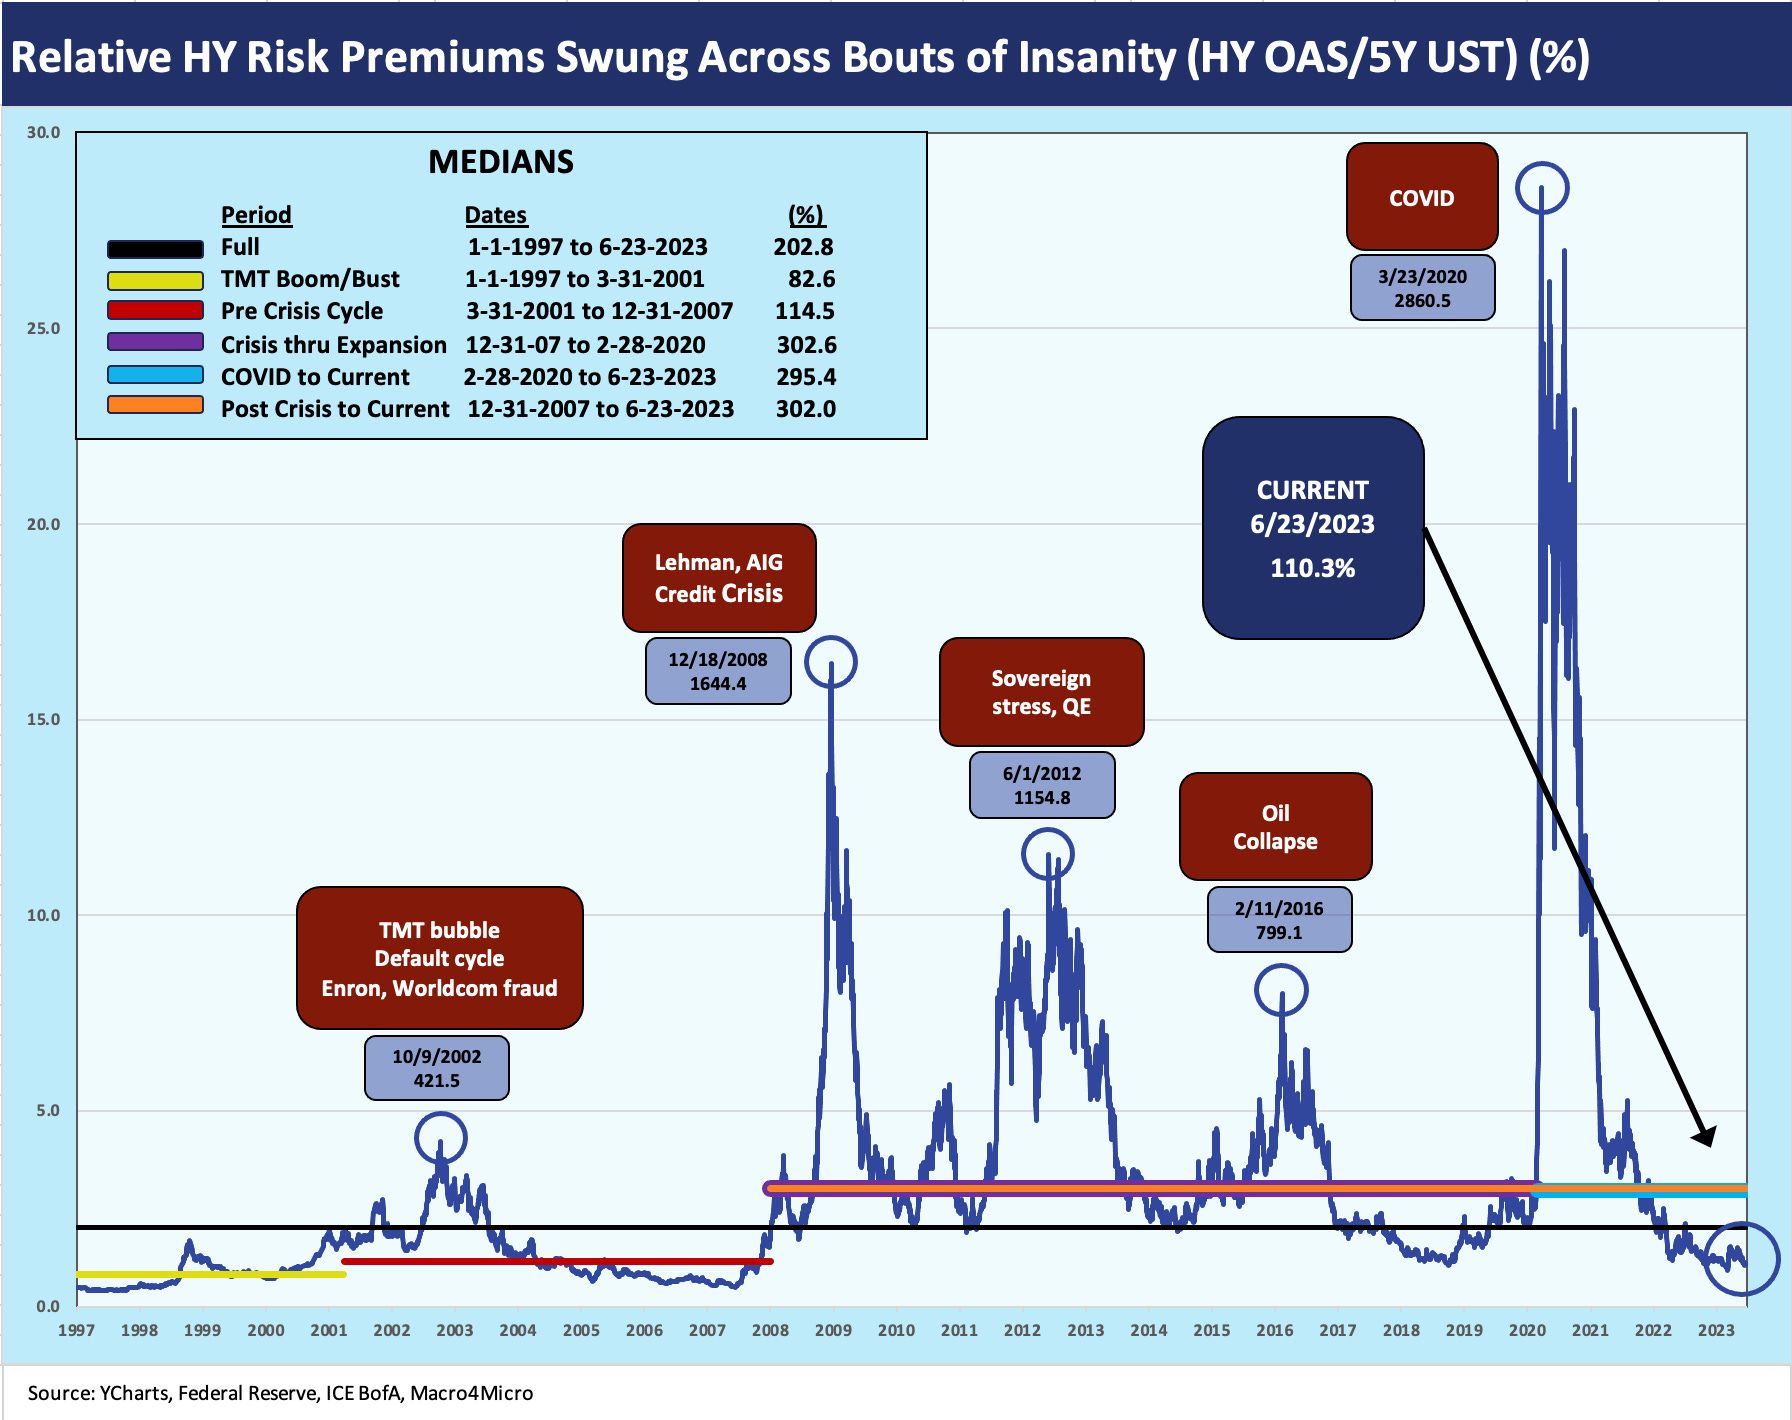
The above chart revisits the HY OAS relationship to the 5Y UST. We essentially plot OAS % 5Y UST yields. In today’s market that is around 107% using +430 bps OAS on the Tuesday HY Index close (Source: ICE BofA). The above chart posts from 1997 through the Friday 6-23 close. If we look at the medians provided in the box in the upper left, current HY OAS % 5Y UST are low in context and have more in common with the 2001-2007 structured credit and housing period and are modestly above the 1997-2001 TMT period. The long-term median is close to double at +203%.
We don’t want to detail all the point-counterpoint on this angle and the low denominator effects of various periods. We always come back to the simple idea of the denominator being the investment alternative in fixed income whether UST or IG. It is just food for thought. That OAS % 5Y UST alternative relationship is one of a list of items we have discussed along the way that makes us more positive on IG vs. HY.
In a normal cyclical downturn, the quality spread widening usually reverberates from the bottom up. The 2008 downturn was different as the bank system cracked. Then the quality spreads reacted after the banks from the bottom up, and HY did so in dramatic fashion! Credit contraction was the dagger.
A few questions to ponder…
The debate on how to frame relative value and fair compensation for credit risk is an old one. A few obvious questions make the short list.
Do we judge relative value by absolute minimum return expectations for the risks being taken over the investment time horizon?
Should we rely more on relative yields or relative spreads vs. investment alternatives regardless of the minimum expected returns?
Should we frame absolute HY spreads as the key ingredient or the incremental spreads in % terms relative to the risk-free returns (OAS % UST)?
It is probably no surprise that we say “look at all of it,” but the backdrop today in OAS vs. UST levels shows the compensation for risk to be relatively low in historical terms. Toggling back and forth between all-in HY yields and relative spreads refines the analysis. The demand for US HY can lean on 8.5% area yields. That is a short walk from the long-term nominal return on equities.
With default forecasts rising, Fed implied action remaining ominous, inflation still double FOMC targets, and a balanced cyclical debate, spreads have a mixed picture at best. The fact that we saw 500 bps handle spreads (low 500, mid 500, and high 500s) in 2022 makes a case for waiting for 10% yields in US HY.
For the asset class constrained, the strategy is to be more defensive in issuer and industry allocation in HY. The market will be waiting for a quality spread widening stretch in coming months. As good as 8.5% yield may seem after years of yield starvation, 10% handles are better. There are also alternatives in higher yielding private credit and a growing laundry list of other investment options outside the traditional “IG vs. HY” allocation wrangling.
Allocation trends into bonds and credit have been strong in 2023, and we have seen more reallocation to bonds with the run-up in yields. The higher all-in yields have largely ridden higher on the UST curve’s upward migration rather than spread widening. HY spreads have tightened in 2023 vs. 2022 despite the whipsaw after SVB in March.
Just the idea of seeing these kinds of yields (5.5% area in IG and 8.5% in HY) has generated excitement in asset allocation decisions. A more prudent allocation to bonds of course makes sense at these levels. The question is how aggressively to weight the exposures along the risk spectrum. In that exercise, spreads should still be considered in historical context.
For my own portfolio, I lean toward short UST at this point. While that only gets a participation ribbon in the “no guts, no glory” contest, I view waiting for higher spreads as more prudent in my “post-Medicare” portfolio. For those looking for current cash income in a portfolio, the par weighted coupon of 5.9% for US HY (5.2% for BB tier) is well below the current posted yields. In some cases, the lower dollar price is more attractive and in some cases the cash income is first in line. That is a tailored analysis for each investor whether cash coupons are drawn down (e.g., retirement funds) or reinvested at higher current rates. That is always going to be portfolio specific.
See also:
Fed Funds vs. Credit Spreads and Yields Across the Cycles 6-19-23
Credit Spreads: Quality Differentials 2022-2023 6-12-23
US HY Spread Histories: Weird Science, New Parts 3-19-23
Spreads Across Tiers: Decompression + Volatility 3-18-23
Those Were the Days: HY Relative Yields, HY Relative Risk Premiums 2-9-23
HY-IG Spread Compression 2-8-23