

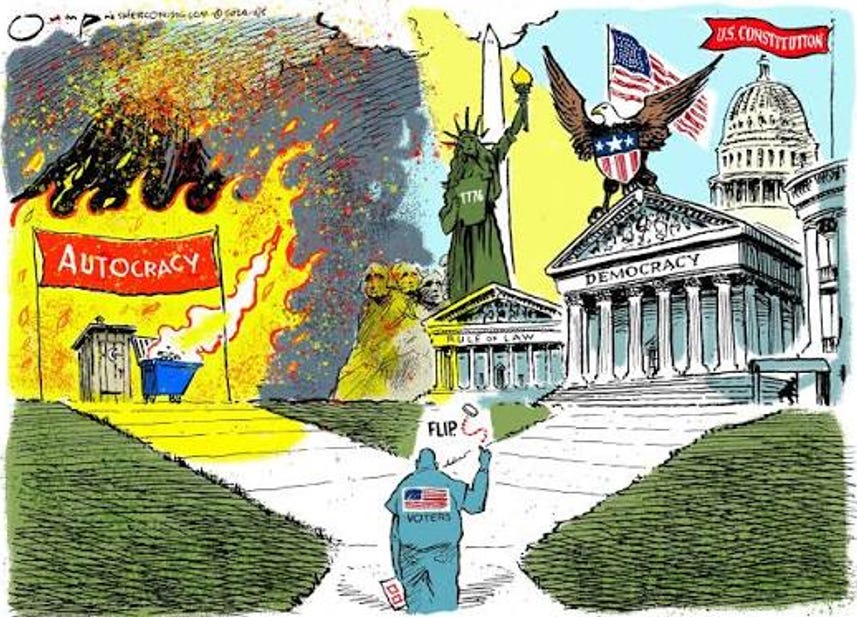
Democracy wins coin toss. Voters elect to kick out.
The markets will remain heavily about AI valuation handicapping with the likely data center setbacks hurting the bulls in AI ecosystem names. We get CPI and PPI this week, and inflation will still be a critical part of the asset allocation story with refined products much slower to find relief than oil futures as downstream working capital cycles take time.
Negative real wage growth remains a fact of life for now. Jobs had what was headlined as a big month, but payroll additions only placed on top of the post-2008 median with a heavy mix of “low multiplier effect” services jobs leading the way (see Employment Oct 2026: Payroll Seems Strong but is only Median 11-9-26).
The extremes of rhetoric are not new, but the Congressional vote tallies and seating arrangements will be dramatically rearranged in January. The legislative menu will be very different with affordability-related actions being the promised priorities on the agenda (Constitution > Retribution). Voters rejected a lot more than Iran despite MAGA attempts to spin it as a single-topic election defeat. The radical realignment of the center of the political spectrum (from left to right) should be a net positive for markets and should mitigate the effects of extreme left and extreme right rhetoric (see Midterm Election 2026: History Evolves 11-4-26).
A major wildcard is whether more GOP Senate and House members can find their courage after the MAGA beatdown and whether the Progressive wing will support measured activity led by the new center elements in the interest of some wins (health care relief, claw back tariff authority, curbing Trump’s Iran recklessness). Or will the most progressive elements and the DSA take their bat and ball and go home if they don’t get their way?
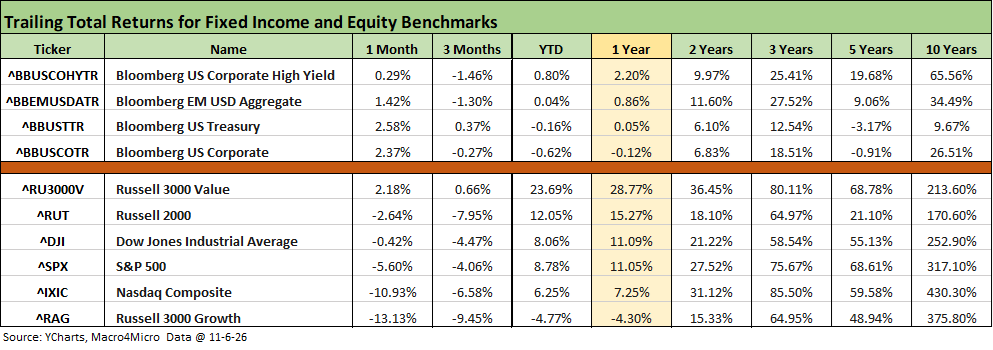
For all the talk about the end of the world in some quarters, the same main market crisis points to start this week after the election match up with how the prior week ended. That is, AI valuation questions need to be answered. Between then and now, we obviously had a tectonic election shift that was devastating to Trump and MAGA extremism. It made the post-Watergate setbacks of the 1970s look like happier times for the GOP.
The question now is how a reinvigorated center left and center right could inject some rational and balanced legislative action that will likely infuriate the crazy right and wacky left. Affordability and economics should rule with an eye toward 2028. Since Trump has a zero tolerance for any opinions other than his own, he will be fighting his GOP ranks who, for their part, do not need many to stand up for their own conviction or at least their own career plans. Blind adherence (submission?) to Trump just sent many to the unemployment line as of January.
The extreme scenarios are no longer about election fraud, ballot seizures, armed action in swing states, and old ladies getting beaten up at the polls by violence-prone, masked meatheads (Disclosure: my mother worked at the polls for years on the East Side of Brockton Mass in a racially diverse and immigrant heavy town). Such scenarios were hard to rule out in 2026 given the extremist tone.
The table above and the 1-month time horizon returns hammers home the bullish moves of the UST curve for bonds and the pain on anything in equities heavily tied to tech. The Russell 3000 Value benchmark escaped and put up positive numbers while the Dow was only slightly negative on Friday close at -0.42% for the month. The Dow closed at +1104 at +2.15% on the day. S&P 500 was +2.35% and NASDAQ +2.74% on the day.
For the UST shifts, the market has rewarded duration despite mid/upper 3% headline CPI and PCE inflation metrics with fresh CPI/PPI releases due this week. A solid-enough jobs number on Friday, stubborn inflation, and sustained healthy demand as evident in the 3Q26 GDP numbers make the UST action harder to put in context of what we had been seeing in prior months (see Market Commentary: The UST Curve 11-7-26).
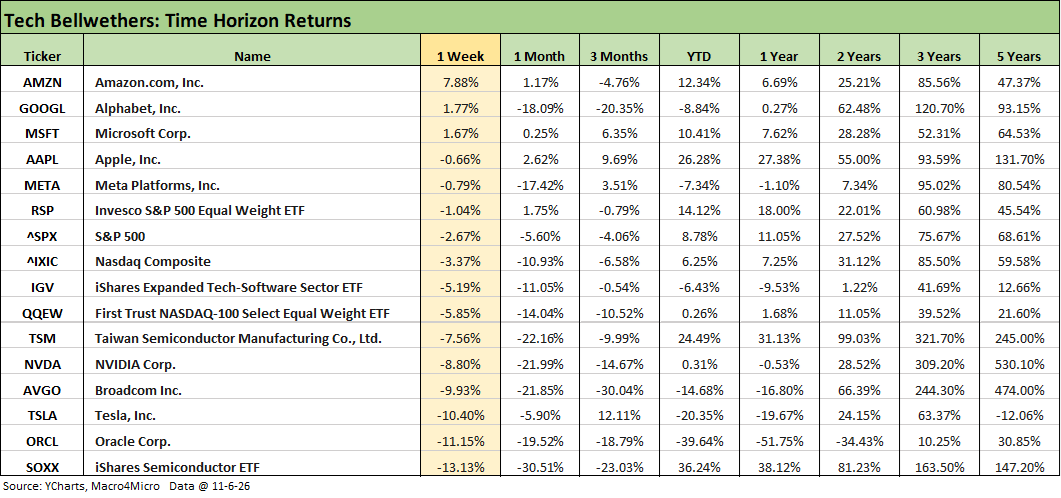
The tech bellwethers had another bad week, but at least we see 3 of the Mag 7 in positive range for the week with Amazon a notable rebound. Tech is still driving volatility with the VIX pushing up into the high 20s (28 intraday) this past week but down sharply today to below 20. We still saw another painful week ending 11-6-26 after the prior week’s sell-off (see Market Commentary: Asset Returns 11-1-26, Weekly Asset Returns: Tech Check 10-31-26).
The above table shows the Semiconductor ETF (SOXX) mired in last place at -13.1% or almost 8 points below the Software ETF (IGV) at -5.2%. Tesla and Oracle also posted negative double-digit return weeks. It is worth highlighting that SOXX is still +36.2% YTD and IGV is -6.4% YTD.
The tech weakness was evident in the differential between the S&P 500 at +8.78% YTD vs. +14.12% for the Equal Weight S&P 500 ETF (RSP). NASDAQ posted +6.25% YTD.
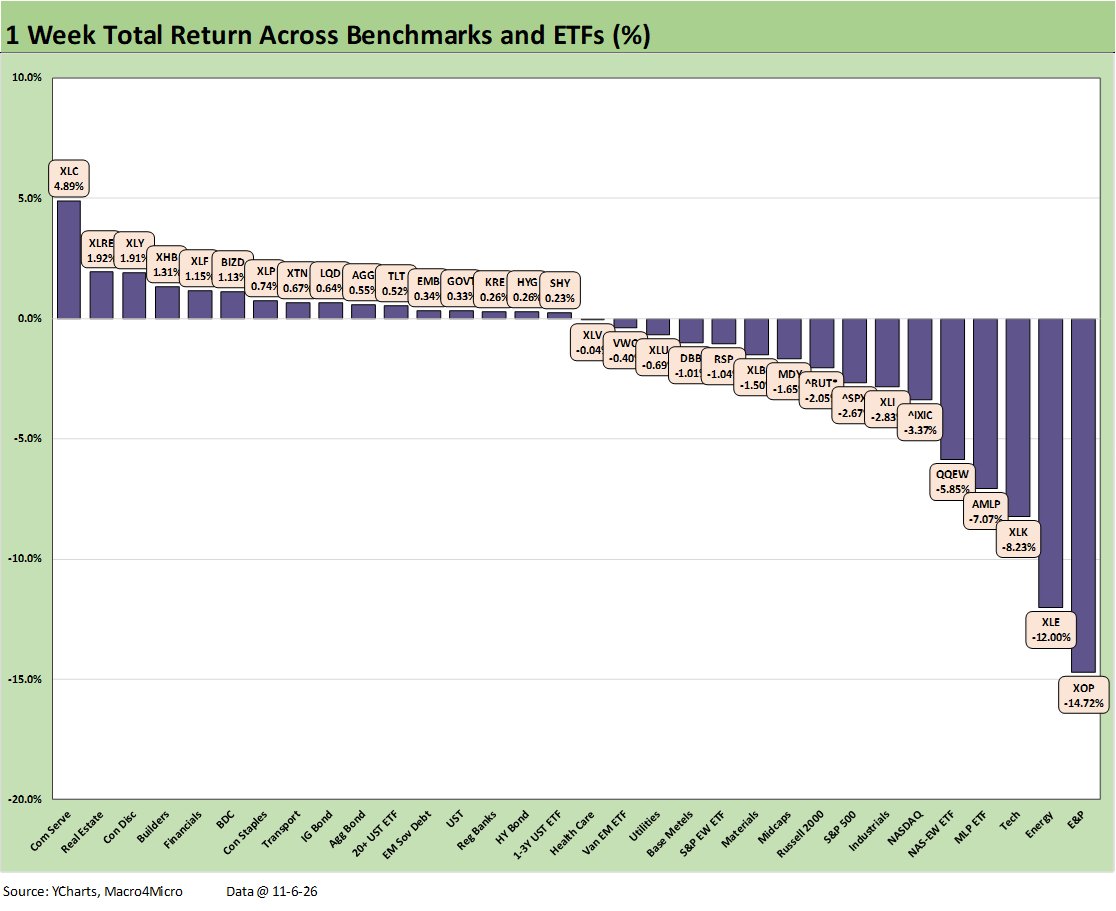
We already posted a commentary on the weekly returns for the broader mix of benchmarks and ETFs (see Weekly Returns: Benchmarks and ETFs 11-7-26).
With a 16-16 positive-negative score, that profile of returns seems quite mild and muted if taken in isolation. Wild swings and a VIX around 28 at an intraday high and 4-digit price moves made for an interesting week dominated by the shockingly one-sided election that is still playing out with 2 more Senate seats on the line. That will matter in filibusters and potential veto overrides (less GOP votes to recruit).
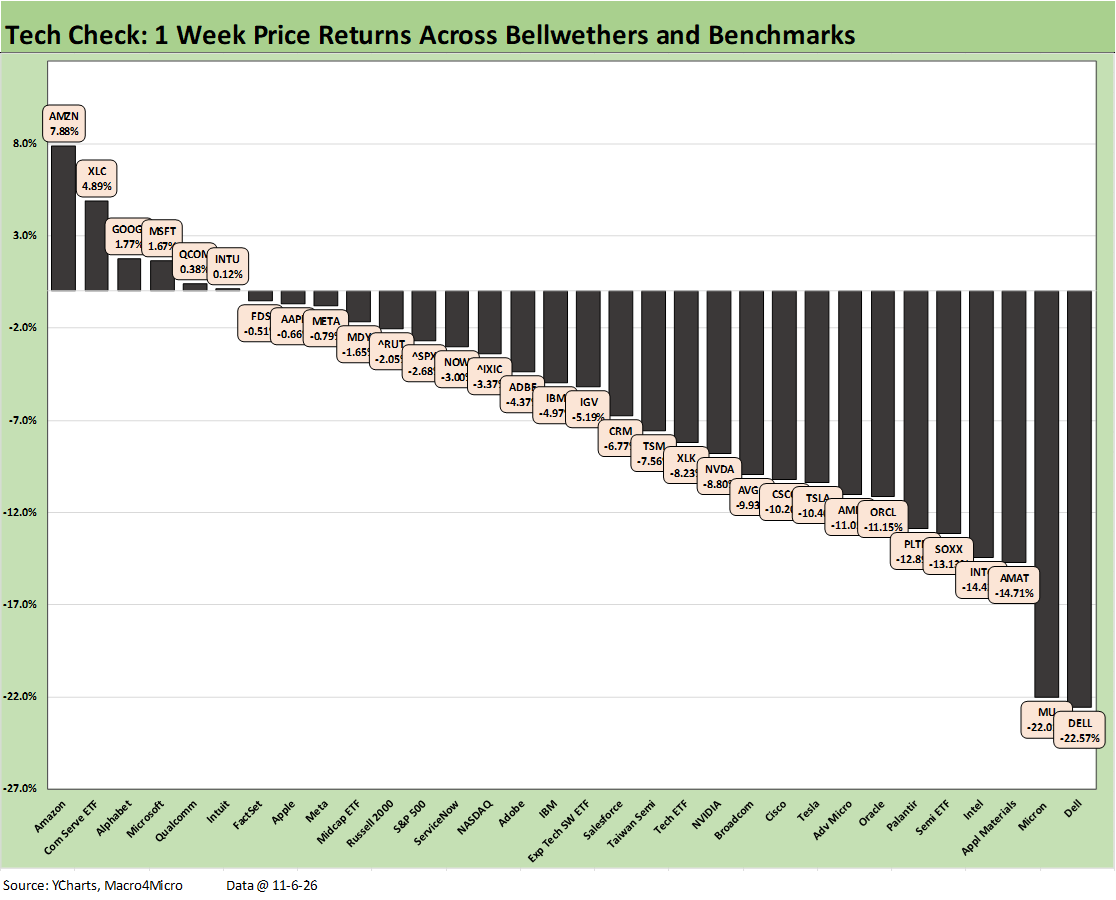
We already posted a commentary on the weekly Tech Check returns (see Weekly Asset Returns: Tech Check 11-7-26). The 6-26 score leaves little to the imagination. The same is true for the -22% weeks posted by Dell and Micron. The entire bottom quartile featured double-digit % declines.
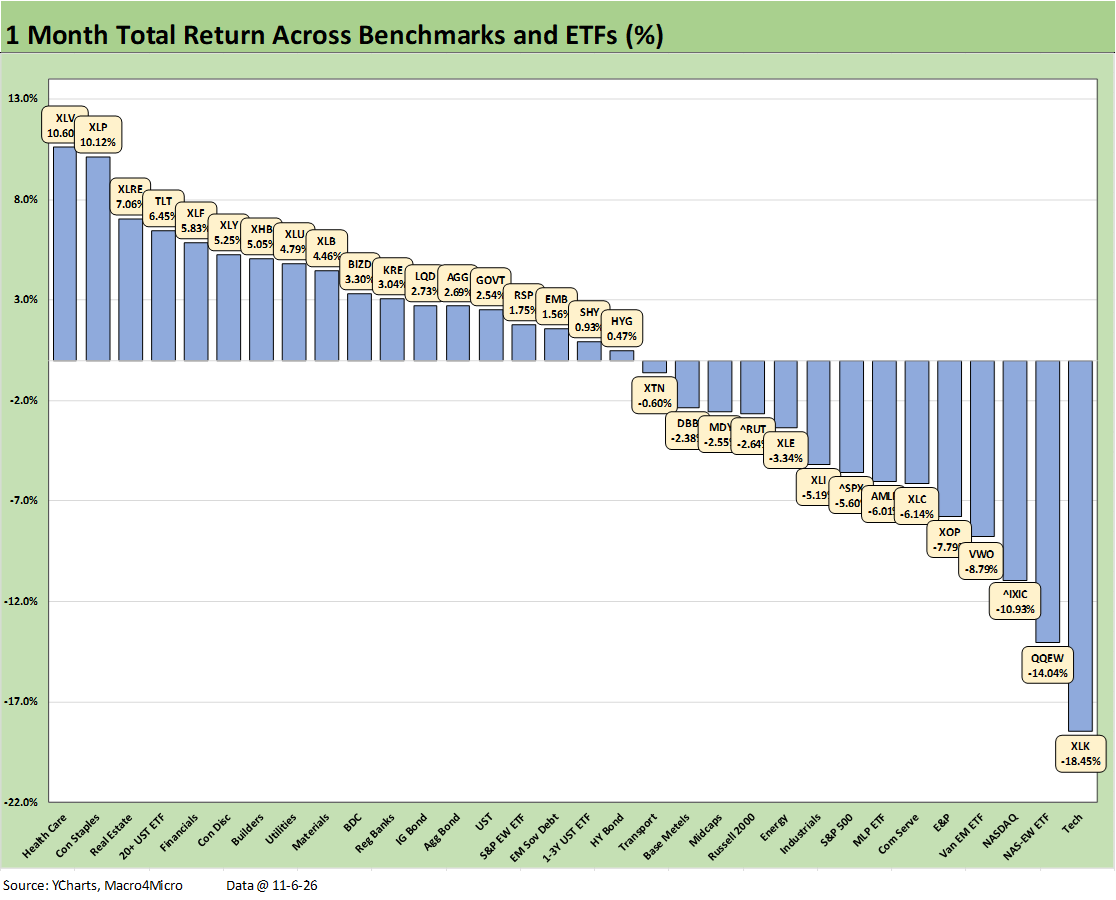
The broader mix of benchmarks and ETFs posted an 18-14 for the trailing month with a Hi-Lo range of 29 points. The bottom quartile was tech-heavy for 5 of the 8 with 2 energy ETFs (XOP, AMLP) and the EM ETF (VWO) rounding out the bottom quartile.
As we detail in the next chart, it is no surprise that tech was the overwhelming driver. Lower oil flowed into the last week of the period after a run higher in October from the low $90 area to $104 (WTI) as of last week ahead of this week’s plunge.
As we have seen along the way in the weekly updates, defensive stocks such as the Health Care ETF (XLV) and higher quality dividend stocks (e.g., XLP, XLRE, XLU) have outperformed.
The UST rally has also rewarded the long duration 20+Y UST ETF (TLT) and the Homebuilder ETF (XHB). Financials (XLF) also made the top quartile in a positive cyclical signal with the BDC ETF (BIZD) and Regional Banks (KRE) in the upper end of the 2nd quartile. All 7 bond ETFs we monitor posted positive returns.
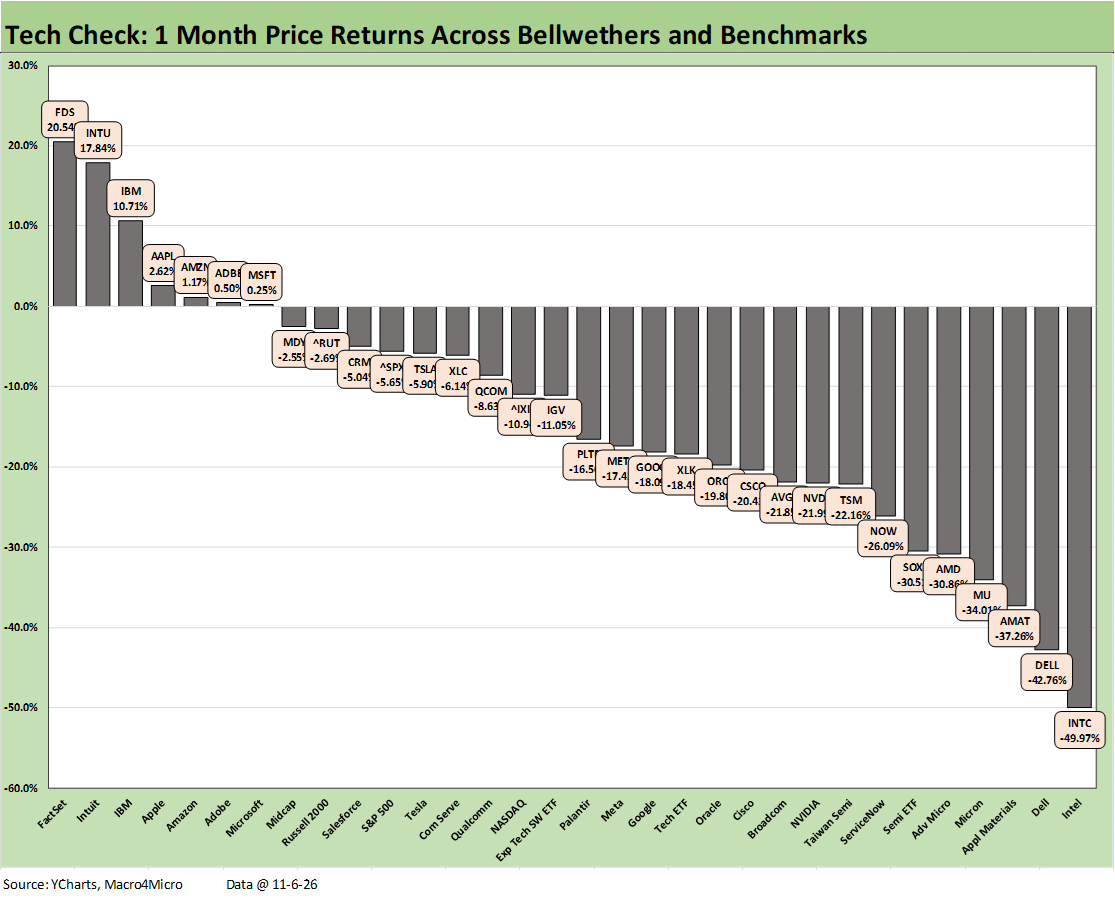
The Tech Check mix of benchmarks, ETFs, and single names was the epicenter of ugly at 7-25 with 3 Mag 7 names in positive range (AAPL, AMZN, MSFT). We see 3 of the 8 names in the top quartile (INTU, IBM, ADBE) still reside in the negative range YTD with FactSet (FDS) in the #1 position after returning to positive YTD range in recent weeks. The less tech-intensive Midcap ETF (MDY) rounded out the top quartile.
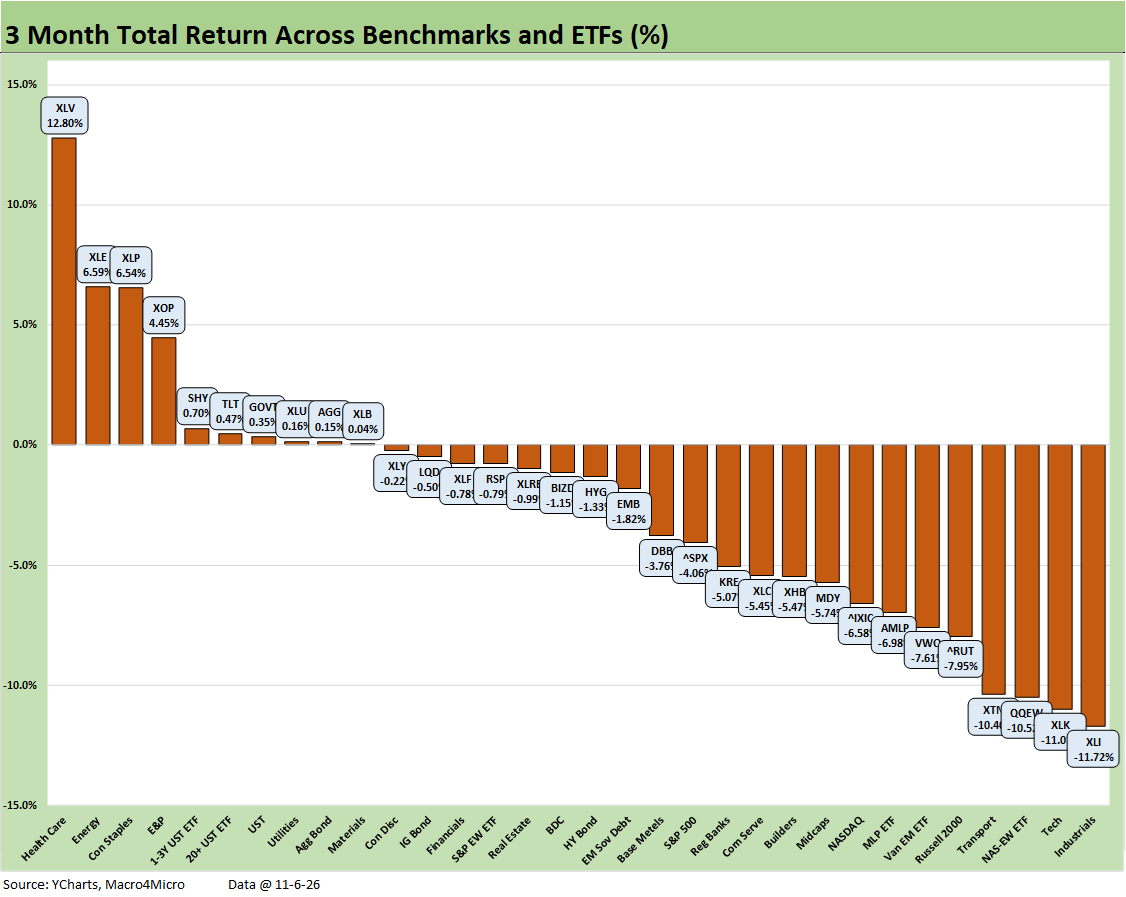
The 3-month broad asset mix signals the unfolding struggle at 10-22. We see 3 bond ETFs in the top quartile (SHY, TLT, GOVT) and a 4th bond ETF (AGG) in positive range at the top of the 2nd quartile vs. 3 in the red (LQD, HYG, EMB). Spread widening has been hitting credit-intensive bond ETFs.
In terms of bottom quartile equity ETFs, we see the more cyclical Industrials ETF (XLI) in last place joined by some of the tech-heavy ETFs such as Tech (XLK), the Equal Weight NASDAQ 100 (QQEW), and the NASDAQ. Midcaps (MDY) sat on the bottom of the 3rd quartile with the S&P 500 near the middle of the 3rd quartile.
The winners for the 3-months include defensive stocks mixed in with interest-rate-friendly equities (XLV, XLP, XLU). We also see ETFs with energy exposure (XLE, XOP) as higher oil prices supported upstream names before the recent weakness.
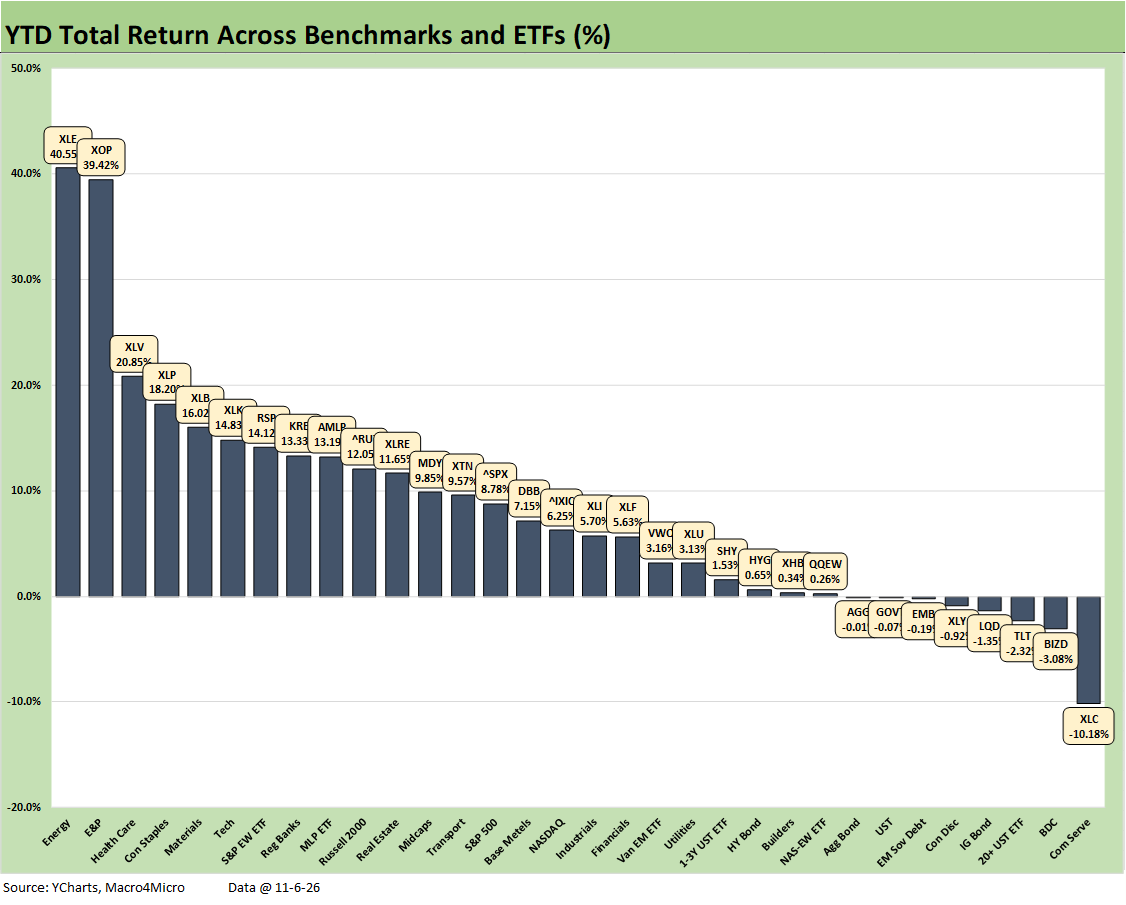
The YTD score for the broader mix of 32 benchmarks and ETFs posted a score of 24-8 with Iran pushing upstream (XLE, XOP) into the top spot by a healthy increment. The top 5 includes the bellwether defensive, quality dividend names (XLV, XLP) and Materials (XLB) on commodity strength (the upside of inflation for that sector).
The bottom quartile is heavy on duration losers YTD on the adverse moves in UST ahead of the recent rally. The earlier UST moves left 5 bond ETFs in the red YTD. Only the short duration 1-3Y UST ETF (SHY) and HY (HYG) were positive YTD.
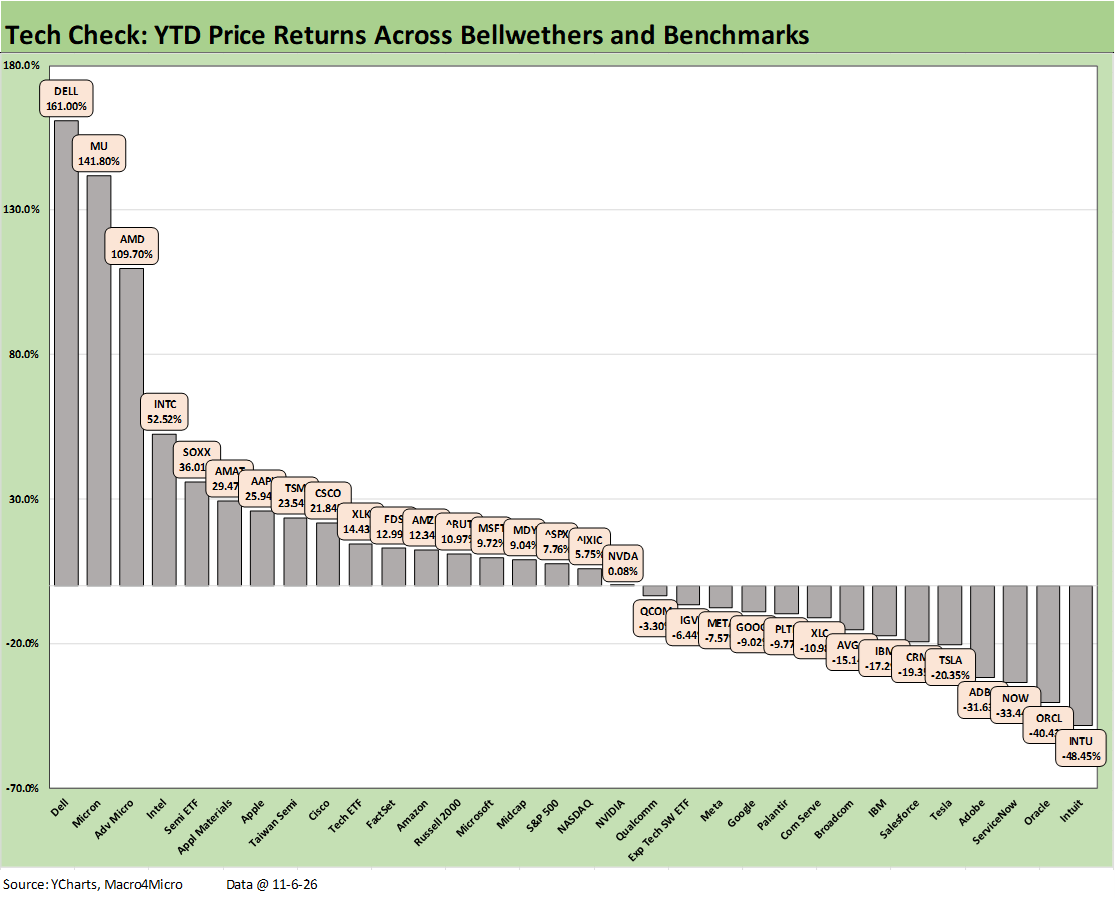
For the YTD returns on the Tech Check mix, the story is about how big the head start was before the recent weakness. We see a score of 18-14, so the givebacks make for some interesting decision points ahead of year end reporting.
The two large cap benchmarks show the S&P 500 and NASDAQ straddling the median area return of just below 7%. It still takes 23.5% (Taiwan Semi) to make the top quartile and -15.1% (Broadcom) to make the bottom quartile. The Hi-Lo range of 209 total return points from top (Dell) to bottom (Intuit) is not something you see across the decades.
Throw out the Hi and Lo, and the differential is still around182 points for Micron (+141.8%) vs. Oracle (-40.5%).
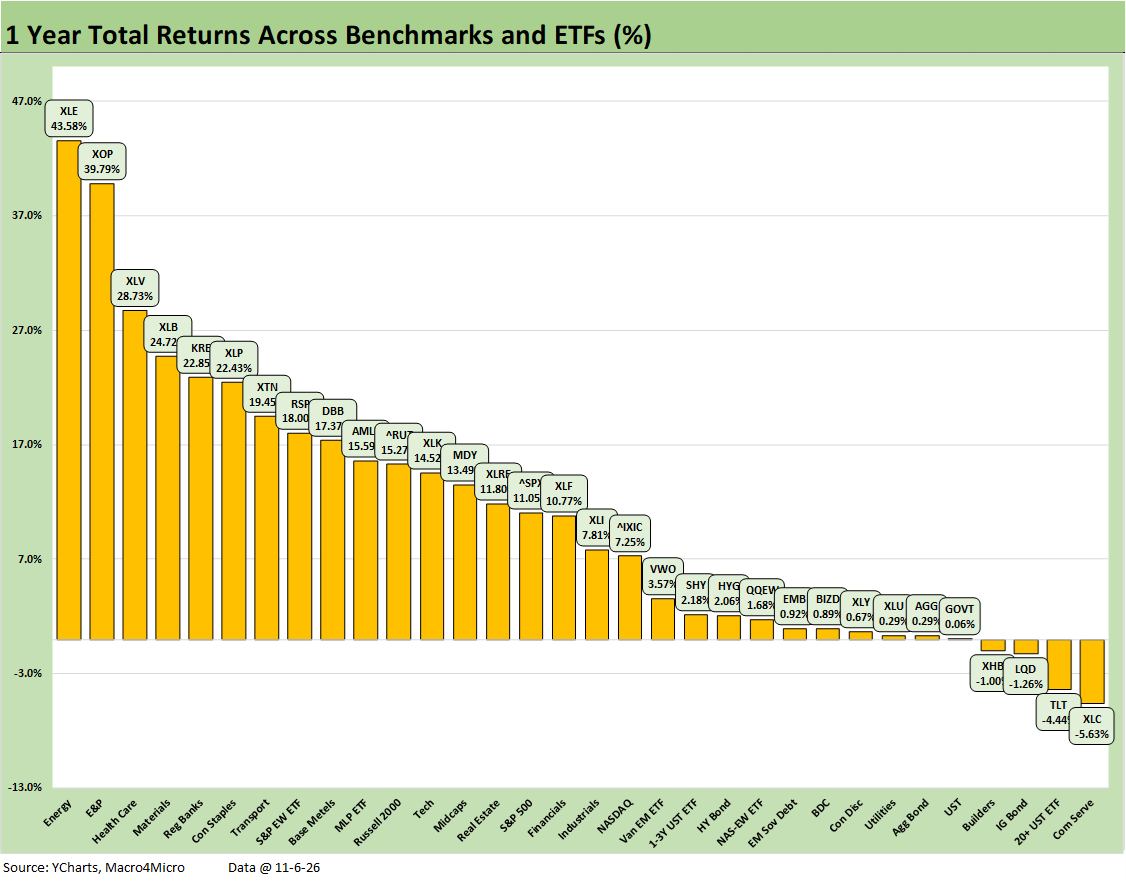
The LTM score improved sequentially from last week at 28-4 with Communications Services (XLC) on the bottom in negative range joined by the Long Duration 20+Y UST ETF (TLT), the IG Corporate Bond ETF (LQD) and Homebuilders (XHB).