

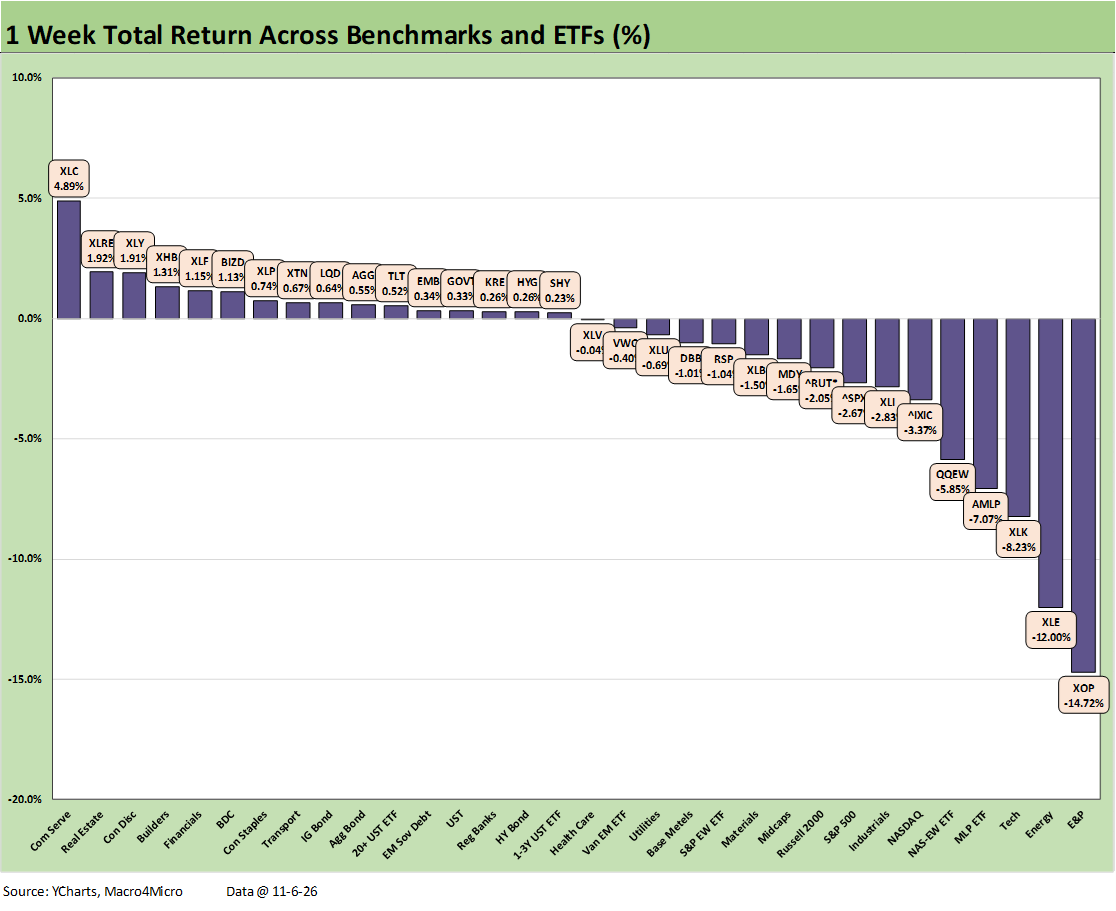
The wild week in politics directly translated into higher volatility in markets (VIX intraday high above 28 on 11-5-26) and uncertainty in policy. Texas data center risks have pole position and opponents have traction in the MAGA-heavy rural sector. The potential impacts on an AI trade just got worse after already seeing a battering the prior week even if the YTD returns remain impressive after the Trump/GOP carnage (see Midterm Election 2026: History Evolves 11-4-26, Market Commentary: Asset Returns 11-1-26).
Over the years, the ebb and flow of the political tides come and go. That goes back to the post-Watergate Democrat domination (1974 to 1979) and the Reagan-Bush (GHW) bull markets (1982 to early 1989). After the 1990 recession, the political balance rolled into the popular Clinton years (1993 to early 2000) that included a divided Congress (the 1994 “Republican Revolution”).
The Reagan-to-Clinton led economies crushed anything that Biden or Trump could boast in their GDP growth record. That is despite Trump’s claim of the “greatest economy ever” (see Presidential GDP Dance Off: Reagan vs. Trump 7-27-24, Presidential GDP Dance Off: Clinton vs. Trump 7-27-24).
The new millennium was all about “W” Bush before it was all about Obama and then Trump. We will see what comes next in 2028, but the Democrats were just handed a mandate to tackle household affordability (tariffs, health care, and Iran/oil).
Winners and losers are detailed in the chart, which shows a 16-16 tie. 7 of 11 S&P 500 sectors were positive but Tech and Energy were slammed. That certainly does not constitute a stock market crash. Not even close. (I was sitting in front of my Quotron at Lehman on Oct 19, 1987…aka Black Monday). Bubble comparisons such as 1999 are tricky since the companies anchoring AI valuations today are asset and cash flow rich. AI valuations can tank, but the major players will not evaporate as in 2000-2002.
We see all 7 bond ETFs in positive return range. The UST shifted lower with a modest bull flattener from 2Y to 10Y. The biggest losers were tech and energy-related ETFs in the bottom 6 slots, including E&P (XOP) and Energy (XLE) in 2nd to last with both in negative double digits. Cynics might say Iran escalation is subject to “insider” trading positions that can be put on in Washington after this oil selloff. That is a tad paranoid. Or is it?
We see Communications Services (XLC) at #1 as modest weakness in Meta (META) and Alphabet (GOOGL) followed the bloodbath of the prior week (see Weekly Asset Returns: Tech Check 10-31-26). Below META and GOOGL concentrations in XLC, we see more positive returns in telecom and media names (DIS, CMCSA, VZ, TMUS, etc.). We look at more of the tech single names in a separate Tech Check commentary.