

“The Election Clause is simple! Only a moron could F this up?” (Madison)
The ongoing reassessment of AI anxiety and potential revisions to assumptions will keep the sentiment thermometers in hand as the timing and ambition of the Anthropic IPO and OpenAI fund raising potential remain hot topics. The sheer scale of the bellwether sell-offs last week obscures the fact that the single name tech weakness was muted even if heavily in negative return range.
The pyrotechnics that came with last week’s AI noise could continue with various bellwethers in the tech space reporting including Apple, Advanced Micro, Qualcomm, and Palantir among others. The AI capex fixation (“Is it is too high? But just don’t cut it or I’ll worry even more) overlaps with the bullish multiplier effects for the broader economy.
The fact the UST curve keeps declining despite of higher inflation such as PCE this past week and oil (WTI) hitting $104 by Friday after being at a $91 handle in early October feeds a debate on how that UST downshift might unfold and what the FOMC does next. Old school flight to quality? Sector rotations? Hints of bearishness on AI potential? Worries of multiplier effects on broader growth?
Governor seats, state legislatures, and even a few major Mayoral elections will increase focus on critical topics such as data centers along with the more immediate focus of current local leaders fearing election interference. Election fears will be realized or not this week and reactions will follow.
A lurking question is whether Trump will just go the route of “sticks and stones” calling everything “rigged” in just another whine-a-thon or instead go full-on fascist with voting machine and ballot seizures? The market will care about the latter. If Democrats take the House, then budget “retribution risk” handicapping picks up for the new crop in Congress not due in seats until January. The Senate is a toss-up and that controls appointments.
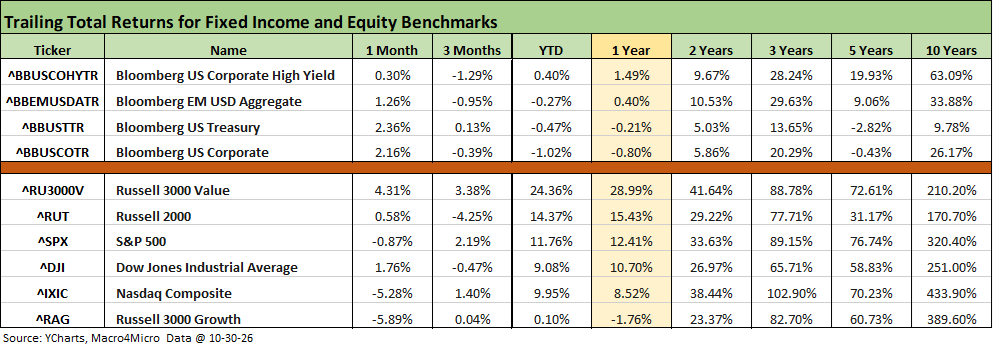
For the current measurement period, the fixed income returns posted an all-positive 1-month time horizon after a lot of negatives on the adverse curve moves in the aftermath of the Iran bombing (started Feb 28). For 3 months, we still see 3 of 4 negative but the downward migration of this month has also sent the 7 bond ETFs we track (chart further below) into positive range.
Equity returns by benchmark have been split with growth and tech taking a beating but the Russell 3000 value and Russell 2000 in positive range along with the less useful Dow with its narrow group. The S&P 500 broad market benchmark was modestly negative since it has a high-tech concentration with Information Tech and Communications Services combining for over 45%. That is just from 2 of 11 S&P 500 sectors.
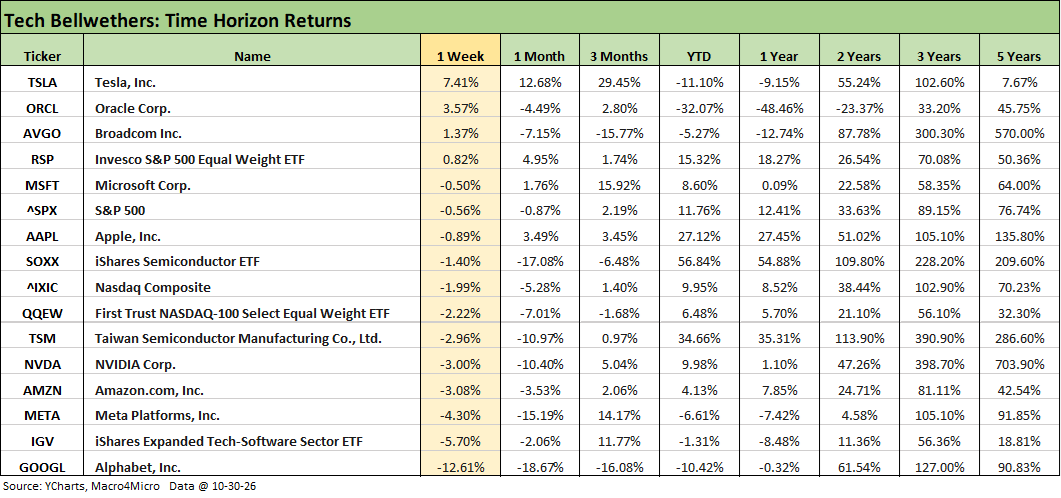
The tech bellwethers clearly had a very bad week with 6 of the Mag 7 in the red as Tesla (TSLA) took the #1 slot for the week. Among single names, only Oracle (ORCL) and Broadcom (AVGO) made it into positive range. Alphabet was a distant last place after its disappointing earnings mix and guidance around its “search” revenue and the potential threat of AI cannibalization. We covered the week in tech in our Tech Check commentary (see Weekly Asset Returns: Teck Check 10-31-26).
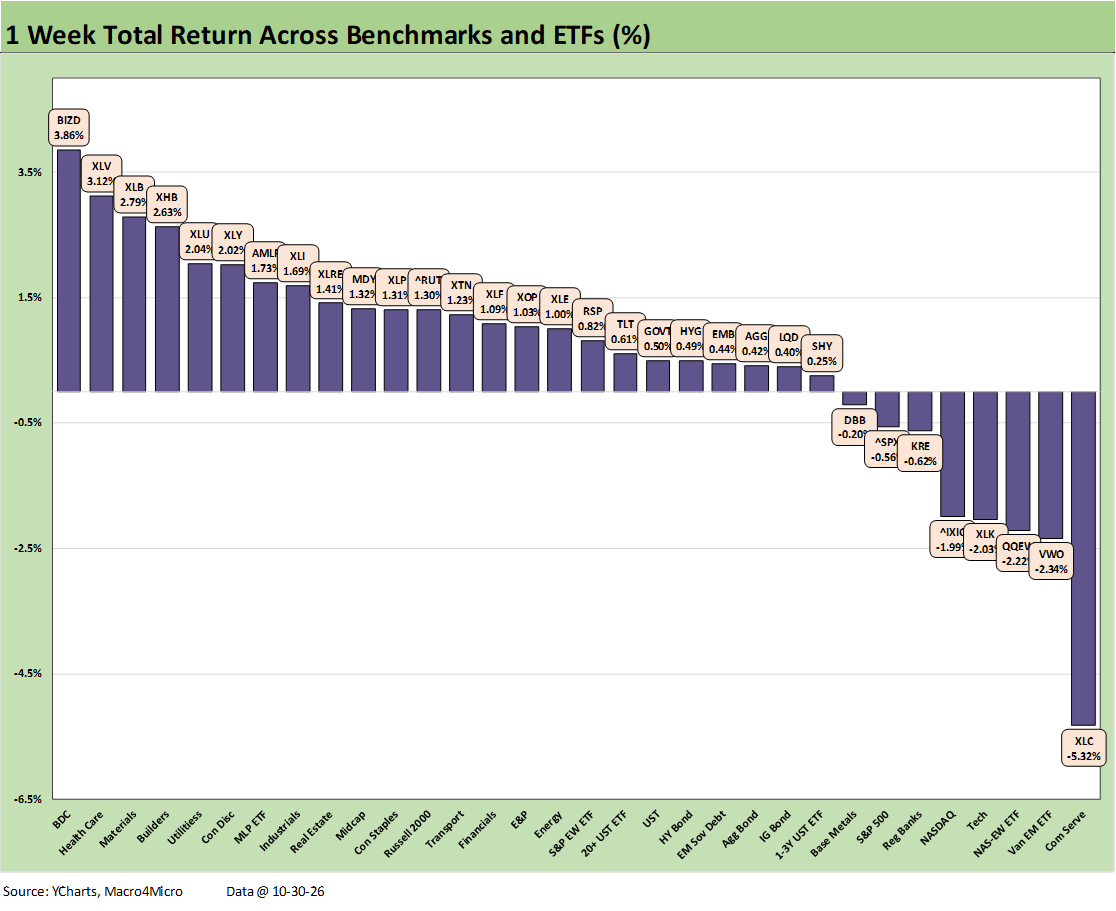
We already posted a commentary on the weekly asset returns for the broader group of 32 asset lines (see Weekly Returns: Benchmarks and ETFs 10-31-26).
The score of 24-8 was notable and in sharp contrast with the 8-24 score for the Tech Check list of benchmarks, ETFs, and single names.
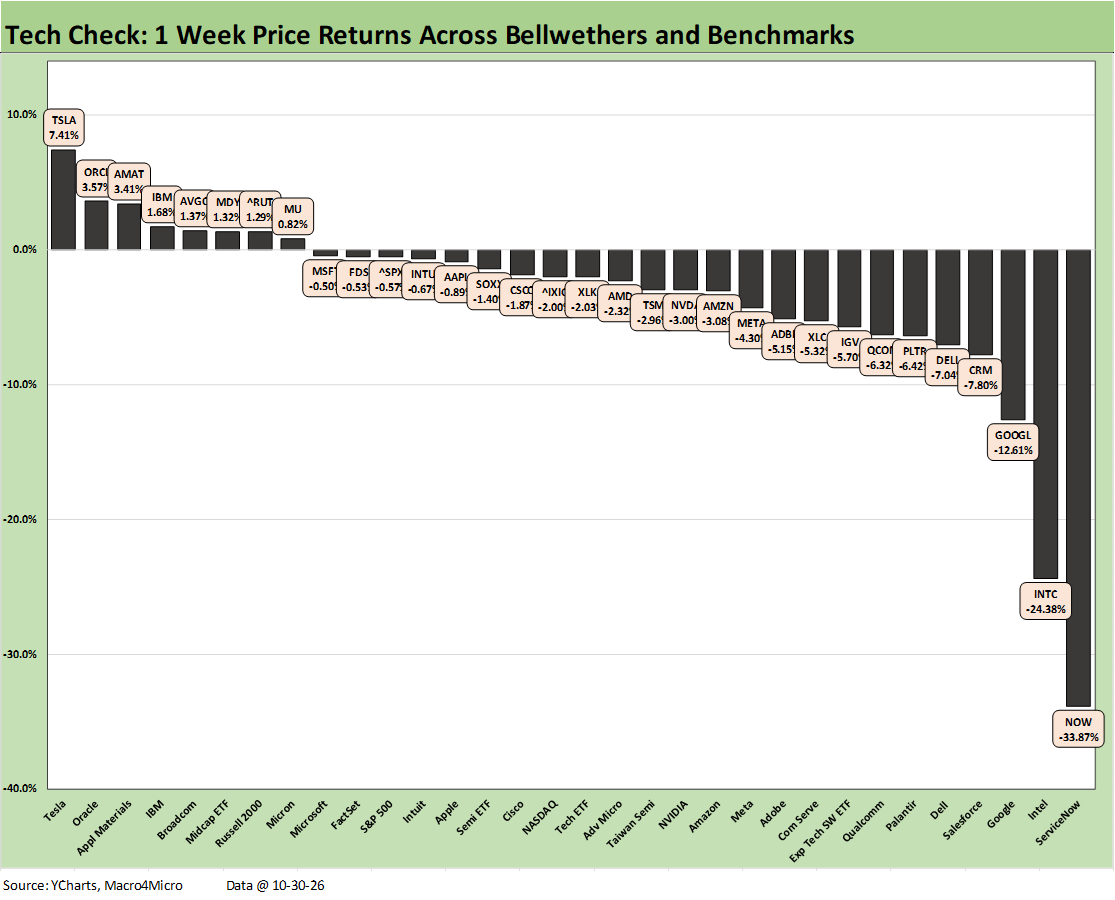
We already posted commentary a commentary on the Tech Check list (see Weekly Asset Returns: Teck Check 10-31-26).
While it was clearly a brutal week for tech and some bellwethers headliners, only 3 names were down double digits. The noise was louder since 2 of the 3 (Alphabet and Intel) are such major names including a legacy Mag 7 name in Alphabet while Intel is one of the semiconductor leaders. INTC was the comeback story of the cycle with a major government stake taken along the way.
The median negative return of the 32 was only around -2.0% with only 7 names worse than a -5% handle. This signals considerable worry but not a crisis – yet. The AI story still has a lot to play out ahead with IPOs and where capex heads from here.
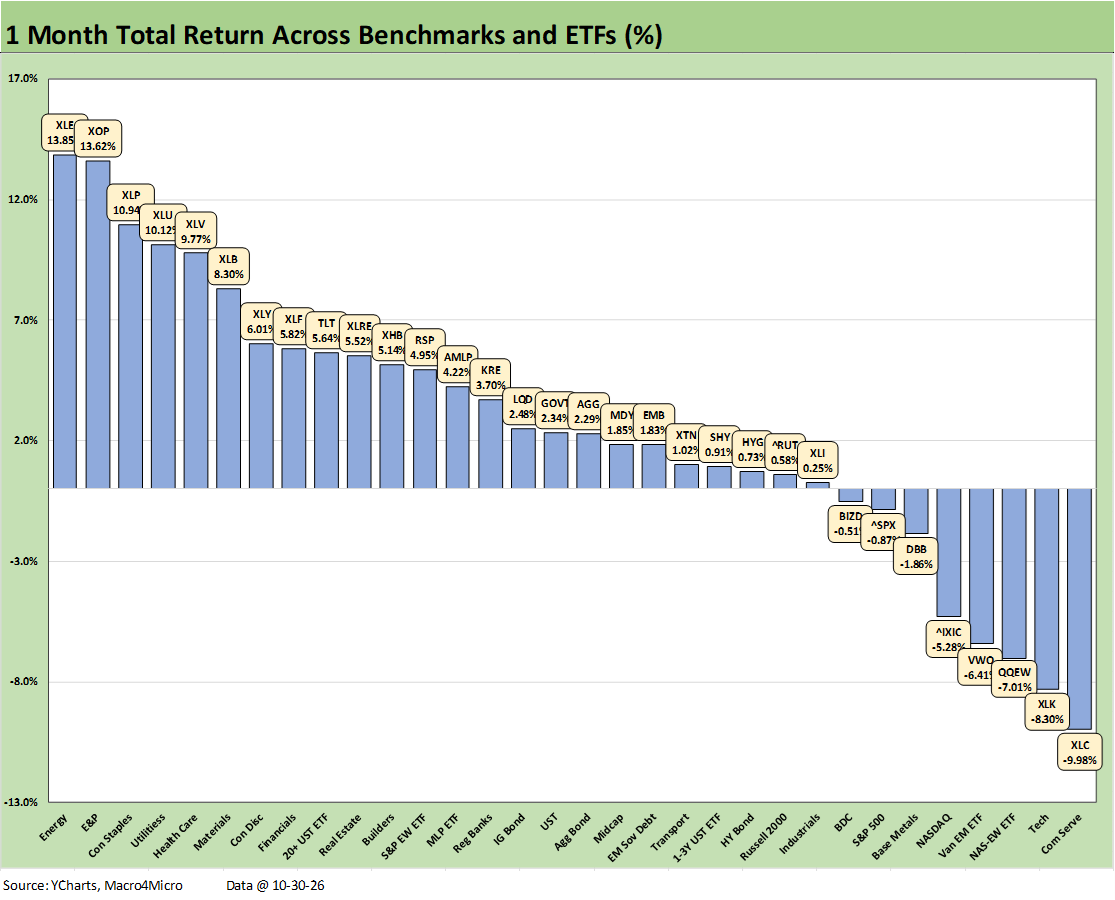
The 1-month score for the broader mix of 32 asset lines looked a lot like this past week with a 24-8 score and heavy weighting of tech in the bottom quartile. The large cap benchmarks (S&P 500 and NASDAQ) are sitting in the bottom quartile based on tech exposure. The NASDAQ is in the red along with the Equal Weight NASDAQ 100 ETF (QQEW). Communications Services (XLC) is in dead last with the Tech ETF (XLK) just ahead of it in 2nd to last.
The winners for the month included energy names at #1 with Energy (XLE) and E&P (XOP) as oil (WTI) climbed $13 in the month to around $104 after sitting at a $91 handle on the first Friday of Oct and moving as low as $88 early in Oct (10-7-26).
Meanwhile, downstream refined products such as diesel and home heating oil are wreaking havoc from New England (home heating oil) to everywhere with diesel a lifeblood factor in freight and logistics and delivery costs and critical in the traditional rural stronghold of MAGA.
The AI equity market volatility has been a big part of driving UST rates lower despite adverse trends in inflation with CPI at 3.7% and PCE at 3.6%. Those numbers are well ahead of average hourly wage growth of 3.1%. For many the high 3% inflation metrics are lower than the actual household basket where energy can loom larger than the inflation index weighting and be subject to seasonal spikes (note: home heating oil and power costs in winter, varied commuter demand for gasoline, etc.). The heavy-duty pickup crowd can face diesel cost pain both for work and personal use.
Other leaders in the month include defensive equities and quality dividend stocks as lower UST rates offered support for those equity subsectors. We see Consumer Staples (XLP), Utilities (XLU), and Health Care (XLV) in the top tier. Consumer Discretionary (XLY) was rebounding this month after dragging on a YTD basis.
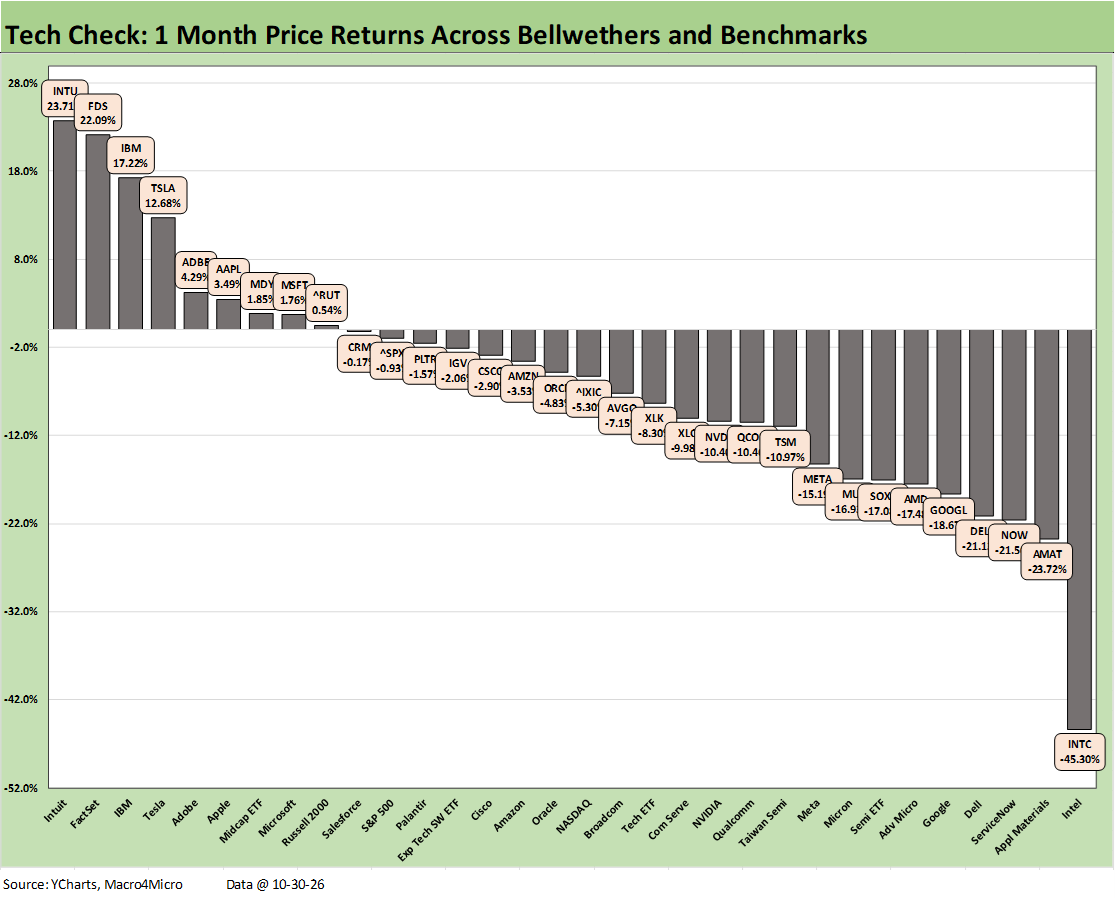
October was “hell month” for tech with AI rattled and semiconductors paying back some of the exceptional returns from the year. As we cover in the YTD charts further below, the AI ecosystem and semiconductor names show a leaderboard with the top quartile posting returns at a significant multiple of the long-term return on equities.
The bottom quartile of the Tech Check list is heavily driven by AI and 5 of those 8 directly tied to semis. The weakest outliers have dominated the headlines as covered in the weekly recap, but the -45% handle on Intel (INTC) was treated as a shock even though PC weakness was already in the news. A common view was that INTC fell short of transparency on earlier guidance.
Dell is a massive supplier of AI infrastructure and serves data center needs. Dell still leads the YTD return chart at +237%. Google was also a blaring headline this past week on worries around its core search business as well as its massive capex demands.
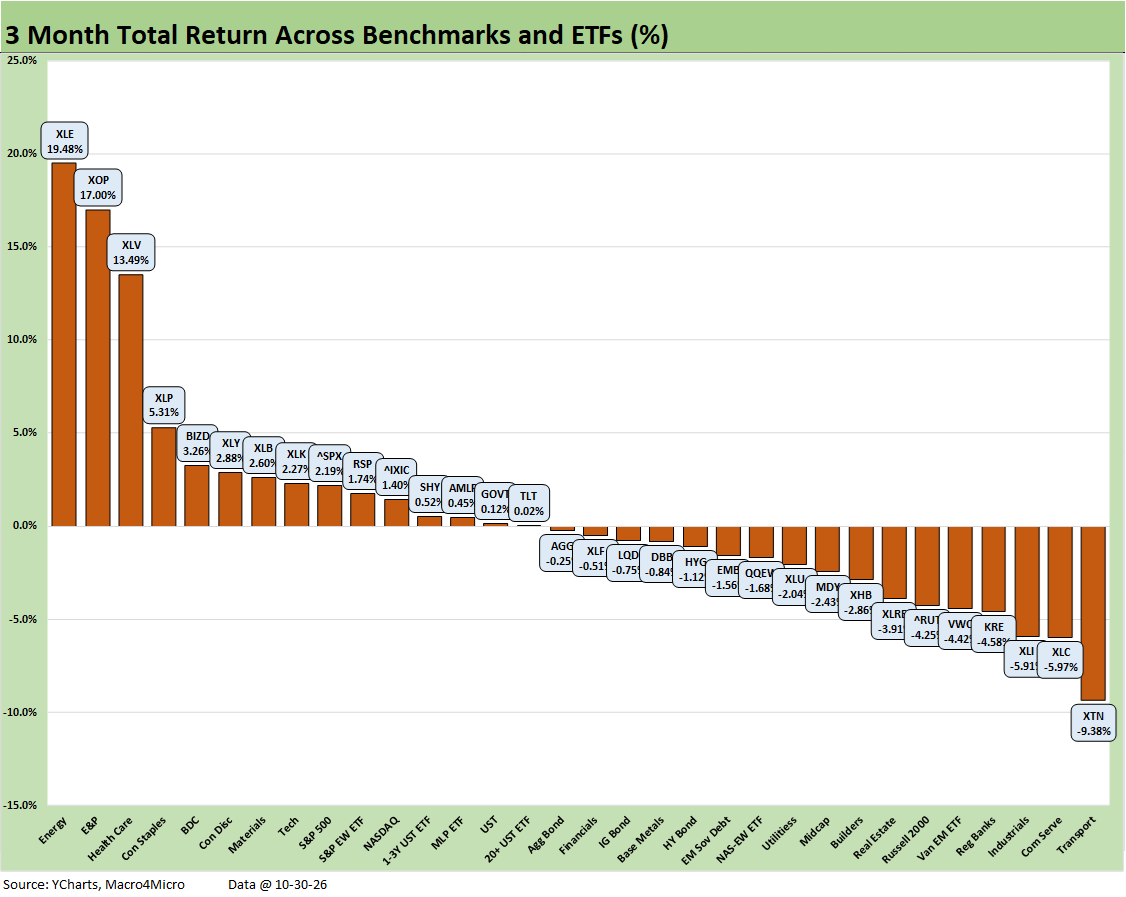
The 3-month timeline for the broader mix is relatively even at 15-17 with a mixed performance by the 7 bond ETFs at 3 positive and 4 negative as the recent rally allowed the UST ETF (GOVT) and long duration UST 20+Y ETF (TLT) to edge above the 0% line. IG Corporates (LQD) and HY (HYG) felt the pressure of spreads widening even if spreads are still compressed in historical context.
The big winner remains energy with the broader Energy ETF (XLE) at #1 and the E&P ETF (XOP) at #2. Oil prices are driving upstream profits and the spikes in refined downstream products have reached highs that are hammering the consumer and driving a range of CPI and PCE inflation metrics higher even outside of energy products and services.
The top quartile sees the defensive Health Care ETF (XLV) and quality dividend stocks such as the Consumer Staples ETF (XLP) in the top 5 along with a comeback continuing in BDCs (BIZD), which are still in the red YTD and for the trailing year.
Materials (XLB) made the top tier on materials cost pressure that are hitting businesses and consumers. That cuts across companies operating in steel, copper, gold, and along the petrochemicals chain. The capex boom brings rewards to the suppliers.
Despite the recent setbacks in the tech sector, the Tech ETF (XLK) still did enough over 3 months to make the bottom of the top quartile.
The Consumer Discretionary ETF (XLY) made the top tier. XLY has had its ups and downs across 2026 and remains in negative return range YTD in the bottom quartile. The recent rebounds in the consumer sector as detailed in the monthly PCE reports and the PCE growth lines of GDP are drawing attention.
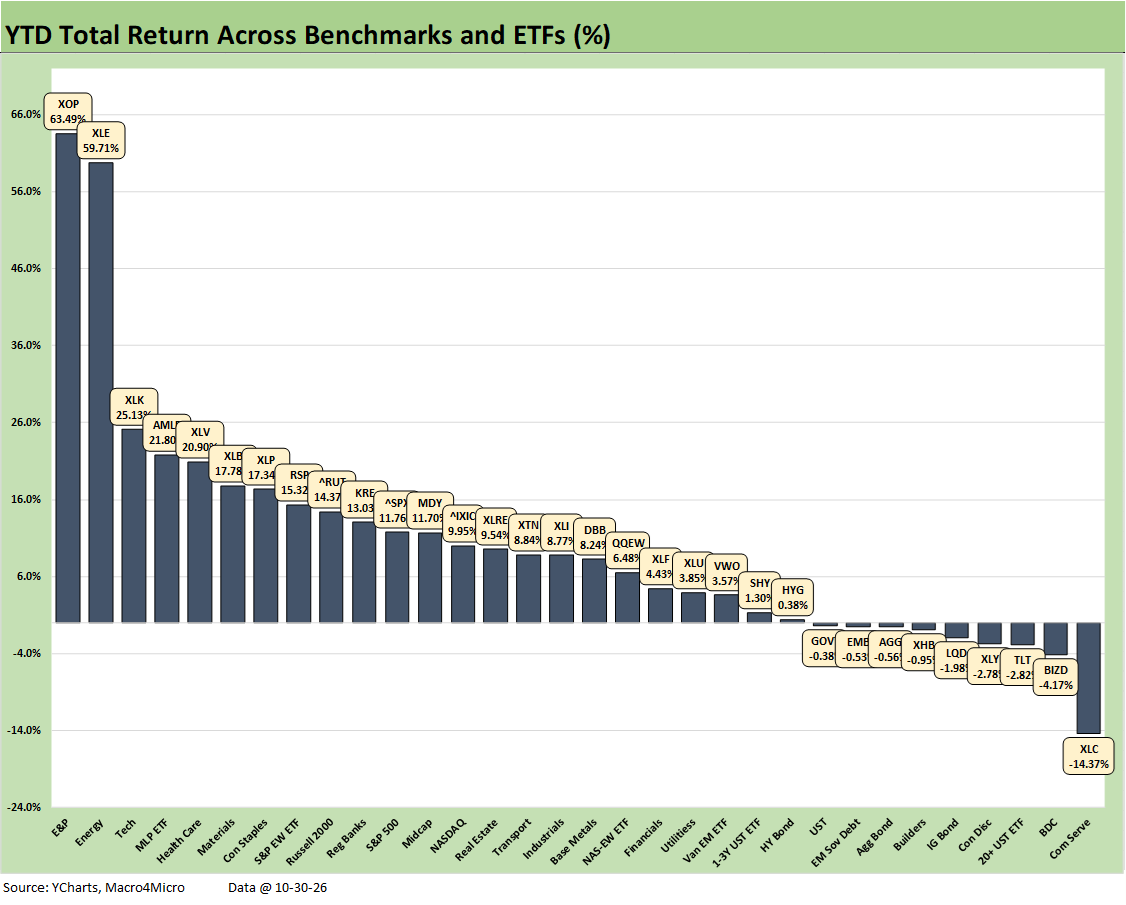
The broader mix of assets posted a YTD score of 23-9 with 5 of 7 bond ETFs in negative range and 4 of them in the bottom quartile. Only HY (HYG) and the short duration UST 1-3Y (SHY) posted positive returns on less duration exposure. That said, HYG has seen spread widening from the +280 bps area to start the year into the mid 300 bps range during October. There will be questions around new issue bond supply and credit ratings risk for the broader tech sector – including Anthropic’s potential bond ratings, which became a headline debate this week.
One fear is that a BB tier Anthropic might send middle tier (BB and BBB tier) investors back to the memories of the bad old days of auto downgrades in 2005. That was a time when the “supply flood” topic tended to overshadow the reality that BB tier names present minimal default risk in a tier of the market that is very deep and starts to blend with the BBB tier investor base.
That BB tier risk does not mean the adjustment period will not bring volatility and intrinsic pricing penalties in the form of quality spread widening. Many issuers stay in the BB tier for a long time, some recover and get upgraded, and some head south (as the autos did into 2008-2009).
In terms of the YTD winners in the chart above, the energy ETFs take 3 of the top 4 with E&P (XOP), diversified Energy (XLE) and Midstream (AMLP). The Tech ETF (XLK) still ranks #3 even as it enters a period of uncertainty and challenges to risk pricing from equities to debt.
The benchmarks from large caps to small caps did not make the top quartile and were in the 2nd quartile with the Russell 2000 ahead of the S&P 500, Midcaps (MDY) and NASDAQ. That said, the Equal Weight S&P 500 (RSP) took the last slot in the top tier.
For the bottom tier, we see half the group comprised of bond ETFs and were joined by Communications Services (XLC) in last place along with BDCs (BIZD), Consumer Discretionary (XLY), and Homebuilders (XHB).
Into the Weeds in Consumer Discretionary (XLY)
Consumer Discretionary (XLY) is in the bottom quartile in the red and is worth a few more comments. We looked again at the top 25 holdings of XLY, and it always offers a reminder that the label “consumer sector” does not lend itself to easy generalization. We can look at the quarterly PCE growth numbers in quarterly GDP stats and the same for PCE releases each month, but much of the economy is under the headline numbers.
Personal Consumption Expenditures (PCE) comprise almost 68% of GDP and that is a lot of subsectors across retailers, consumer products companies, food and food/drink retail, travel and leisure, and consumer durables such as autos (with auto retailers from vehicles to aftermarket parts to maintenance services).
XLY shows concentration risk in Tesla, and that has not helped. Now Amazon has come under modest pressure this past week. The travel-related holdings have done very well in 2026 while auto related names have been mixed. Retailers have generally been under pressure with some notable exceptions (e.g. Ross Stores). While a name such as Starbucks has been a big winner, McDonald’s has been hit hard.
There are too many stories to highlight here, but names such as Booking Holdings, Lowe’s, and Nike are on the ugly side. Winners such as Hilton, Marriott, and Royal Caribbean offer a reminder of the tiered consumer financial profiles.
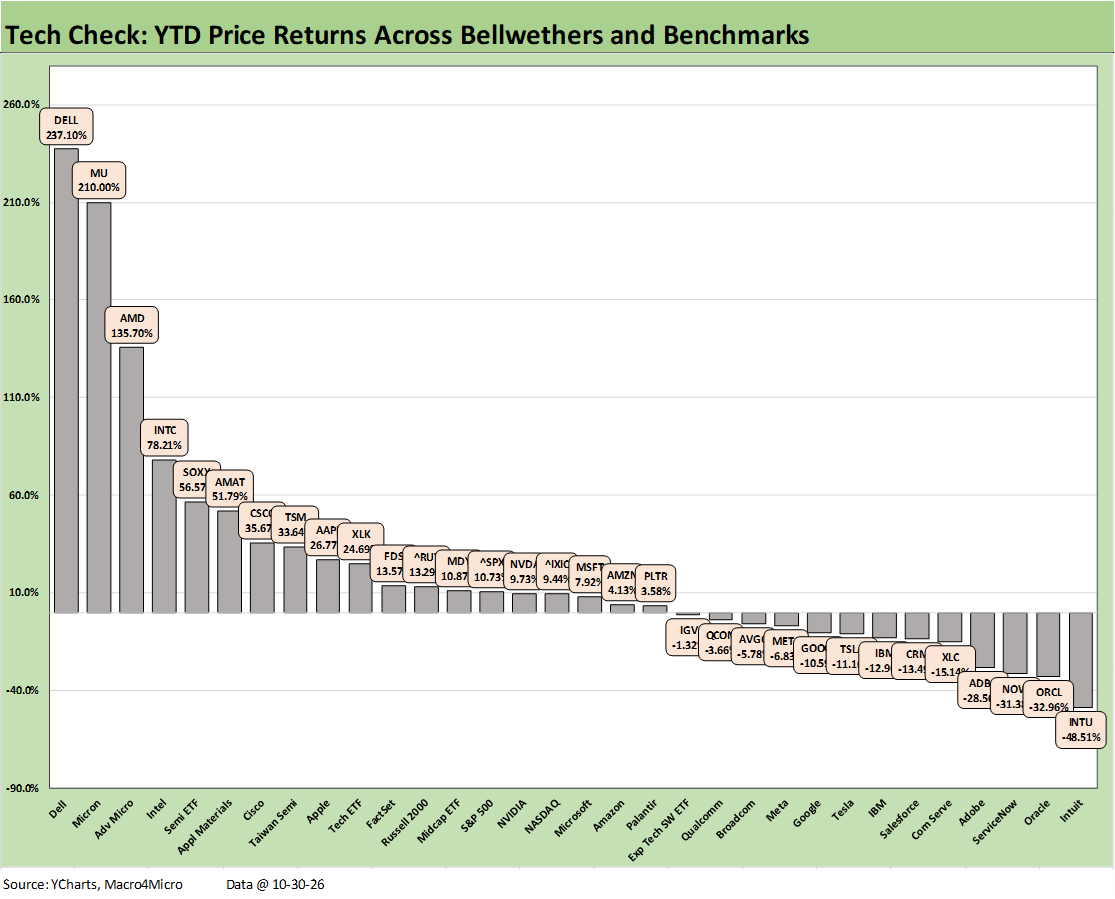
The YTD results for the Tech Check mix still reflect the massive winnings from the AI and capex boom and the benefits to semiconductors and data center suppliers broadly. The score of 19-13 was favorable. We see a heavy mix of software and SaaS firms in negative return range, which continues the trend from periods we have covered along the way.
No Mag 7 single name made the top quartile with 2 in the 2nd quartile (AAPL, NVDA), 4 in the 3rd quartile (GOOGL, META, AMZN, MSFT), and 1 in the bottom quartile (TSLA). It is worth highlighting that NVDA is near the bottom of the 2nd quartile despite being the name many would associate with the AI kickstart.
As mentioned in the bullets and intro at the top, those AI ecosystem names face some election risk at the state and local level this coming week on data centers with bipartisan pushback from the suburban to exurban to rural. There will be some “morning after” sorting to do on where any repricing risk might surface on projects and capex.
The YTD numbers show that even after a bad week with blaring headlines, it took a 56.6% (SOXX, the Semi ETF) return to make the top 5 and 33.6% (Taiwan Semi) to make the top quartile.
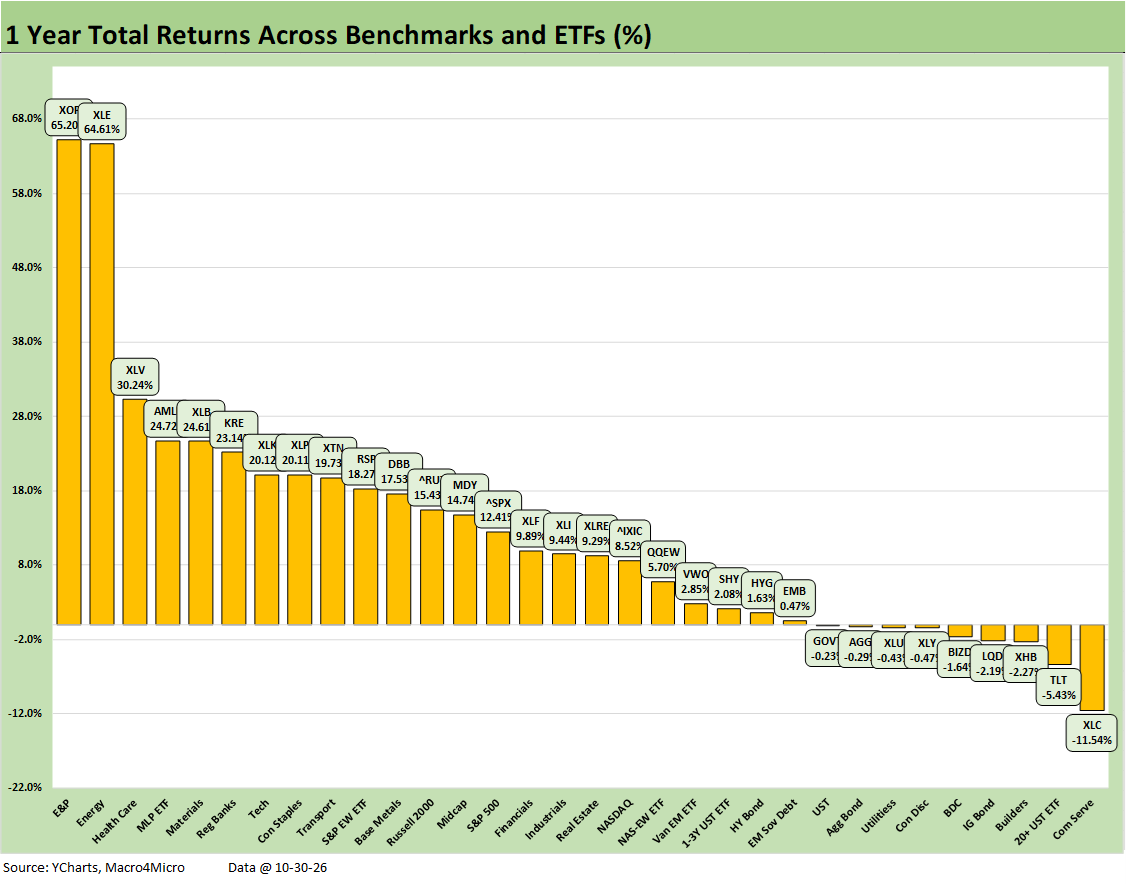
The trailing 1 year has 9 in the red after only 1 name in negative range as of June, but the 23-9 score drives home it was a great time to be invested in equities with 4 of the 9 in the red being bond ETFs. Bond ETFs overall were 3 positive and 4 negative.
The top of the leaderboard is much like the YTD mix with energy ETFs (XOP, XLE, AMLP) in 3 of the top 4 rankings and the defensive Health Care ETF (XLV) in the top 5. Materials (XLB) rounded out the top 5.
XLB strength mirrors the commodity and raw materials pressure that came with tariffs and the AI capex boom. Materials continue to roll into inflation and affordability pressures whether squeezing business costs or consumer price tags.
The Tech ETF (XLK) ranked #7 in the top quartile behind Regional Banks (KRE). KRE’s performance pushed back somewhat on the fear of widespread stress in private credit and strained corporate loan credit quality. After all, the forces driving capex, a consumer rebound, and lofty fixed investment increases economic activity into a lot of regional ecosystems. The question ahead is whether those capex and consumer lines will face more strain on any defensiveness in spending and lending.