

We will raise it later. We’ll take it.
The payroll adds have been spotty across 2025-2026 in a “low hire, low fire market,” but the additions for the trailing 1-year period show some strength in durable goods. A few key lines in Services still dominate. The running LTM payroll increase is well below the annual average of most (not all) Presidents over the last 50 years (see Employment Across the Presidents 8-15-23, Payroll % Additions: Carter vs. Trump vs. Biden…just for fun 1-8-25).
The Services line still dominates the payroll count with Services total payroll over 5x the total in the Goods category. The LTM payroll additions in Services payrolls comprise almost 84% of total YoY payroll delta. Within Services, the Health Care tally comprised around half the total payroll additions.
Goods had a positive rolling 1-year on the back of the Durables line with Nondurables declining. Fabricated Metals and Transportation equipment were the leaders in Manufacturing, but the highest YoY lines were still below 40K in payroll adds.
We detail the major line items below, and they fail to make the case that tariffs would bring payroll joy. Some glaring examples of what tariffs did not do could be seen in a decline in Apparel and Textiles as well as Furniture. Those lines posted declines.
The debates on the economic cost of tariffs vs. the benefits will continue with the USMCA still up in the air and an ugly home stretch in US-Canada trade. Canada is the highest-value export mix among US trade partners and shows a Goods trade surplus ex-crude oil. It is hard to get factual when Trump will not even admit that the buyer writes the check for the tariff (2025 trade Deficits: Reality vs. Rhetoric 2-19-26).
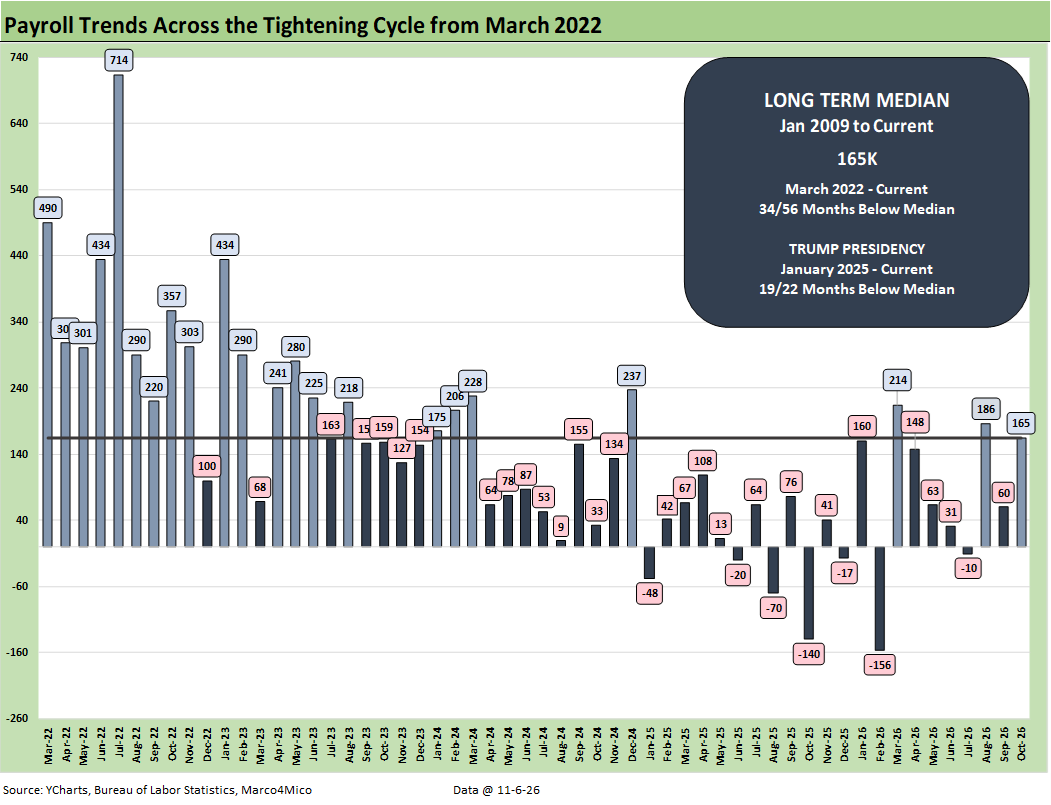
The above chart updates the monthly payroll additions including the upward revisions for August and September. The timeline of this chart starts back in March 2022 when ZIRP came to an end with the tightening cycle and inflation pressure going into overdrive.
The October 2026 payroll additions of 165K landed on the median line of 165K. It does not take much effort to see how weak even that number was in the context of 2022-2023. The sagging job adds in 2024 at least did not post any negative months. We see 7 months in the red during 2025-2026.
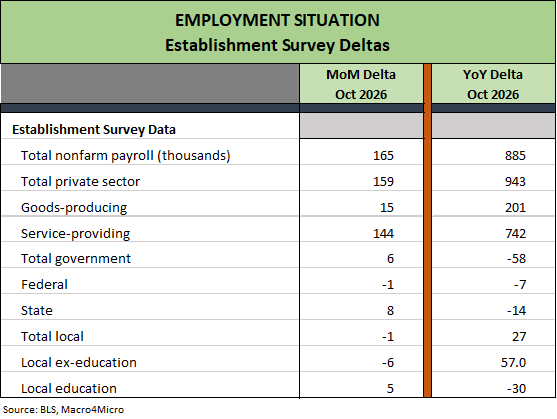
The above table details the MoM and YoY payroll deltas by major line item. The +885K trailing 1-year includes +943K in the private sector. That total of payroll adds pushes back on the anti-Trump crowd that says the US economy is collapsing (which is nonsense). It also pushed back on Trump claims that he has overseen the greatest economy in history (which is “nonsense cubed”).
Services still rule and “goods producing” saw Construction generating more than half the “Goods” jobs as we detail in the next table. Seeing -30K in local education can only be seen as worrisome. The US getting dumber is obvious enough some days, but that number and the quality and pay for those in education need to be showing better trends than that. Kicking out ambitious, hard-working immigrants is a separate topic.
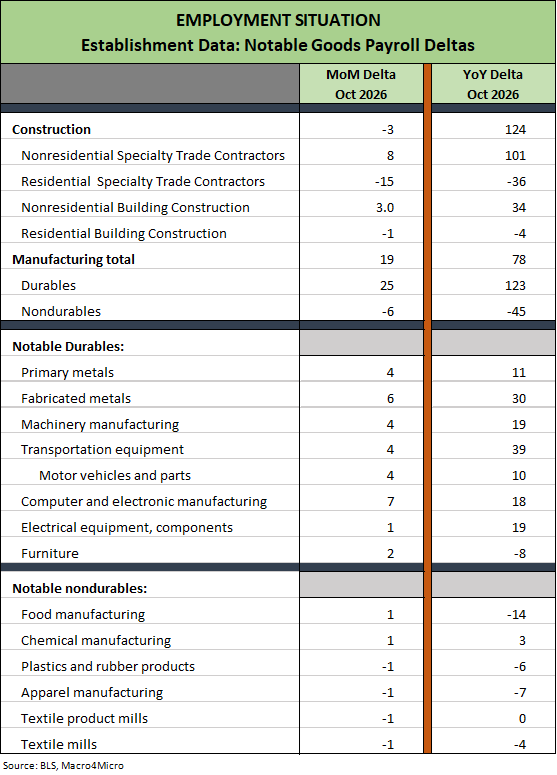
The above table on goods-producing lines is self-explanatory. Construction drove the 1-year growth with Nonresidential construction leading the way on the AI capex boom. We still see Residential struggling in the red. That payroll count was also not helped by immigration policies as many migrant workers left or “hid.”
Durables lines showed relative strength vs. Nondurables. For all of the tariff promises, the 10K increase in a 16+ million handle vehicle market is unimpressive even with the planned relocations of assembly plant operations by leaders such as GM and Toyota. The uncertain and erratic tariff policies across administrations also can lead both OEMs and suppliers to rethink timing and scale. Assembly plants are multiyear projects. What the EV policy whipsaw holds is another wildcard.
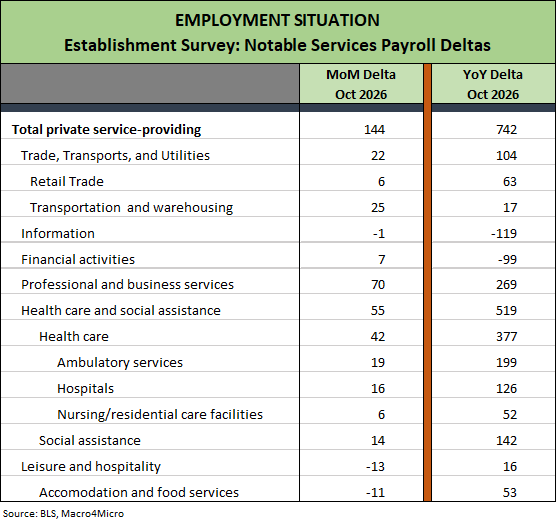
The US is a services economy, and that will not change. What could change is the total jobs available in the new AI world where so many positions and functions can be automated. The decline in manufacturing across the decades was in part about offshoring, but displacement of US workers was also heavily linked to automation. That handicapping will be playing out across 2027 just as the pace of AI growth will be an unfolding handicapping and budgeting exercise for employers.
In the table above, we always see Health Care and Social Assistance dominating with periodic swings in Leisure and Hospitality. The “Professional and business services” lines are diverse, but the biggest moves were in admin and support. What AI will do to those occupations in the future is a worry.
The monthly chart collection…
The following charts are from our usual payroll chart collection. The occupational details above take more time in the digging and review process.
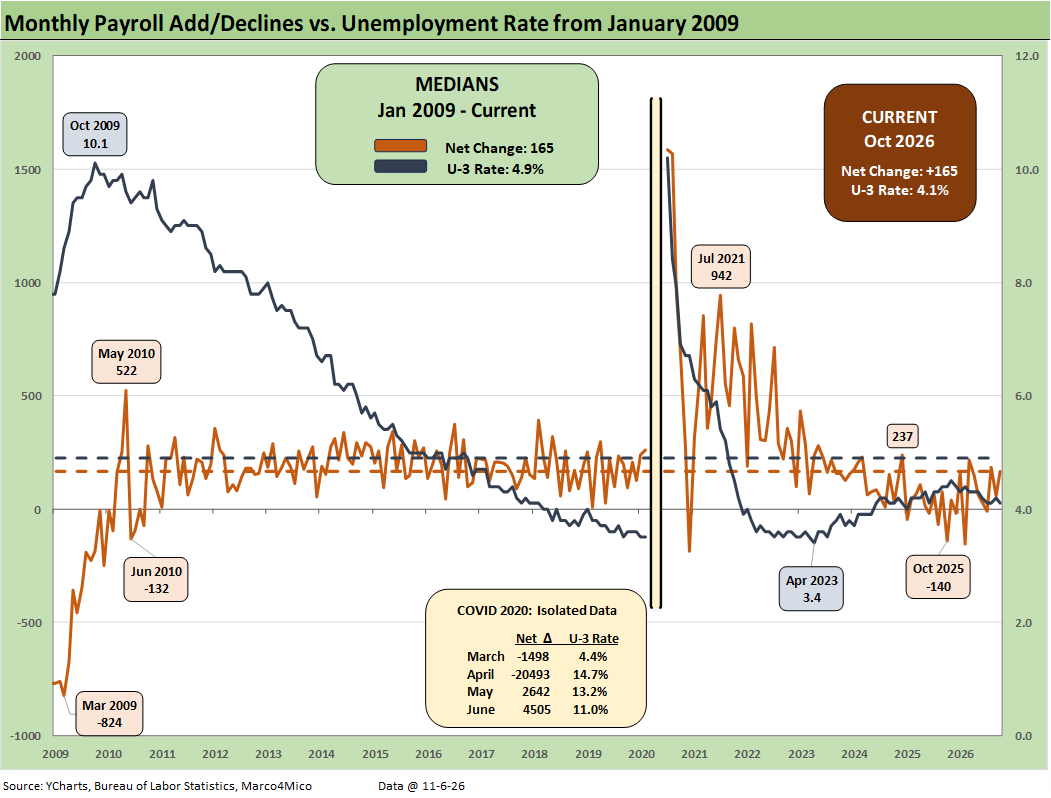
The above chart plots the running job adds/declines since Jan 2009 against the unemployment rate, which at 4.1% remains a full employment level in historical context. The separate Household data survey shows a 421K increase in the civilian labor force and a 463K increase in the number employed (-41K decline in the number of unemployed). The 4.1% unemployment rate (7068K unemployed/170,683K civilian labor force) declined from 4.2%.
In the chart, we isolate the worst months of the COVID dislocations in the box for better visuals to capture the other periods. The 4.1% U-3 is well below the long-term median from Jan 2009 of 4.9% (5.0% median from 1994).
Payroll counts in the Establishment data have been struggling somewhat in relative terms in 2025-2026, but history is very kind to a 4.1% level. The U-3 is a different exercise than “counting employed heads” in narrow context.
If the frame of reference for payroll additions is 2024 (not a good jobs year), then the 2025-2026 numbers are acceptable (not great). If we compare 2025-2026 monthly adds to the 2022-2023 period, the current job add run rates are weak.
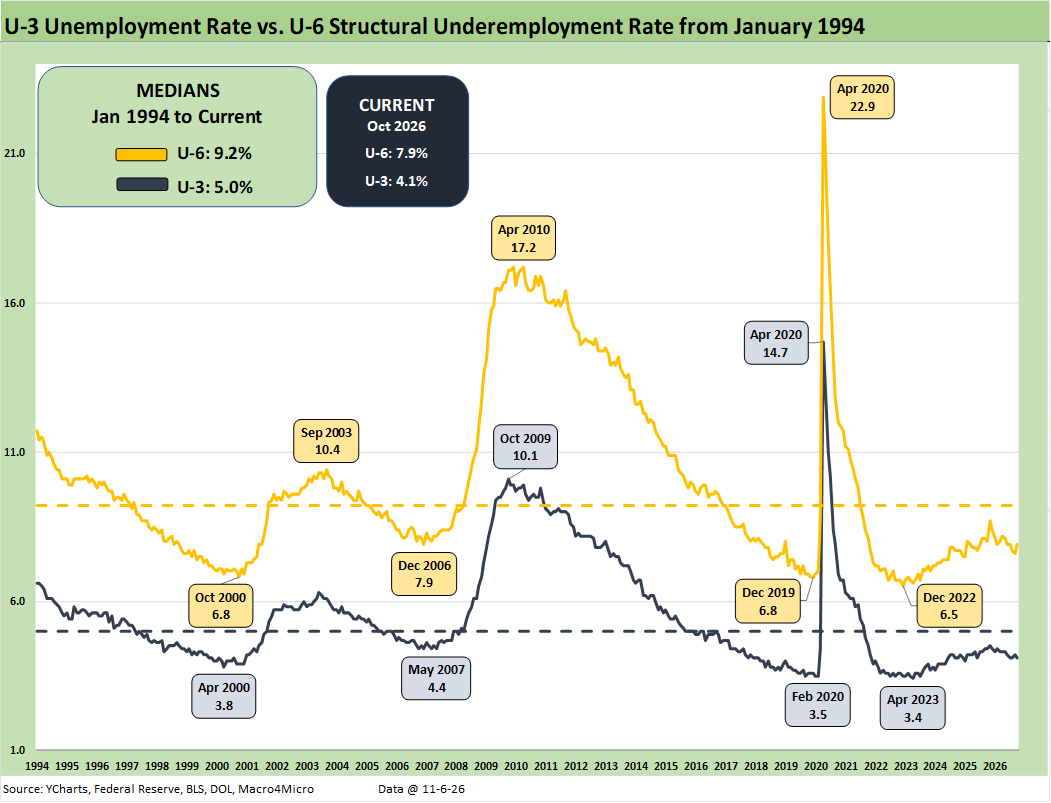
As noted, U-3 ticked lower this month from 4.2% to 4.1%. In contrast. the U-6 posted an unfavorable increase from 7.6% to 7.9%. The U-6 is the structural underemployment metric that is always useful to watch. To start 2025, the U-6 rose sharply in Feb 2025 to 8.0% from 7.5% in Jan 2025. The U-6 jumped to 8.7% in Nov 2025 from 8.1% in Sept 2025.
The current 7.9% marks a decline from 8.1% in May and 8.2% in April. That is good news. However, the current U-6 remains well above the 6% handles seen in spring of 2023. The U-6 is still well below the median from 1994 of +9.3%, which notably includes the post-crisis shock and the longest recession since the Great Depression.
As a reminder, the U-6 metric is defined with the numerator as “total unemployed + persons marginally attached to the labor force + total employed part time for economic reasons.” The denominator is “civilian labor force + workers marginally attached to the labor force.”
As noted in the Household Survey data, the civilian labor force rose sequentially by 421K with the category of “not in labor force” declining sequentially in October by -293K to 105.0 million. “Not in labor force” can be as simple as someone who wants a job but is not actively looking.
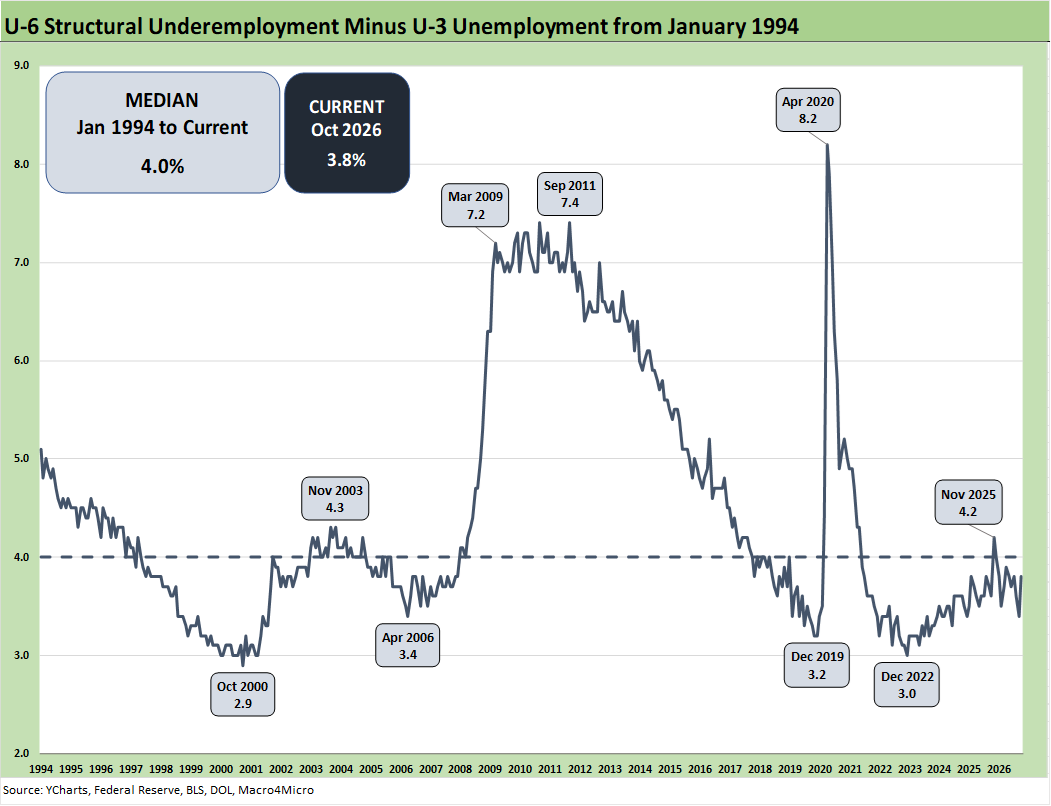
The time series above updates the U-6 minus U-3 differential as a measure of relative employment quality and to flag risks of major dislocations in large swaths of the economy (think oil patch collapse in the late 1980s, tech bubble imploding into a weak 2001-2003, and financial services and automotive meltdowns in 2009).
The current 3.8% differential is below the long-term median of 4.0%. The job ranks are still vulnerable now with stubbornly uncertain and erratic developments in Iran and apparent interest from Trump to make more reckless trade attacks. Trump will be challenged by the new Congress with the dominant count in both the House and Senate. We will look at the potential for renewed attempts to pull more of the power on tariffs back to Congress in a separate commentary.
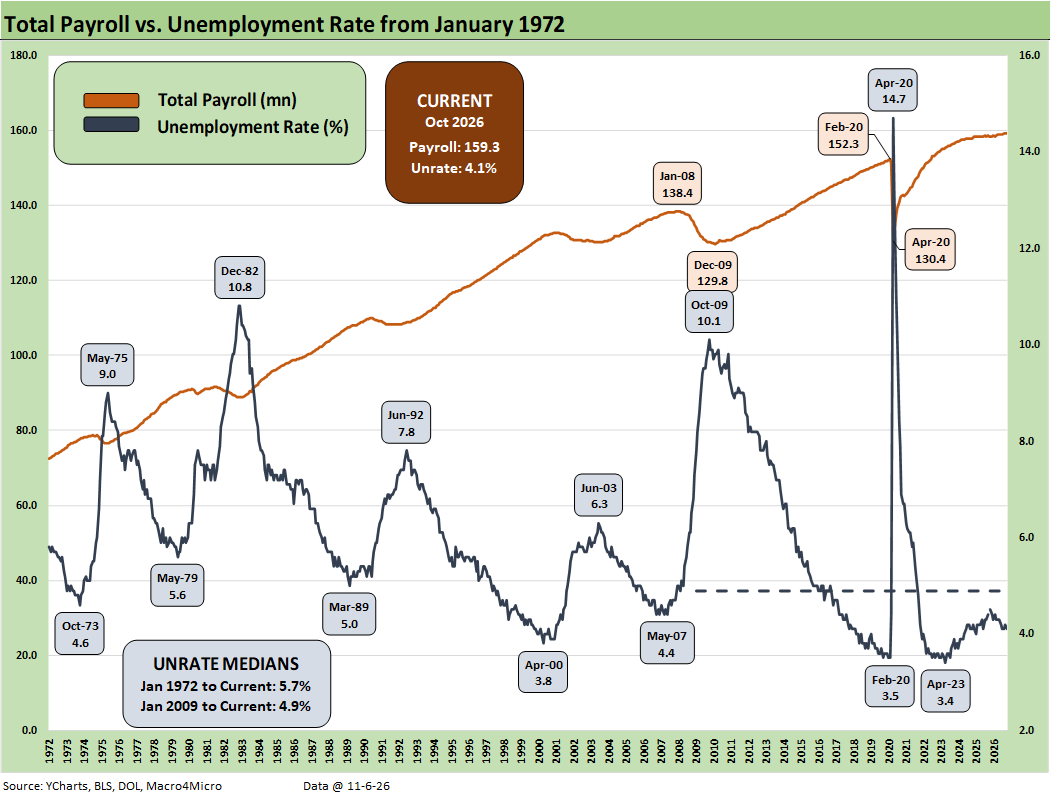
The above chart updates total payroll vs. the unemployment rate. The trend needle has not moved much in 2026 and has been in a narrow range. More bodies with more paychecks is always a good thing.
The trick from here is how the consumer deploys their paychecks and whether the zero-sum realities of household budgets undercut spending. The PCE line in the GDP accounts is a critical driver of growth, and the current negative real wage growth is not a tailwind.
Despite the affordability pressures, PCE growth has rebounded into 3Q26 from lows in 1Q26. PCE growth represents 68% of GDP, so the improvement in 2Q26 and 3Q26 GDP after a very weak 1Q26 GDP offered some tangible cyclical relief (see 3Q26 GDP: Happy Days? 10-29-26, 2Q26 GDP: Good Underlying Numbers Despite Headline 1.5% 7-30-26, GDP 1Q26 Final: PCE Growth Plunge 6-25-26). It gets tricky from here on those real wage pressures and declining savings rates.
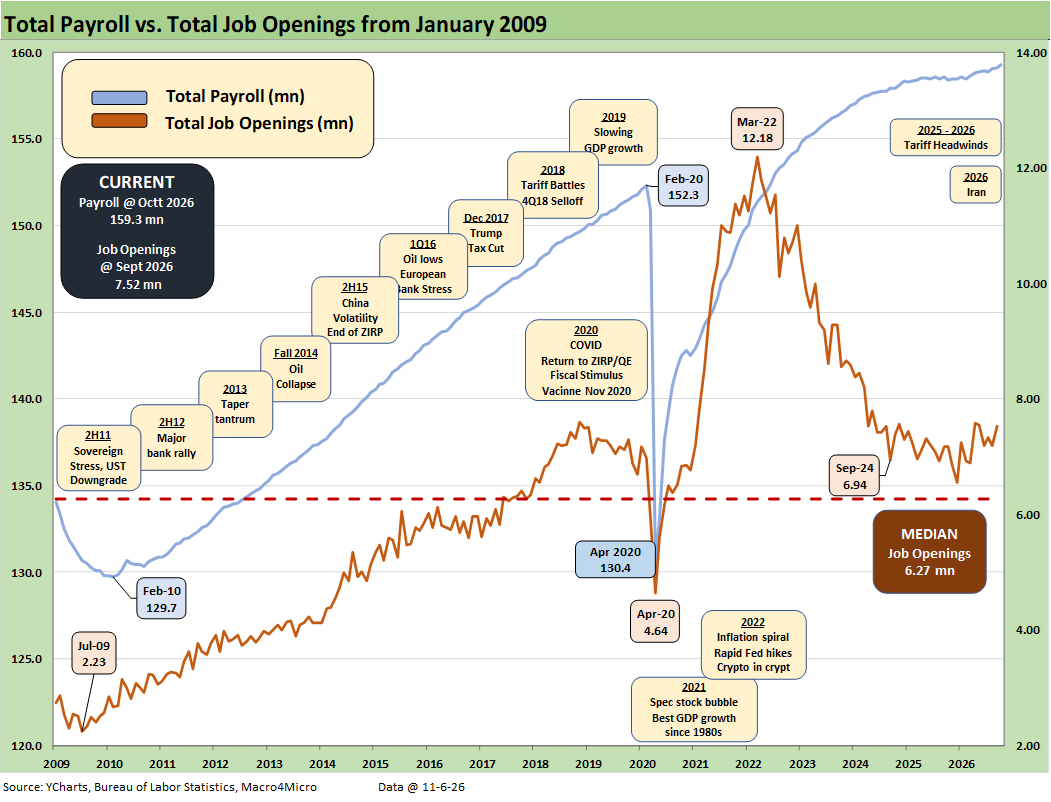
The above chart updates the total payroll numbers vs. job openings. Management teams have a lot of moving parts to factor into planning, whether quantitative or qualitative, before they fill the openings.
The potential for a wave of new tariffs ahead with the USMCA demise (or replacement) and the escalating clash with Canada and potentially the EU are not incentives for employers to rush out and fill the job openings or to launch more initiatives where the economic inputs are in a state of flux. AI is also a planning X factor that could accelerate in a macro setback or economic contraction at some point.
The sweeping political changes that are likely to roll into the process after January 2027 will make for more drama as the market waits to see what budget battles bring and whether the new House and Senate majorities can curtail Trump’s tariff excess and get the US out of the Iran quagmire. That will not be a smooth or easy process, but many in the GOP hate tariffs and need to consider 2028 after this latest beatdown.
Many in the GOP must worry what Iran escalation would mean for 2028 prospects. Primaries are a little more than a year away. Trump might be seen as “less scary” to a subset of the GOP after he was just crushed in the midterms. Trump does not carry the “threat weight” as a lame duck after a brutal midterm beatdown. He may no longer be the force that has cowed the Senate and House across the Trump 2.0 period. In technical parlance, some GOP Senators and GOP House members might grow a set. Maybe not.
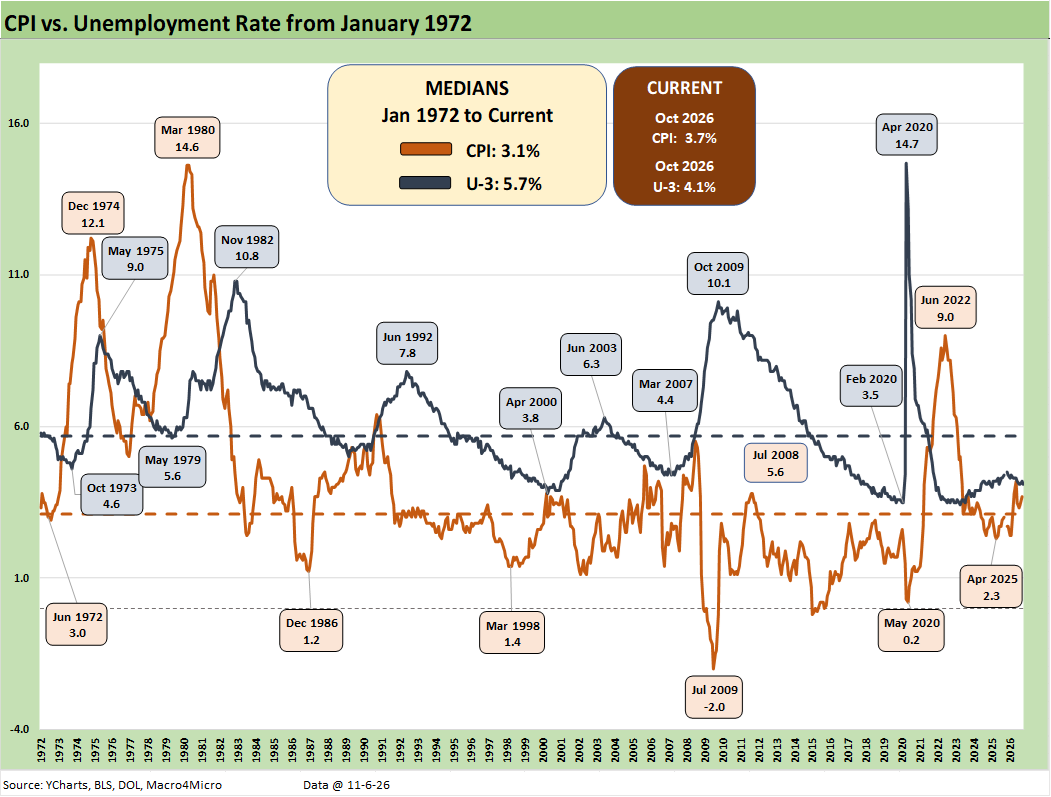
The CPI vs. unemployment rate is plotted above. The big worry back in March as Iran escalated was fear of stagflation – something not seen since the 1980-1982 double dip under Volcker (except a brief touch of worry in fall 1990).
The stagflation risk has subsided in recent weeks despite the stubbornly high inflation numbers. It would take a massive setback in US-Iran escalation risks to change the status quo, but the refined product crisis had eclipsed discussion of the Strait. That was among the major factors that cost the GOP control of Congress.
Oil could still be volatile to the downside, but diesel and home heating oil now trump oil futures tomorrow. Maine and New Hamshire voters just gave their opinion on a number of items, but the incremental thousands of $$$ per household they will shell out this winter for home heating oil mattered. The Democrats won those two Senate seats against highly (formerly?) respected GOP leaders.
In general, the overall economic impact of tariffs has been far less than feared given the reality that most trade partners backed down in 2025 and into 2026. That said, the trade war with Canada could lead to more disarray. A clash with China would be a disaster with the “One China” risk (i.e., Taiwan) as a “non-nuclear, nuclear option” via trade and supplier chain control.
The backdrop in tariffs will remain a major part of the affordability problem in 2027 and especially with Canada threats getting worse. With the latest wave of Section 301 and 232 and Smoot Hawley 338 attacks on supplier chains and trading partners, the new Congress has plenty to target. There is always the chance that Trump might push Mexico too far in USMCA talks and the same with the EU, where US relations are at a low.
The worst-case scenario in trade would be trade wars with the top 3 trading partners (EU, Canada, Mexico). That is something the “new minority” (the GOP) would like to avoid in 2027.