Industrial Production: Flat for Now, New Downside Risks Loom
We review a stable industrial production month and frame some material risks ahead.
“Depositors went that way. Will industrial production be far behind?”
While one man’s stall is another man’s “sideways momentum” when debating cycles and Fed policy, we see the stable profile of February capacity utilization numbers as now subject to a bucket of new downside catalysts that just started with the banking worries and credit contraction fears.
Headline capacity utilization moved sideways as did Durable Goods and Nondurable Goods with Total Manufacturing ticking down slightly by 0.1%.
From here, the manufacturing sector will need to broadly reassess game plans for inventory levels and spending if the current bank drama is seen as leading to tighter credit for customers or the manufacturing borrowers see some more demanding credit terms.
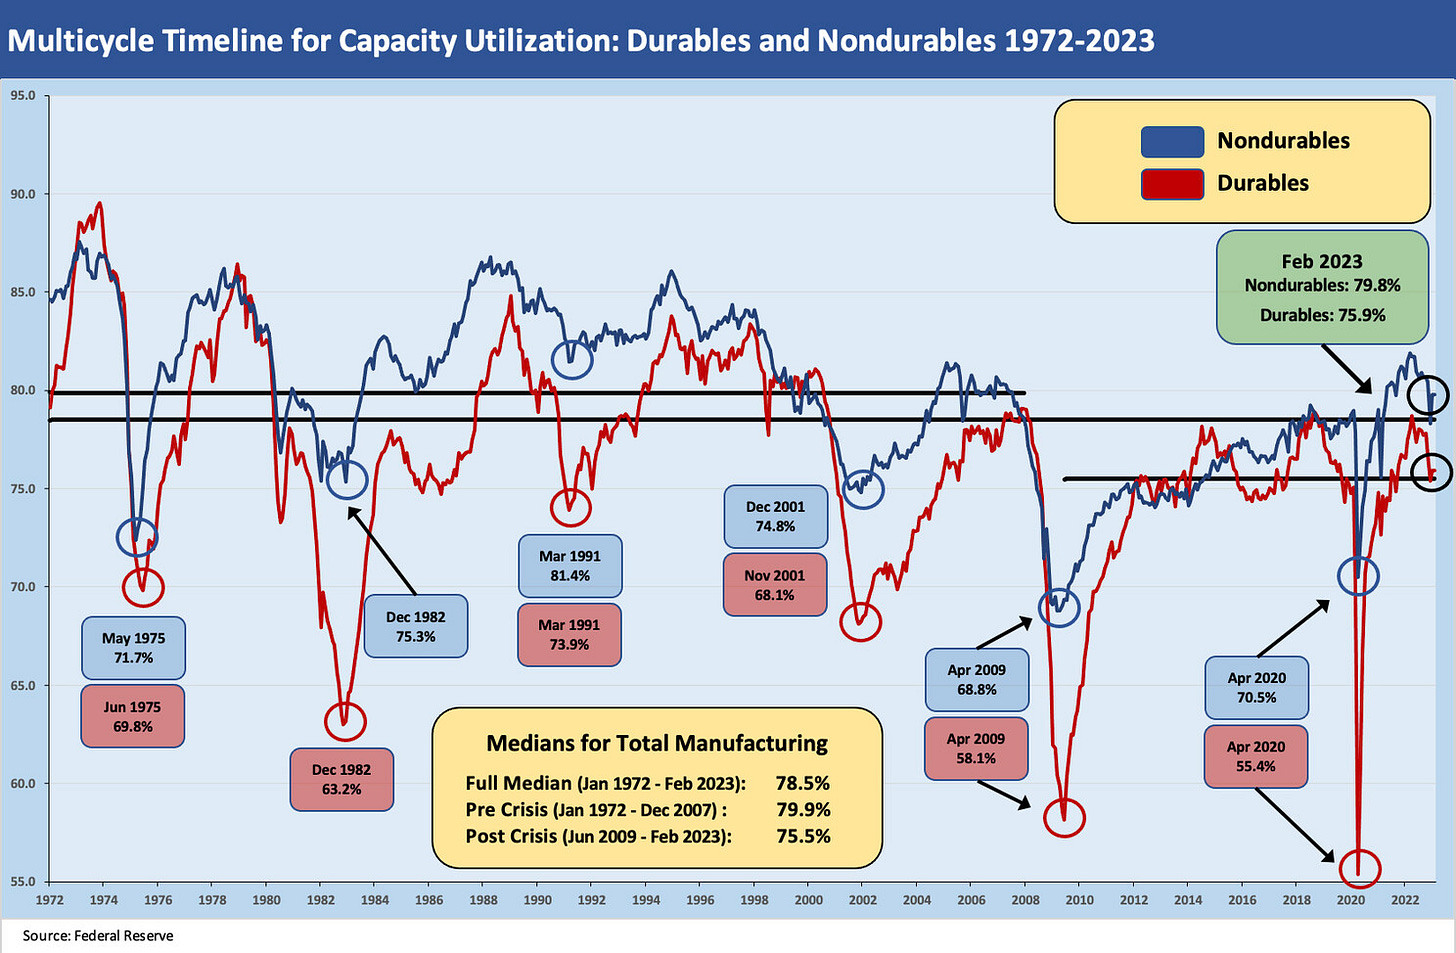
We like to use Capacity Utilization (“Cap Ute”) as a good measure of Industrial Production and pricing power. The metric travels well across cycles as capacity ebbs and flows and secular changes take place across industry line items as outsourcing and cost structures evolve. As we discussed in prior commentaries on this topic, the translation of Cap Ute into profitability shifts over time with product mix and costs. The evidence is that the manufacturing sector has been more profitable since the credit crisis at lower capacity utilization levels. The sector is much more efficient after all the restructuring.
The above time series for Durable Goods and Nondurable Goods tells a story of wide swings across the cycles with the end of recessions usually “at or close to” the bottom ticks in industrial production. The flip side is true at peaks. For a lot more information on cyclical history, we have plenty of archives on the topic (see Expansion Checklist: Recoveries Lined Up by Height 10-10-22, Business Cycles: The Recession Dating Game 10-10-22).
Cyclical comps are hard to find just given the inflation factor…
We have been listening to and reading commentaries over time by those looking for parallels and “policy comps.” We all do that same drill. The big difference this time around is that there is little since 1982 (the double dip Volcker recession ended Nov 1982) that has the stagflation component in the mix. People would mention stagflation all the time across the decades, but they were very light on the “-flation.” Often the stagflation chatter was more about drama and catch phrases. A 3% and 4% CPI was not the 70s and early 80s nor was a couple of months of CPI increases on oil prices.
What we have now is very high services inflation, low unemployment, tightening by the Fed (including QT), and “potential tightening” by the banks and capital markets in credit. Banks now need to be extra cautious on loan quality and many smaller banks are heavy in real estate and energy. The idea that fed funds should be higher than inflation in order to break it is not lost on history (see Fed Funds vs. PCE Price Index: What is Normal? 10-31-22, Fed Funds-CPI Differentials: Reversion Time? 10-11-22).
So, the scenario of stagflation is a higher risk now than before. The market clearing price would require higher spreads with such a set of conditions.
On another topic that has been pushed out of the headlines this past week, we have a radical group of brand name extremists pushing for a UST default. That’s a full menu of poisonous ingredients.
As of March 2023, a corporate planner has a lot of inputs to juggle, and the pegboard of economic risk factors has a lot of holes to fill in. The very strong employment story and PCE hopes is the last of the major strong variable at this point. Before March 9 (SVB spiral to March 10 failure), the sense that the banks were well positioned was a major hook to hang a soft landing or “no landing” on when taken in tandem with record payroll. We just lost the story on banks as the depositor freakout was not in the game plan. Bank analysts watched NII, asset quality and capital for the most part. They were understandably not handicapping the risk of mass depositor psychosis on major losses in Hold to Maturity portfolios. That would also entail factoring in risk management incompetence and the regulators cozying up under the tree with Rip Van Winkle.
By the numbers…
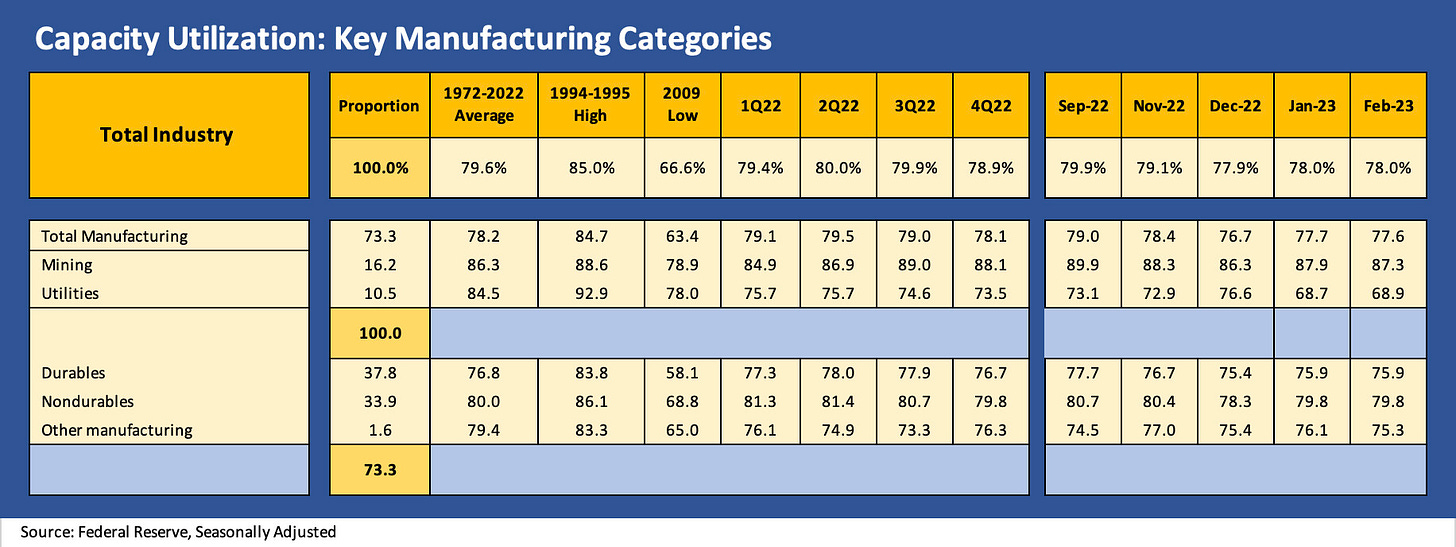
The capacity utilization for the broad categories are broken out above. We see the total flat at 78.0%. Durables was flat at 75.9% and Nondurables flat at 79.8%. Mining and Utilities were mild moves with a bigger drop in Mining to levels below recent rates in late 2022. Utilities are lower vs. recent levels and well below long-term averages.
The narrower industry group’s sequential trend was on balance slightly negative with Fabricated Metals and Aerospace down very slightly. The declines in Motor Vehicles and Parts and in Machinery were also small with only Computers and Electronics rising. We also include the long term averages from 1972 to 2022 in the second column.
Flat Cap Ute is OK, but the rules just got rewritten for coming months…
We had started to see some firming in manufacturing even if mixed on an industry by industry basis (see Capacity Utilization: Tailwinds Return 2-15-23 ) after some hints of a fade earlier (see Capacity Utilization: The Fade Begins 1-18-23). That cyclical conversation was playing out broadly in the context of both consumer sector health and the soaring payroll count and also in terms of what it all meant for the threat of a 50 bps hike.
The curve was pushing higher, and the cost of capital was rising along with the duration pain. Then SVB changed the rules of the game (see Risk Appetites Get Bloodied 3-15-23, SVB Reprieve: Hail Powell the Merciful 3-12-23, Silicon Valley Bank: How did the UST Curve React? 3-11-23). The yield curve was spooking the demand side, but most did not expect duration losses would set off a depositor dash worthy of Usain Bolt.
Capital budget and production/inventory plans (i.e., what shows up on the other side in Cap Ute) will need to be looked at with an eye on the threat of “credit contraction” as being the very definition of recession risk if the standards tighten up across the long tail of industrial borrowers. The credit contraction across the bank system (or trade credit) has not happened yet in scale, but those looking ahead will expect to see some caution and pause some plans to see some of this bank chaos play out some more.
The threats to unfunded committed lines from the events unfolding are also a topic that has minimal visibility so far in the case of SVB. A bank failure raises a lot of questions in general. Fears of asset quality pressure will increase for lenders. For borrowers/customers, the worries around making plans with uncertain funding availability can fog up project decision-making and the risk-return economics from new capacity to acquisitions.


