Capacity Utilization: The Fade Begins
We are seeing broader weakness in industrial production and capacity utilization. Will pricing power wane?
The market saw weakness in both Retail Sales and Industrial Production today. Retail sales have been down 3 of the past 4 months and Industrial Production has been notching down as well with some variances across categories over the period since the summer. We tend to weigh the durables line more in our focus (note: it is around 39% of the capacity utilization index) given the multiplier effects of those industries across materials, in terms of tonnage across freight and logistics, and with respect to the complexities of the supply chain challenges.
The latest industrial production data is now showing enough signs of wear and tear to give more support to the expectation of weaker fundamentals more broadly. That is different than a “recession now” story line as we sit here today looking across the wider range of industries’ investment plans and most importantly consumer behavior (PCE lines in GDP). The Services part of the economy so far has been more about inflation and high demand than recession. Manufacturing has been feeling some angst of late. This is consistent with the less goods/more services theme we see in the markets.
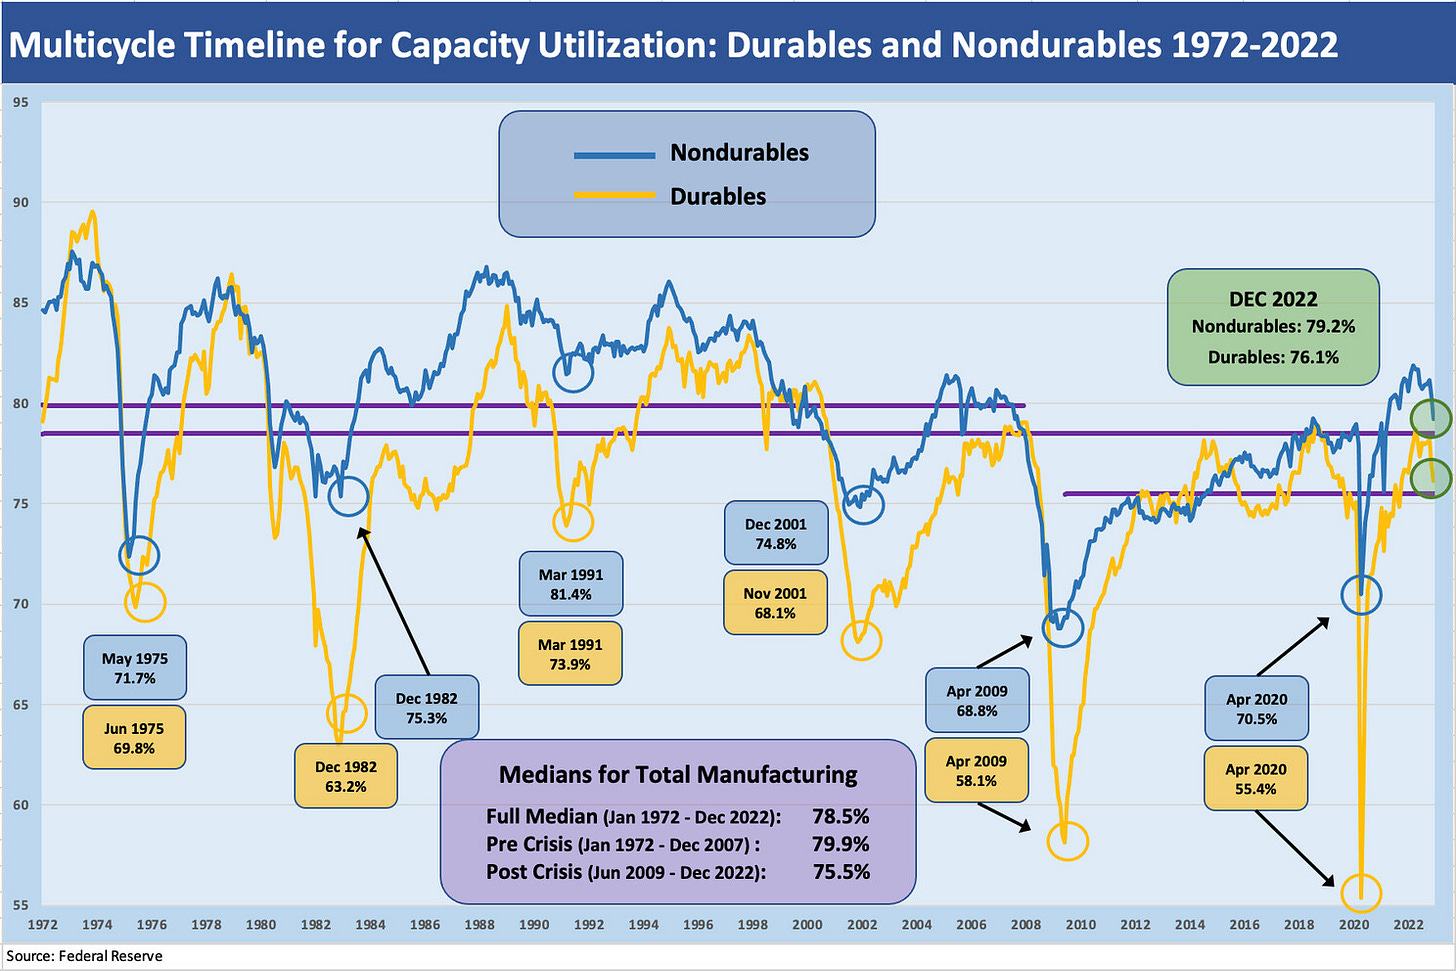
Above we plot the long-term time series for capacity utilization for Durables and Nondurables. To be clear, the two time series lines covers Durables and Nondurables separately, but the median lines are for the Total Manufacturing index. We get into more of the industry and subsector lines in tables further below, but this timeline shows the ugly lows and what were “higher highs” in previous expansions.
The credit crisis marked the cap ute lows given the collapse of demand, severe funding pressures, and the systemic spike in risk aversion. Those stories are told elsewhere, but the 50% range in Durables at the lows is basically getting closer to Book of Revelations stuff (or maybe Ayn Rand on downers?). The auto sector in early 2009 dropped down into the 20% handle range during the credit crisis for light vehicles. The chart is more for a cyclical frame of reference, but it tells a story of how weak in relative terms the post-crisis cap ute rate was vs. the pre-2007 cycles.
Industrial production, cyclicals, and breakeven rates as a factor…
The Industrial Production stats have always been a major factor when NBER gets around to setting dates on cycles (see Business Cycles: The Recession Dating Game 10-10-22). The bottom tick of industrial production often coincides with the date set for business cycle troughs. The economy is different than it used to be with such a large services component, so the weakness in manufacturing is not as easy as saying “we are already in a recession.”
As we have discussed in other commentaries, the supplier chain issues and very different breakeven rates of many manufacturers (i.e., lower breakeven volumes for a given product mix and price structure) relative to the pre-crisis years (i.e. pre-2009) have make the critical capacity utilization level for a cycle as a tougher call on what constitutes “big trouble.”
The lower capacity utilization levels seen in the post-crisis expansions were actually lower than numerous past recessions. At the same time, many of those companies in the underlying universe were quite profitable at lower levels. That presumably is going the other way now for many companies in the age of tariffs, inflation, and rising wages. That will be fleshed out in earnings reports across 2023.
The cap ute exercise and historical trends…
We like to look at the line items of the cap ute index by sector for signs of who is tweaking (or trimming or slamming) production rates. Such dial-backs in production run rates fall hardest on the earnings of higher fixed cost companies just on the unit cost math (costs divided by fewer units).
It is useful to ponder some questions on what the trends might mean for some (and not for others):
Is the weakness tied more to defensiveness around forward sales?
Are some manufacturers simply making rational decisions to manage working capital needs and avoid excess inventories, price pressures, and bigger earnings problems later?
Are some adding capacity in expected growth areas?
Will the Fed interpret slowing industrial production rates as a sign that demand is softening and that producers are losing some pricing power?
Will the Fed see this as evidence that those job openings they are so worried about are going to get reeled in across some industries?
As we covered in earlier commentaries, industrial production was hanging in well enough during the early fall when so many were yelling “we are in a recession now” (see Capacity Utilization: No Recession Numbers Yet 10-18-22). When the top line started to ease sequentially in Nov 2022, Durables were still in the respectable zone relative to the full trailing year picture (see Capacity Utilization: Durables Still Steaming Along 11-16-22). The Nov capacity numbers showed more weakness, and we heard more discussions around inventory being too high (see Capacity Utilization: Grinding Not Fading – Yet 12-15-22). As supplier chain anxiety eased, the idea was that a healthier balance could be struck in inventory between “just in time” vs. “just in case.”
Watching the underlying drivers of production remains the research process in framing the “Why?” of slowing production for any given company. There is the demand side of the equation along with supplier chain assessments and what it all means relative to any ongoing inventory build.
The moving parts of industrial production and cap ute need to get framed with other indicators such as the “Trade Inventories and Sales” releases from the Census among others. The November inventory data from the Census was also out today with sequential inventories higher vs. October and up over 15% from Nov 2021. That inventory growth and a guarded view on sales expectations might inspire tapping the brakes on production as part of prudent planning by management teams.
The recent trends by major sector, subsector, and industry groups…
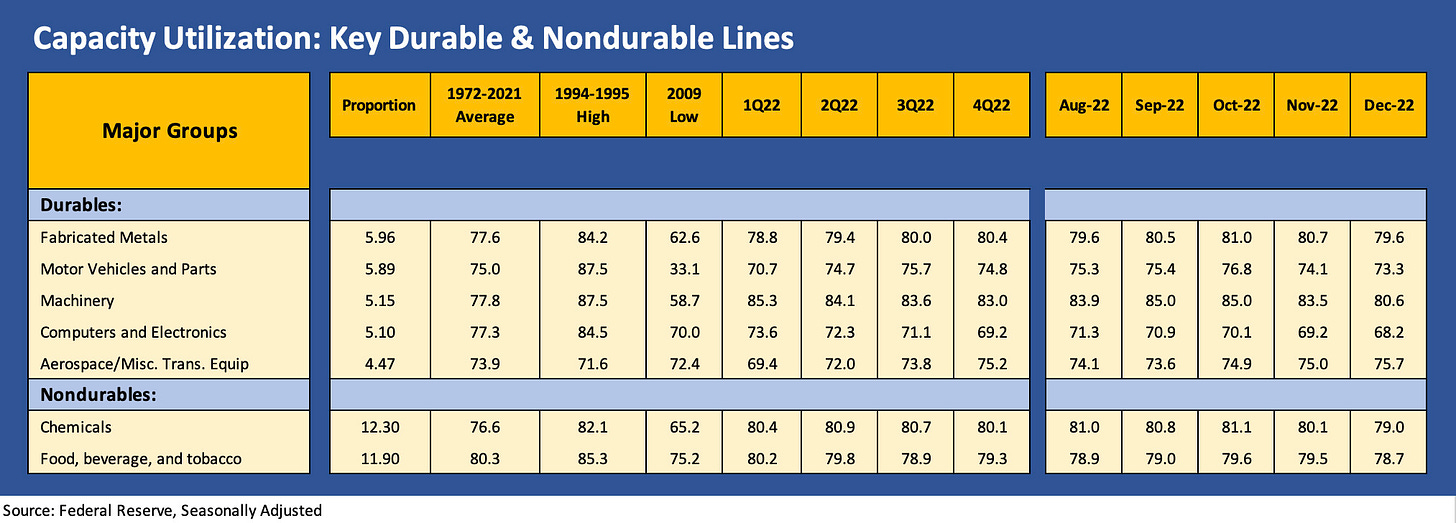
The charts further below look at the headline capacity utilization and the breakdown at the total manufacturing level for some of the key Durables and Nondurables subsectors.
As we look at the broad manufacturing picture above, there is not a lot of mystery in the trend line. Every box for Dec 2022 is down sequentially except the Utilities line with its weather tailwind in December. This chart also now posts the 4Q22 numbers, and we see the 4Q22 vs. 3Q22 declines as being less onerous than the downtrend line for Dec vs. Nov 2022. That said, they are still down in the chart above.
Getting more into the trend line for the lead Durables and Nondurables subsectors, the above chart shows everything except Aerospace down sequentially in Dec 2022. That is not the case for 4Q22 which shows a more mixed trend with Aerospace, Fabricated Metals, and Food/Beverage higher and the rest lower.
Auto production volumes have been running at recession levels for a while on supply chain problems that are continuing (notably chips). The long-term average is an unsightly number for autos, but the pre-crisis auto industry was brutally inefficient. The 73% handle now is worse than it looks, but the industry also has a radically different unit cost profile today and lower breakeven than in the “old days” before 2009. That cost profile will be getting tested as the OEMs pour capex in the EV product evolution.


