Capacity Utilization: Tailwinds Return
Capacity utilization is a sibling of industrial production. We see strengthening below the headline number.
After a softer December, we see signs of firming in industrial production and capacity utilization numbers.
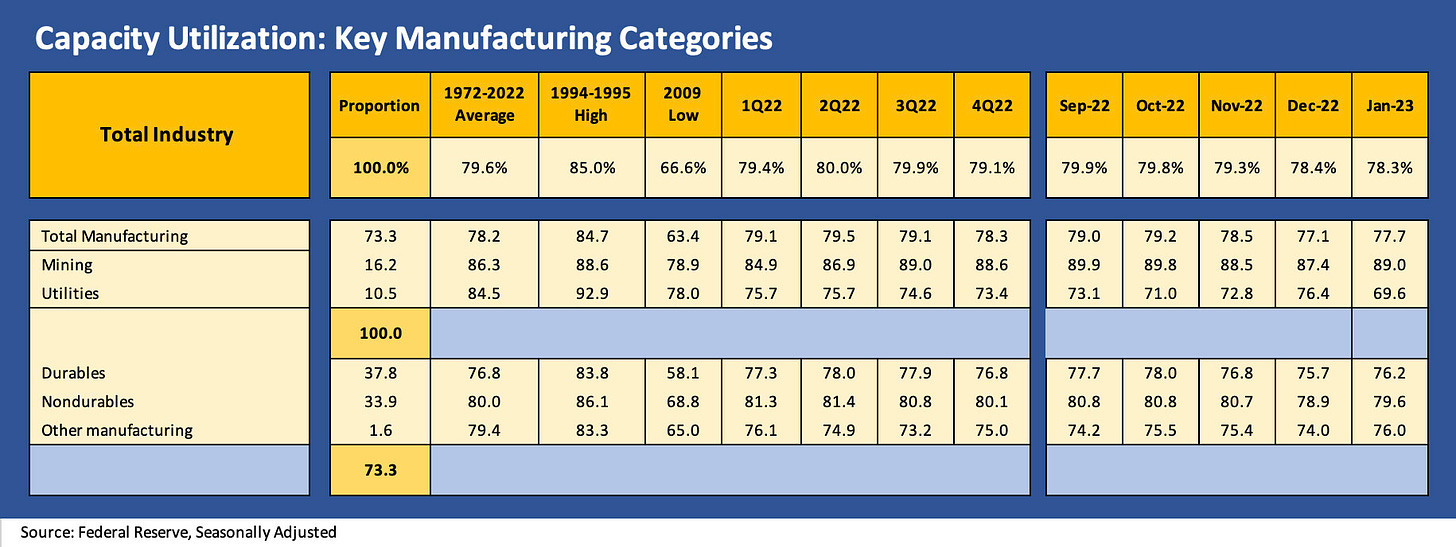
Below we break out the capacity utilization numbers derived from industrial production indicators, and we see durables and nondurables broadly stronger in January after all the revisions.
With retail sales heating up earlier in the day, the industrial figures join the strengthening parade.
We liked to watch the capacity utilization numbers monthly to see where some shifts could be getting signaled by any given industry group. The headline capacity utilization number (“cap ute”) is one indicator of pricing power just on the simple principle that tighter available capacity in aggregate signals high demand relative to theoretical supply. Total industry cap ute ticked down slightly in January, but total manufacturing moved higher with both durables and nondurables moving higher as well.
We break out the proportions for the moving parts of the total industry capacity utilization in the tables further below. With the exception of utilities hitting the lowest utilization rate since 1972, the manufacturing lines showed sequential strengthening. That came right after a very strong Retail Sales headline in the morning after a couple of weak months. Capacity Utilization was also underwhelming over the past two months, but we see January posting healthier trends in both Manufacturing (Durables and Nondurables) and Mining. These numbers are also pushing back on recession themes as that debate continues.
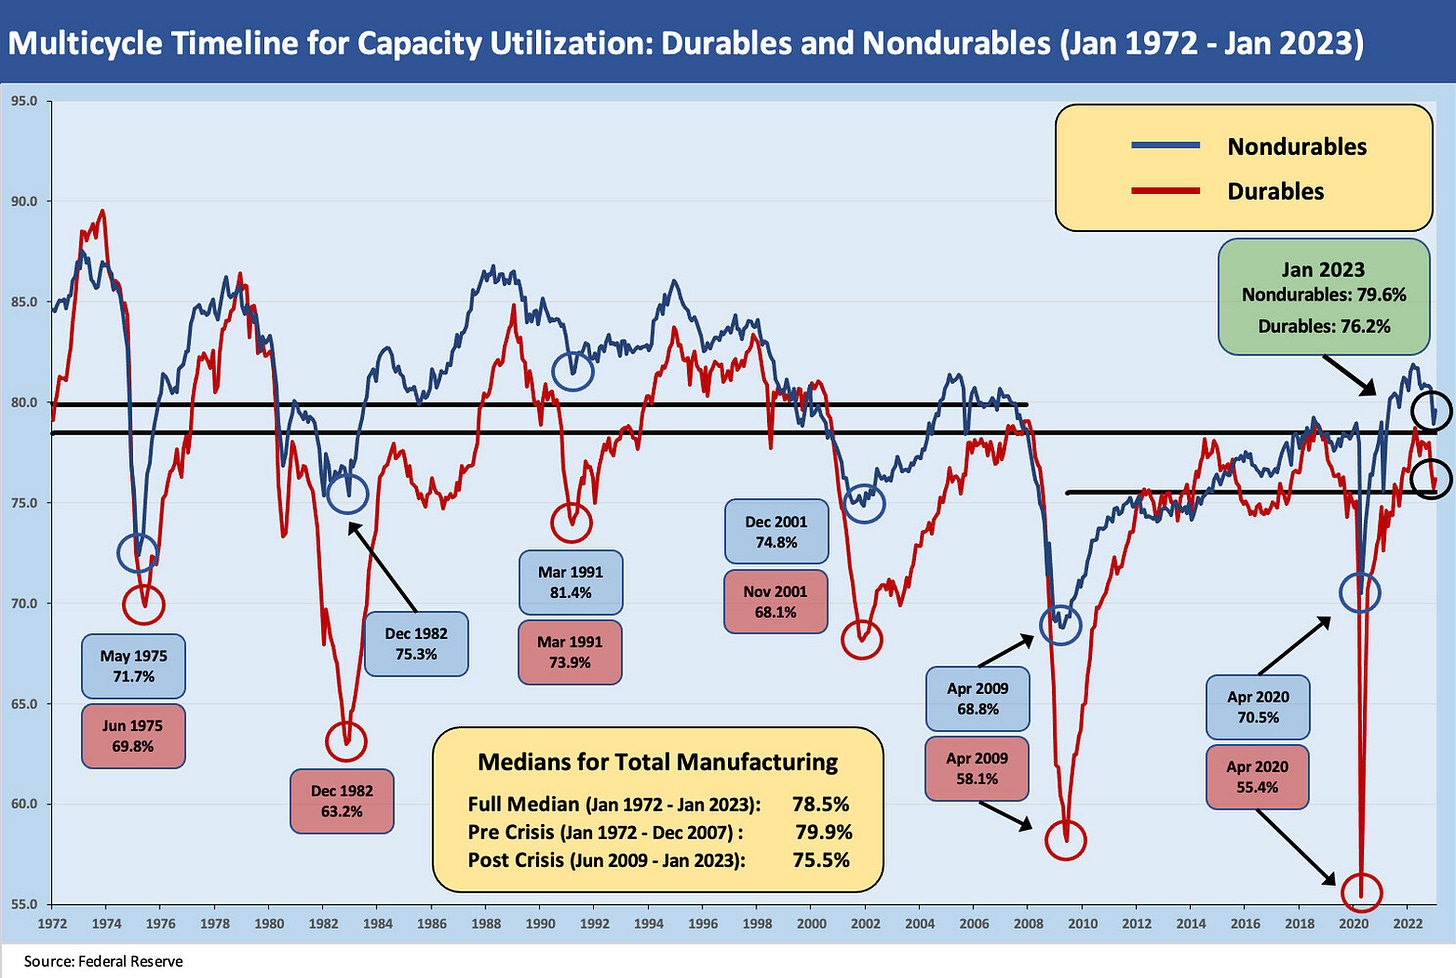
Below we plot the medians for total manufacturing in the horizontal lines, but we plot the Durables and Nondurables components in the long-term time series lines.
We looked at the main moving parts and questions to ponder in the Dec 2022 recap (see Capacity Utilization: The Fade Begins 1-18-23). The theories around what run rates allow for pricing power vary widely by industry just as the theoretical breakeven rates are a function of shifting units costs and mix for any given company and industry group.
Below we update the headline numbers for manufacturing and detail the larger industry groups. The releases come with more than a few revisions each month, and those are updated from what was disclosed in prior commentaries on this important economic indicator. We also rolled in some of the new line items weightings (“proportions”) below with manufacturing declining by almost 3 points in the mix and mining rising by a similar amount.
Following the trend lines in the above chart, we see Manufacturing higher and the same for Durables and Nondurables. Mining strengthened and Utilities plunged. We are biased toward “durables watching” given all the multiplier effects that come from materials to components to services and freight and logistics.
The lower cap utes vs. long term history have been a feature of the post-crisis cycle as discussed in other commentaries. The lower breakeven for many companies after so many actions in restructuring and automation investment in the industrial sector have made for strong earnings and cash flow stories across many manufacturing subsectors. Investment and efficiency have moved the goalposts on the volumes required to send profits higher. We have often noted how cap ute numbers in the expansion were often below prior recession averages.
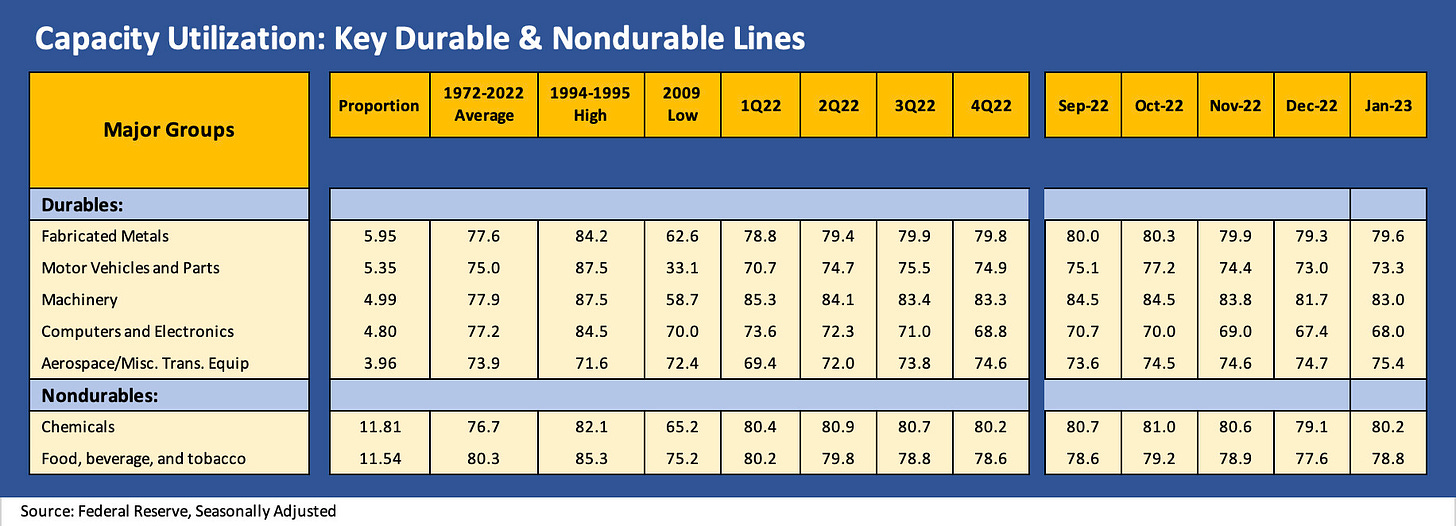
As we get into the larger categories in Durables and Nondurable that we track above, we see 7 out of 7 of the industry groups move higher. We are just emerging from the earnings season for the capital goods and auto names. We looked at some of those sectors in our last two weeklies (see Footnotes and Flashbacks: Week Ending Feb 10, 2023, Footnotes and Flashbacks: Week Ending Feb 3, 2023). The commentary from many of these reports still go into the “firm but mixed” category. Trade issues will remain a big swing factor for most.


