Footnotes and Flashbacks: Week Ending May 21, 2023
The debt ceiling process will not get off DECFON 1 status until “x-date” becomes “court date” for the 14th Amendment Plan B.
"Straining for a bridge to somewhere. Anywhere but here."
This Week’s Macro: Debt ceiling chaos and bad faith; asset returns; yield curve slopes, deltas, and migration; HY vs. IG spreads.
This Weeks’s Micro: We update the running return performance for Midstream equities across the time horizons and frame relative dividend yields in an industry rich on free cash flow but in search of growth plans.
MACRO
The debt ceiling will be the all-consuming variable day-in, day-out until the GOP “blow it up gang” gets the crisis they desire and have been actively seeking. Then it will be on to the 14th amendment for the Biden administration and some days in court. The sanity-check questions on why this happened can be seen as simple or complex. We vote simple.
Why did McCarthy et al. put a fill-or-kill, take-it-or-leave-it deal on the table that the Democrats clearly could not accept outside of a political suicide pact and when the deal could not get past the Senate anyway?
Why haven’t they waited for budget debates and shut the government down in the old school tradition and leave that shutdown going as long as it took to cut a deal?
Why go for maximum asymmetric risk and a potential economic swoon, severe household level pain, and major job losses all the while precipitating a massive crisis?
In our view, the answer to the third one answers the first two. McCarthy is being dictated to by players who want to create a crisis. It is that simple. Some even want a default for their own branding and fund raising. They want to make history and then get reelected in deep red districts. They want to keep the Trump beat going. It is a pretty simple set of reasons given the characters involved. They knew McCarthy would fold like a cheap suit and any one or more of them can shred his Speaker role. Seems straightforward, so what does that mean? Section 4 of the 14th Amendment.
The real question is how do the Democrats counter without laying down arms and walking into the sea carrying anchors? There is no game theory at work here. That grownup, housebroken stuff is for Senators. This is a very dangerous time in the House. If Biden wins on the 14th amendment, get ready for the budget shutdown later unless a handful of rational centrists can find common ground.
As bad an outcome as a default would be for the economy (i.e., employment, banking system, stocks and bonds, investment in the US by multinationals) and for the future of US credibility and reliability in the global markets at a critical time of geopolitical rivalry, there is little to lean on for support and hope. These characters would not think twice about torching the economy to serve their narrow ends. Many on the far left are as incompetent as these people but just not as vicious and destructive.
The basic premise to support a rational outcome is that the players involved share a common goal to respect the constitution and support the idea of democratic rule as opposed to a minority rule of gerrymandered power blocs that work on behalf of narrow ideological interests that include racism and xenophobia on the short list. We realize those bringing us to this point are in a big tent, but that tent has a membership that gets sketchy in sections.
If we consider that the most extreme elements have very low reelection risk, the hope to get somewhere relies on splinter groups, and too many of the centrist conservative elements have fold-up spines and some critical body parts stored in jars on a shelf somewhere.
If we consider committee assignments and fund raising (read “power and money”), then we start to see how centrists’ downside is greater if they don’t go along just with a fill-or-kill of the White House on the debt ceiling. Their personal franchise and professional financial incentives favor going with the flow. They will seek to duck UST debt default blame the way many have navigated the rejection of the election results and Jan 6 accountability.
It goes something like this:
“Biden won!” Response: “No he didn’t!”
“Jan 6 was a violent insurrection” Response: “No it wasn’t!”
“Trump lies all the time!” Response: “No he doesn’t!”
“Trump wants to be an autocrat!” Response: “No he doesn’t!”
“Trump had the worst GDP performance in decades even excluding 2020” Response: “Nope. Best economy. Ever, ever, maybe in the world!”
“Trump never collected billions from China. Buyer pays.” Response: “Huh?”
How hard would it be to add to the collection:
“You caused a default!” Response: “No, you did! Pants on fire.”
The center-right stays quiet but toes the line even though they might be the best hope. Alternatively, the center right can join in on something that saves the day and gives some concessions. After weeks of missing the point by bringing a rubber knife (“we won’t negotiate”) to a budget chainsaw fight, the Democrats at least are now putting a counter on the table with revenues as a minimum to make a deal. That is a nonstarter for the GOP team, so at least they can exchange nonstarters with the merit of being active. The revenue (aka tax) counter is at least “on topic” (paying down debt).
What next?
The more you read, the more you get back to the easy platitude saying, “We cannot default.” No kidding. Then Trump chimes in (Default!). Then the Fair Tax (i.e., sales tax) advocates chime in (blow it all up). Then the pro-Russia/anti-Ukraine noisemakers get in on it. Then a former cross-training manager announces her list of impeachment candidates across the executive branch (the White House cook was let off with a pardon). It gets easier to see how this group would go the distance on the “fill or kill” proposal when you consider the nature of the beasts that you see roaming the halls.
We base our observations on the working assumption that these are people who do not respect the outcome of elections, reject the jury system, oppose the justice system if their leaders run afoul of the law, attack the military leaders who think objectively and respect the constitution, and oppose a free media that employs documented facts. This growing base of political leaders see reelection risk as the only leverage that would deter them from lighting the fuse and watching it burn to the powder. Most have their constituents all teed up and in on the rebellion. For most, their reelection risk is low. That will not be the case with the centrists if they don’t get involved.
The conclusion: 14th amendment, here we come. In many ways, it is like evaluating geopolitics more than companies. It is a subjective list of factors evaluating what makes the other guy tick. We hope the left and right are better at this with the China challenge than they are with each other (I doubt it). A misread of China strategy in negotiation would entail more than a UST default. Back in the time of Korea, MacArthur got China wrong from his echo chamber in Tokyo. In the meantime, China might be high on the list of UST sellers as the #2 holder behind Japan. That could mean some unwanted supply on the market in a UST default.
A debt ceiling bender is bad; a budget battle hangover next will not help…
We looked at some of the dynamics in our last weekly around the whole idea of “game theory” (see Footnotes and Flashbacks: Week Ending May 12, 2023). That mental exercise has less utility if some are playing a different game, and some clearly “are not playing at all.” They would not have pitched such an overwhelmingly unacceptable proposal “as a floor” if they were.
The challenge of a minuscule majority is that it is easier to “86” the Speaker. Only a Speaker who did not come off the cajónes-lite political assembly line can meet that challenge. This is not one of those times. The other problem is that such a small majority awards disproportionate power to the most extreme elements. Those that fit the description can easily be numbered at 20 – arguably more. A majority of the GOP house refused to recognize the election. That is not normal in the context of the 2011 parallels.
The other mind-reading exercise is targeted at the rating agencies and their subjective role in the action. Will they moonwalk or make their feelings known and clear? Or will the agencies “adjective” the heck out of it but still understate the problem?
The fact is that the multiplier effects across the economy will not even be understood by some of these Congressional players. It has been clear many are very light on their understanding of how markets even work. The damage will be real if a default occurs. That is clear, but even if the White House pulls off the 14th Amendment gambit, there is still the budget war ahead.
We learned quite a bit in 2011 and 2013 about the goals of those who would risk default. That was a time when the Tea Party was grabbing more reins and pulling hard. The Tea Party members of that period look like paragons of equanimity compared to the breed of House member that voters are turning out today. During 2011 and 2013, the Tea Party had a number of goals, including cutting off Obamacare funding.
At least the Class of 2010 Election (2011-2012 in power) in the House had the mandate of the largest house seat pickup in history. That was a lot like the 1946 swing in the House as the population had Democrat fatigue (that year also brought us Joe McCarthy in the Senate). The 2010 crew was tough. The 2016-2020 crowd is well down to the bottom of the barrel of talent and brain power.
Today the policy is “run hard, talk loud, avoid facts, insult regularly, refuse to answer questions when you don’t know the answer (that is a lot of questions), ignore basic concepts, and recruit the angriest most extreme elements.” We’ll see how it goes.
Personally, I am not planning on my June 1 T-bills turning into cash at this point. Maybe with the 14th Amendment and ensuing legal challenge I will collect. Then I have another one on June 6. The interesting test will be how mutual fund outflows behave in other asset classes.
The short list of knock-on effects…
The potential for spiraling effects is considerable. To name a few, we could see a volatility spike, counterparty risks rise as leveraged derivatives blow through maximum potential exposure estimates, collateral impairment creates confusion, consumer credit quality implosion as household borrowers say “screw this, the government doesn’t pay,” we see suspension of credit card lines, PCE forecasts plunge, potential sell-down of UST holding by some major nations cause long term demand erosion for UST in the future, and the list goes on.
Future risks will need to be handicapped as higher probability since the same meatheads will still be in the Congressional pen snorting nonsense. It is not an endorsement of the dollar as global currency.
We may now see one of our uglier items on the “Neurotic’s Checklist” playing out in real time (see Risk Trends: The Neurotic’s Checklist 12-11-22). One silver lining would be the death of the debt ceiling if the Supreme Court ruled it unconstitutional. By the time that was ruled on, the markets would be spiraling. Then the market would start factoring in more government budget chaos as the next step of the ongoing devolution of US government functionality.
Comparative Asset Returns…
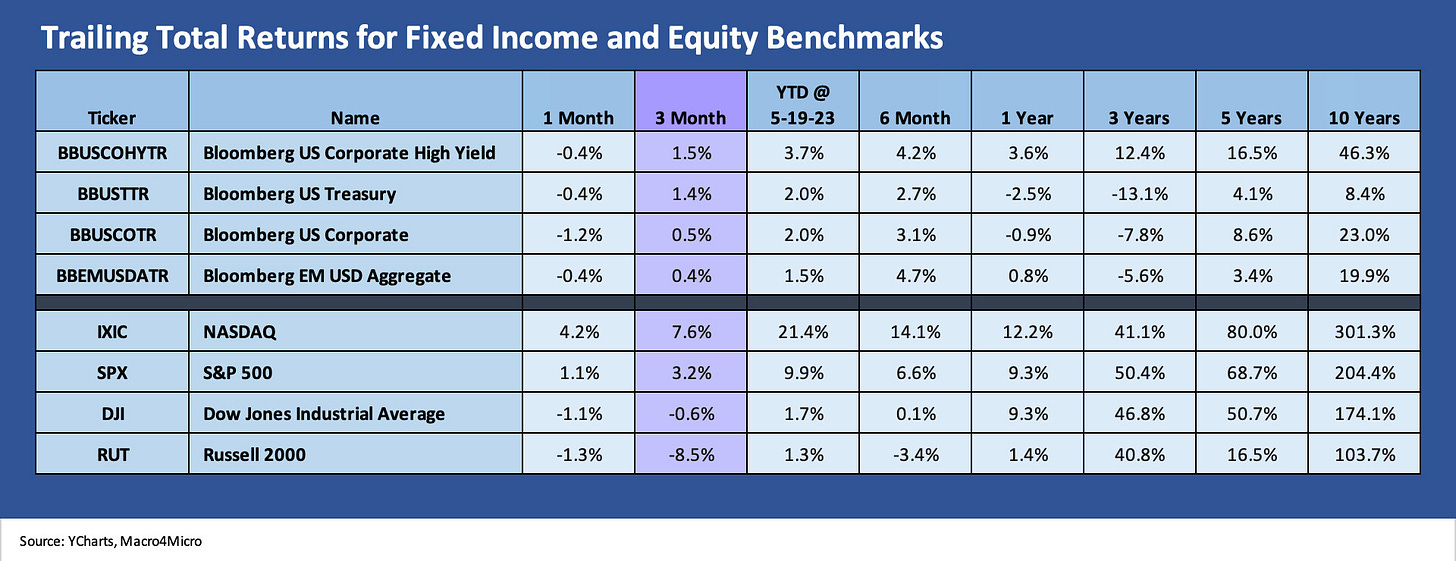
The above chart updates the rolling time horizon for the main debt and equity asset classes as we look to a few wild weeks ahead. We line up debt and equity in descending order of total returns for the trailing 3-month time horizon. We see duration pain taking its toll on debt over the past month with all four asset classes in the red. All four posted minimal asset returns over 3 months as well with the US HY market riding the coupon to a modest 1% handle but UST getting an edge on the post-SVB curve rally. We detail those UST shifts further below in this commentary.
For the equity bucket, it is still showing a similar trend with growth in the lead and the Russell 2000 bringing up the rear in the red. The S&P 500 is around half of the NASDAQ over 3 months with the Dow and small cap Russell 2000 in the red. We look at more of the asset class proxies and industry groups in the ETF section below.
The 1500 and 3000 equity index series hammers home the recurring lack of breadth reality that is nothing new at this point. We again line them up in descending order of 3-month total returns. S&P 1500 Financials have been hit hard by SVB and the interest margin squeeze tied to the UST curve shapeshifting and higher cost of funds. Many banks are also seeing the commercial real estate jitters filter into the clouds passing over the sector. If we do see that start to spread to consumer credit quality on a debt ceiling default and economic downturn of some magnitude, then the financials will just have one more problem.
The energy sector has had a very rough year after a banner 2022, and the direction of natural gas prices (around $2.59 as we go to print) has been uglier than the sharp decline in crude oil with WTI around $71. Energy is a mixed bag from upstream to downstream, and there are plenty of strong operators in the mix. The reality is that the more severe price dislocations that many expected with Russia Ukraine did not play out.
Real Estate is a very diverse and mixed story line from REIT income flows in a rising rate environment to worries around some major subsectors (Offices, Retail). There is also the fate of the major tenants who are struggling now and the many more who will struggle if Congress hits the kill switch on the UST market.
ETF and benchmark index returns…
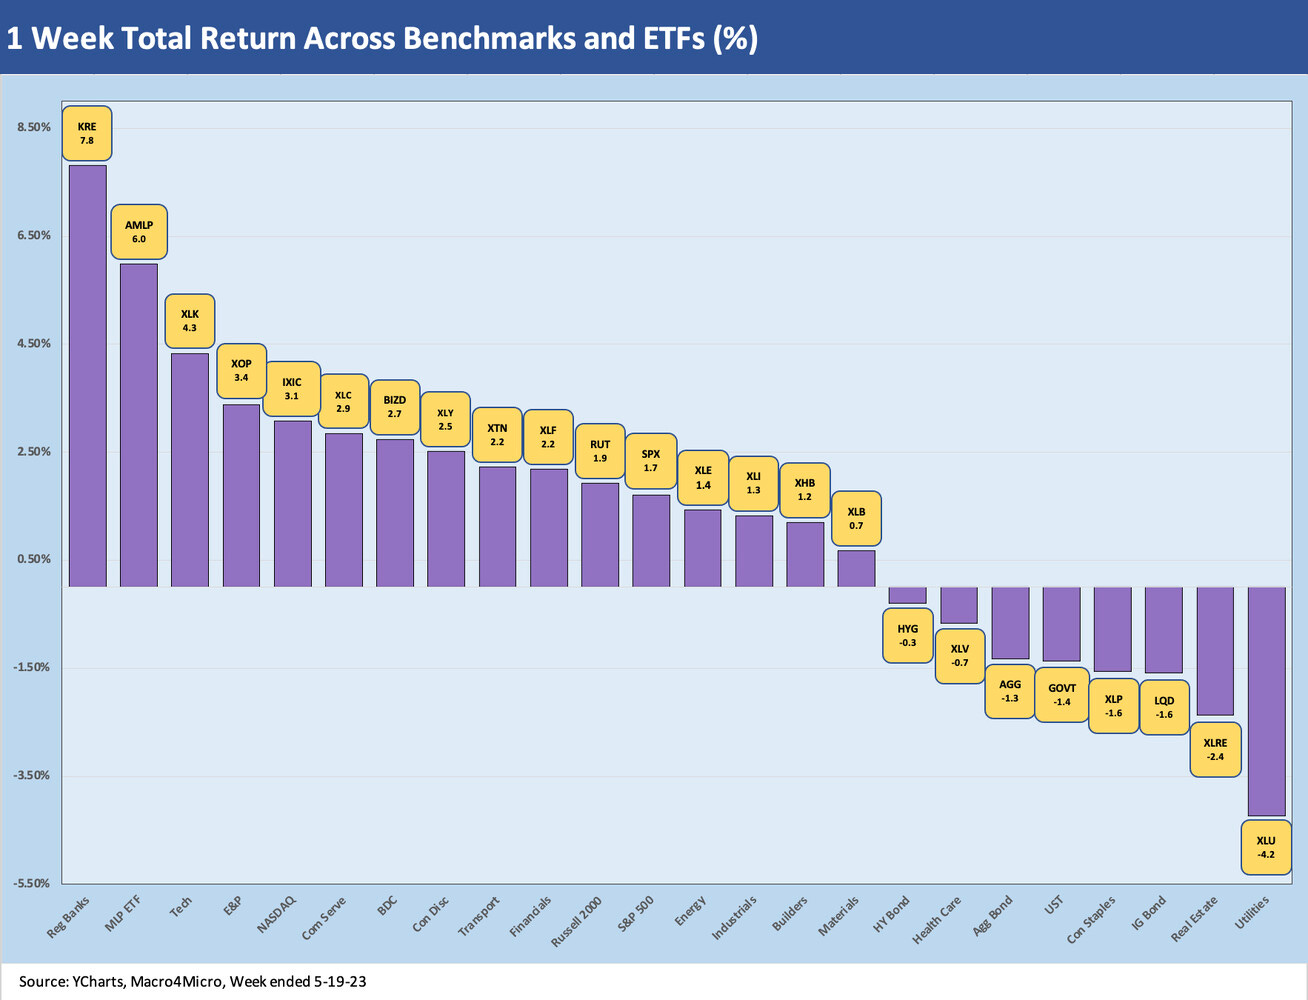
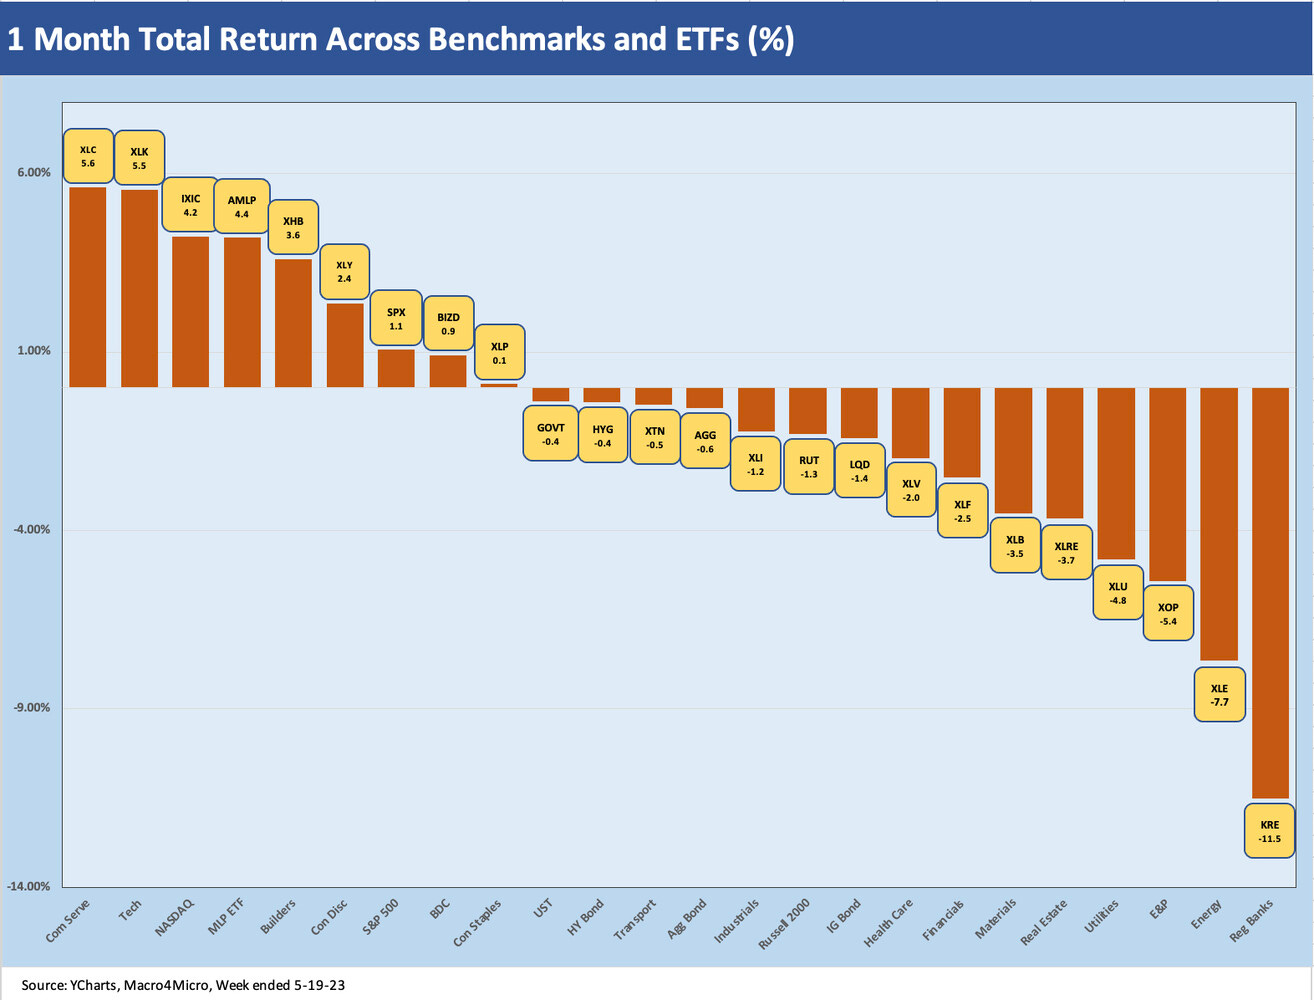
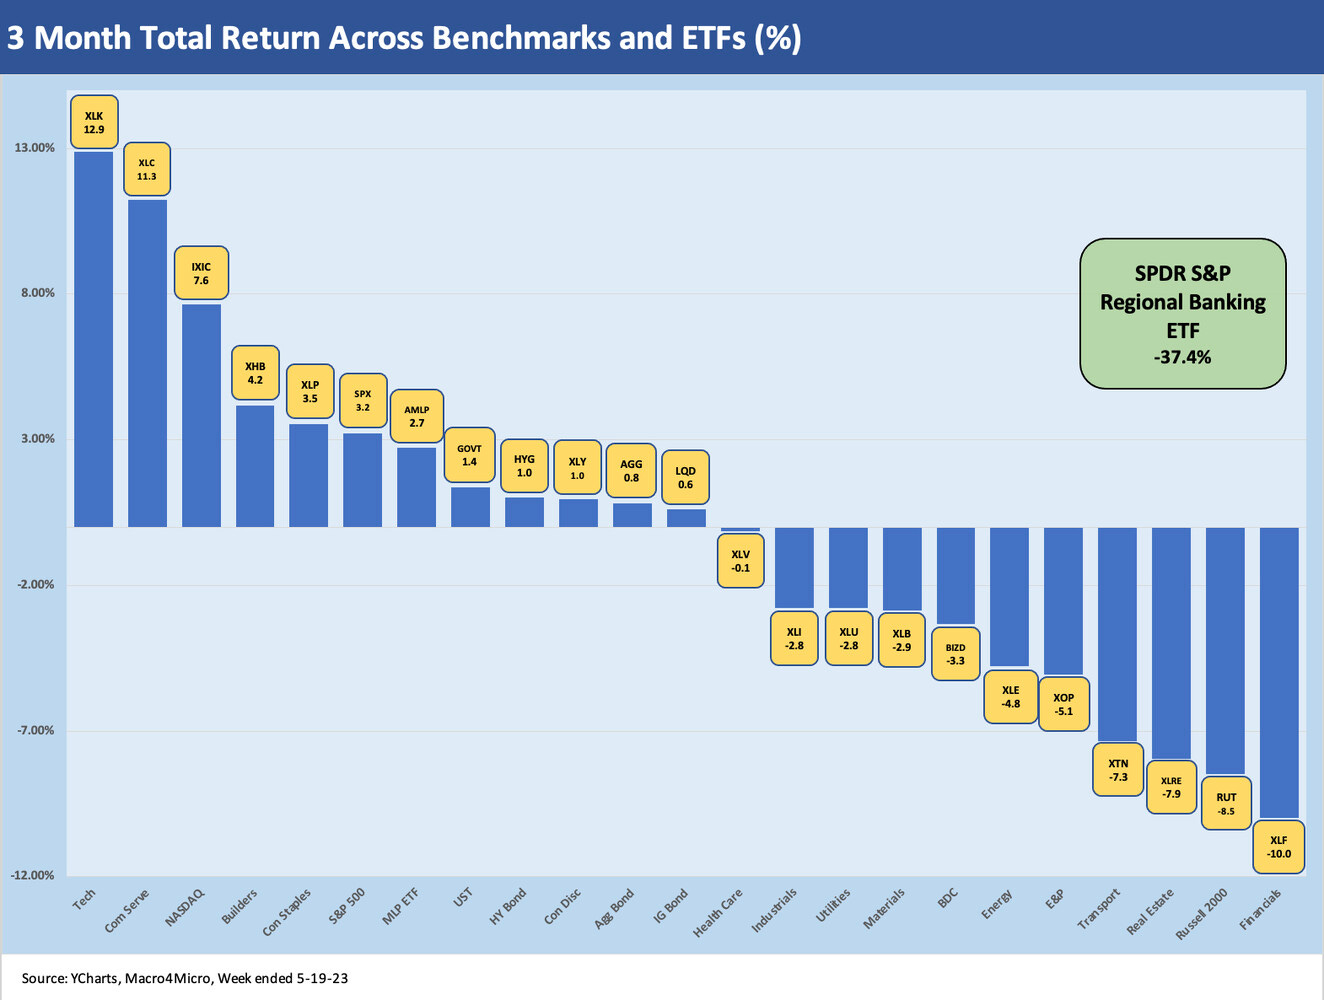
Below we look at total returns over the trailing 1-week, 1-month, and 3-month periods for 24 categories of industries, asset class proxies, and broader market benchmarks. That covers a wide range of industries and fixed income assets for perspective on the rolling time horizons.
1-week ETF returns
The past week saw some pain for duration-sensitive assets and industries vulnerable to interest rate increases. While the ebb and flow of debt ceiling headlines carried the weight of easy analysis for day-to-day headline market moves (“down on debt ceiling setbacks” or “up on debt ceiling optimism”), we saw some decent and differentiated performance across the mix.
We saw a big rally in the regional bank ETF this week in what has been a grab hat of negative and positive stretches that still leave KRE down 37% across the prior 3 months. The 1-week leaders also included AMLP (Midstream ETF) at #2 as the sector perked up with the ONEOK-Magellan merger (see Signals and Soundbites: Magellan Finds ONEOK 5-15-23). We also saw Tech and NASDAQ stay in the top group with a “worst shall be first rally” by the E&P sector with XOP, who has struggled over 1-month and 3-months.
The negative return performers for the week were dominated by the most interest rate sensitive ETFs. Utilities (XLU) and Real Estate (XLRE) were in the bottom two spots and the four bond proxies (LQD, GOVT, AGG, and HYG) all came in negative.
1-month ETF returns
The 1-month ETF returns show 9 positive and 15 in the negative zone over the period with a Hi-Lo return range of over 17 points with Communications Services (XLC) on the high end at 5.6% and Regional Banks (KRE) on the low end at -11.5%. If we toss out the Hi and Lo, we see a differential over 13 points framing Tech (XLK) vs. Energy (XLE). The Top 5 saw MLPs (AMLP) making a comeback and builders (XHB) holding in strong.
3-month ETF returns
The 3-month ETF period required that we isolate regional banks (KRE) in its own penalty box at -37.4% to avoid distorting the bar chart optics. We see 12 in positive and 12 in negative over a very tumultuous stretch that saw SVB spiral into a debate on contagion and the risks of the new world of push-button (point and click?) bank runs. If we isolate the KRE virus for the Hi-Lo math, we see almost a 23-point differential between Financials (XLF) on the bottom and Tech (XLK) on the high end.
The Top 5 is led by the TMT collection with Tech, Communications Services, and NASDAQ followed by Builders (XHB) and Consumer Staples (XLP). Builders offered a reminder on opportunities that the market punishes some sectors too much and too early in the game. The market underestimated the resilience of the builders.
The Bottom 5 is the financial twins – KRE and XLF – but we see small caps (Russell 2000) at three off the bottom with Real Estate (XLRE) and Transportation (XTN) just above it. XOP and XLE are just above the weakest performers. The midstream shows its differentiated fundamentals over on the left in positive territory as high dividend income and fee-based revenues gave the midstream operators a leg up in total return vs. upstream.
The yield curve still waiting for the title fight…
In the next series of charts, we run through the UST migration, yield curve slope, and the sharp moves of the past week that hit duration.
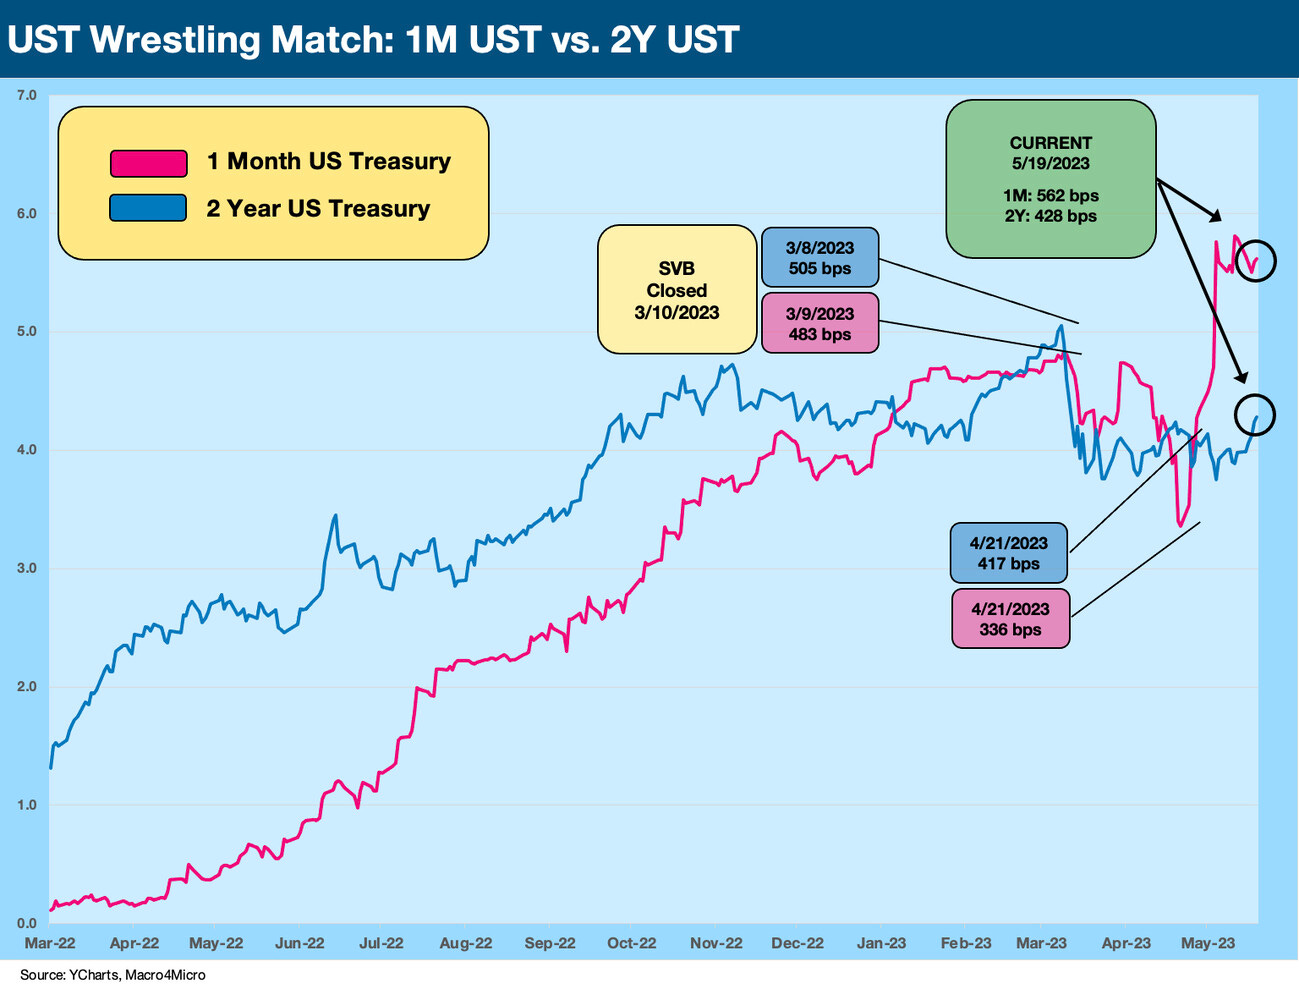
The above chart plots the 1M UST vs. the 2Y UST that we spent some time on last week (see Footnotes and Flashbacks: Week Ending May 12, 2023) since the 1M was getting whipsawed around by the debt ceiling “drop dead date” and the 2Y is the resident focal point these days for UST curve rate speculation. We saw a dip on the 1M and a sharp move higher in the 2Y UST since last week.
The above chart updates the inversion of the 1M to 2Y UST which headed north of 200 bps last week ahead of this week’s sharp move in the other direction. With the market less than 2 weeks from the UST’s “last call for cash” we see some shift in the 1M UST presumably on the grounds that the UST will not default and/or stay there for long. The 2Y UST is a trickier proposition. The theory is that a default in the short end still keeps demand high for quality vs. risk and that the UST curve could rally on that even if the front end stays high. This is not like a corporate bond with acceleration or cross default, etc. This is the proverbial default by billions of short-dated cuts.
The sharp rally of UST in 2011 is a very different situation since that was resolved quickly and no one (or almost no one) thought Boehner was gutless, dumb, or reckless. In other words, we are dipping into an all-new petri dish in 2023. The median brain power, conceptual grasp, and sheer meanness quotient is in another part of the evolutionary stages now.
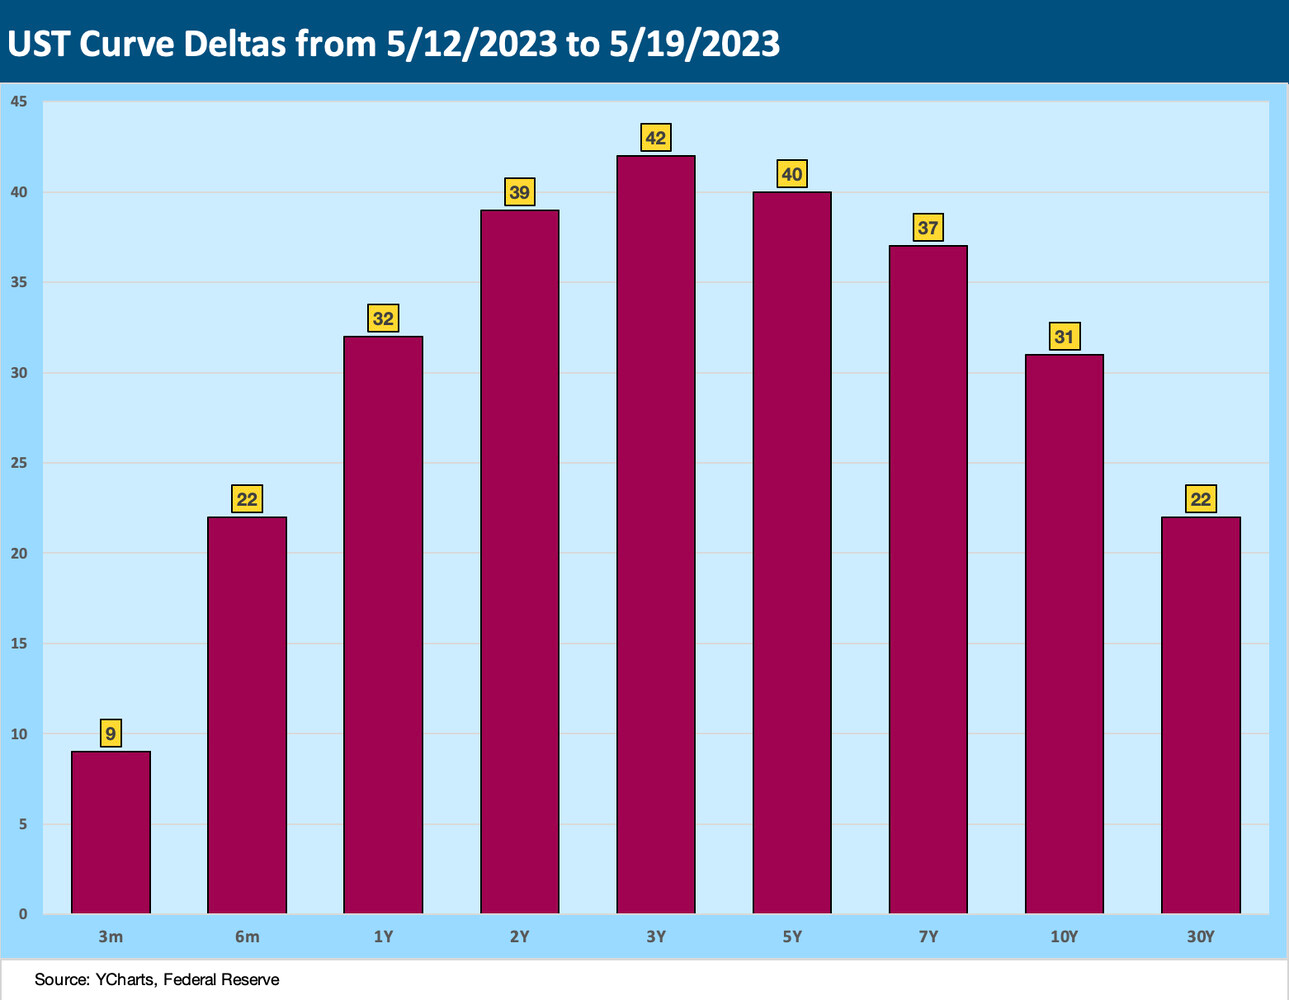
The above chart frames the upward move across the UST this past week. The 2Y to 7Y made a sharp move higher by recent standards. The 3M UST is more or less hanging around waiting. For 3Y to 30Y we saw some flattening.
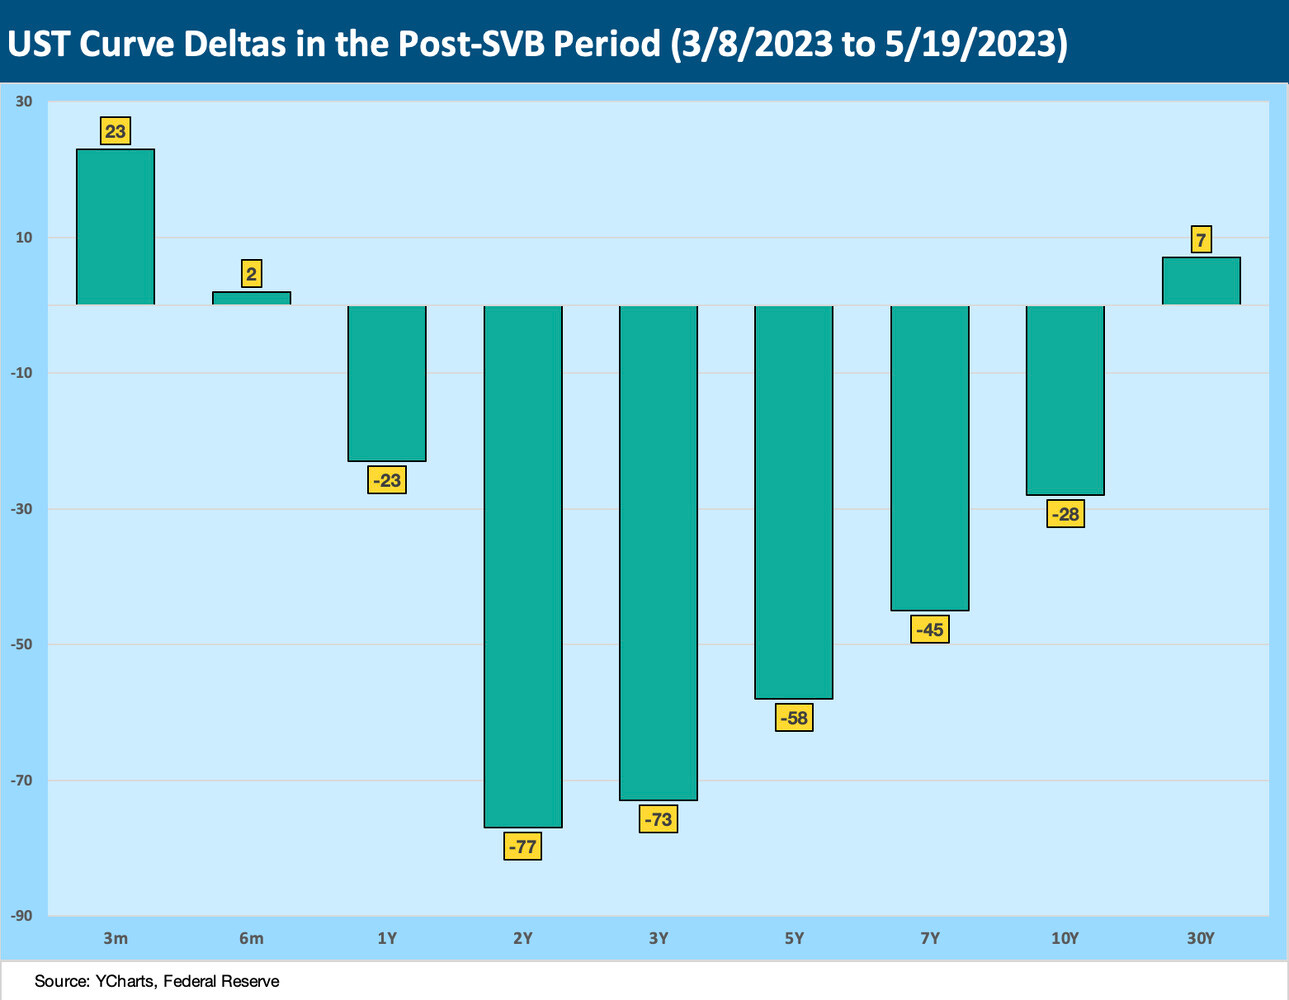
The above chart updates the moves in the UST curve since the day before SVB saw the deposit run explode on Thursday with SVB failing to open on Friday. This move constitutes a bull steepening from 2Y to 10Y but with the 30Y slightly higher.
One thing to wonder about will be what credit ratings unfold on the UST and agency paper or anything with an implied or explicit support from the US government. We remember a time when Freddie and Fannie were deemed UST surrogates. That was true later for high quality corporates as well when yields on UST evaporated. They don’t make surrogate role models like they used to. After the UST debt ceiling, everyone will have a government shutdown to look forward to in budget “talks.” US government tenant risk also just got worse.
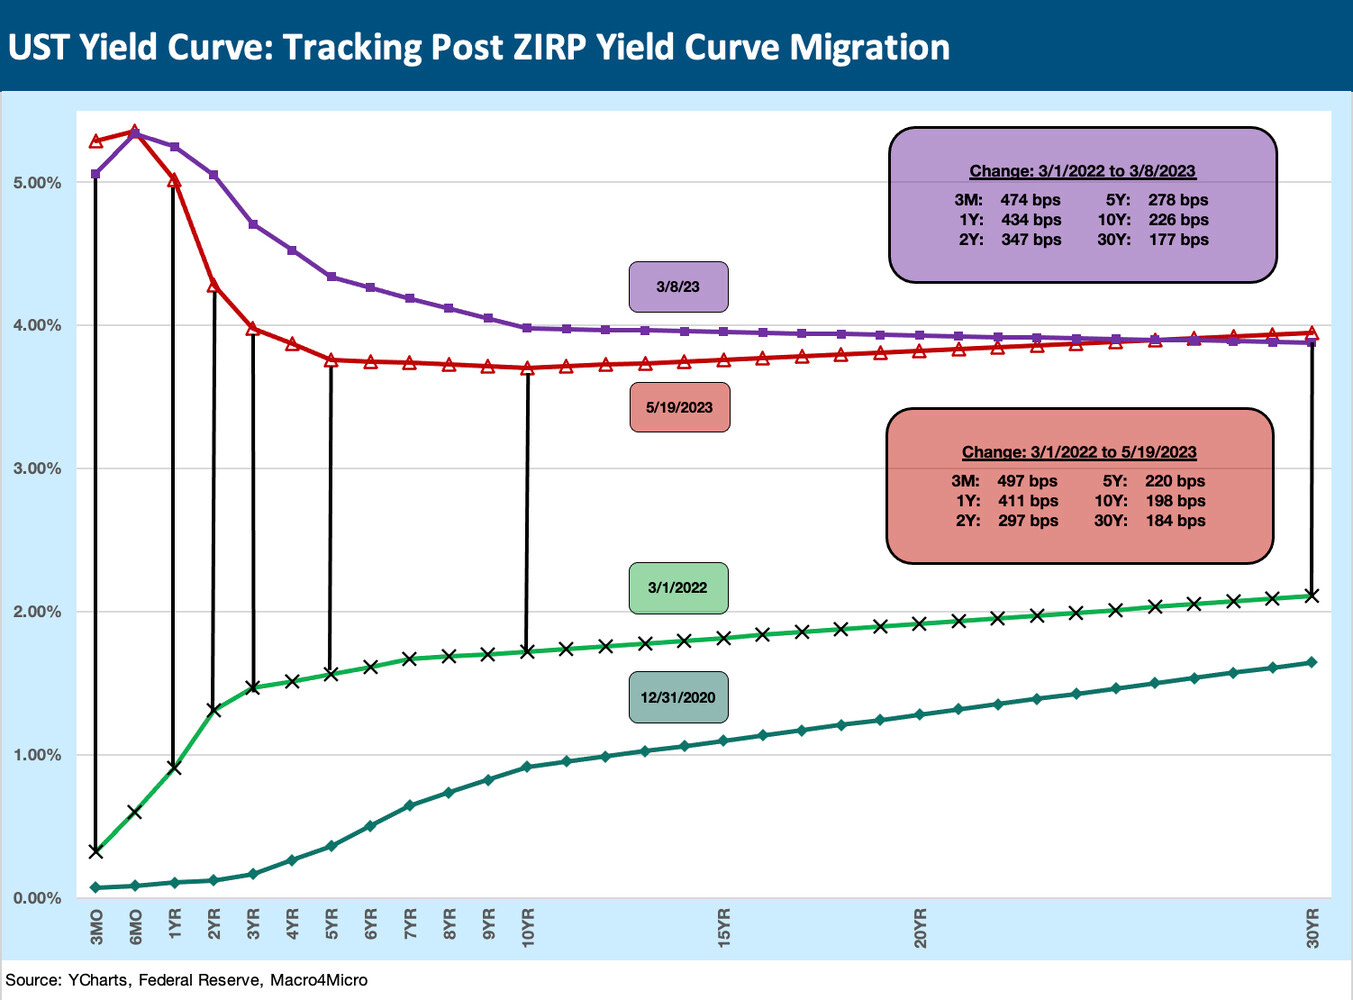
The above chart updates the running meter on how far the UST curve has moved since March 1, 2022, which was the start of the month when ZIRP ended (at mid-March). In the upper box, we also highlight what the UST move through March 8, 2023 was when SVB imploded. That offers another frame of reference on the UST migration and duration pain.
The above chart offers a different full yield curve visual on the shape of the curve before SVB failed and the UST move and reshaping through Friday close this past week.
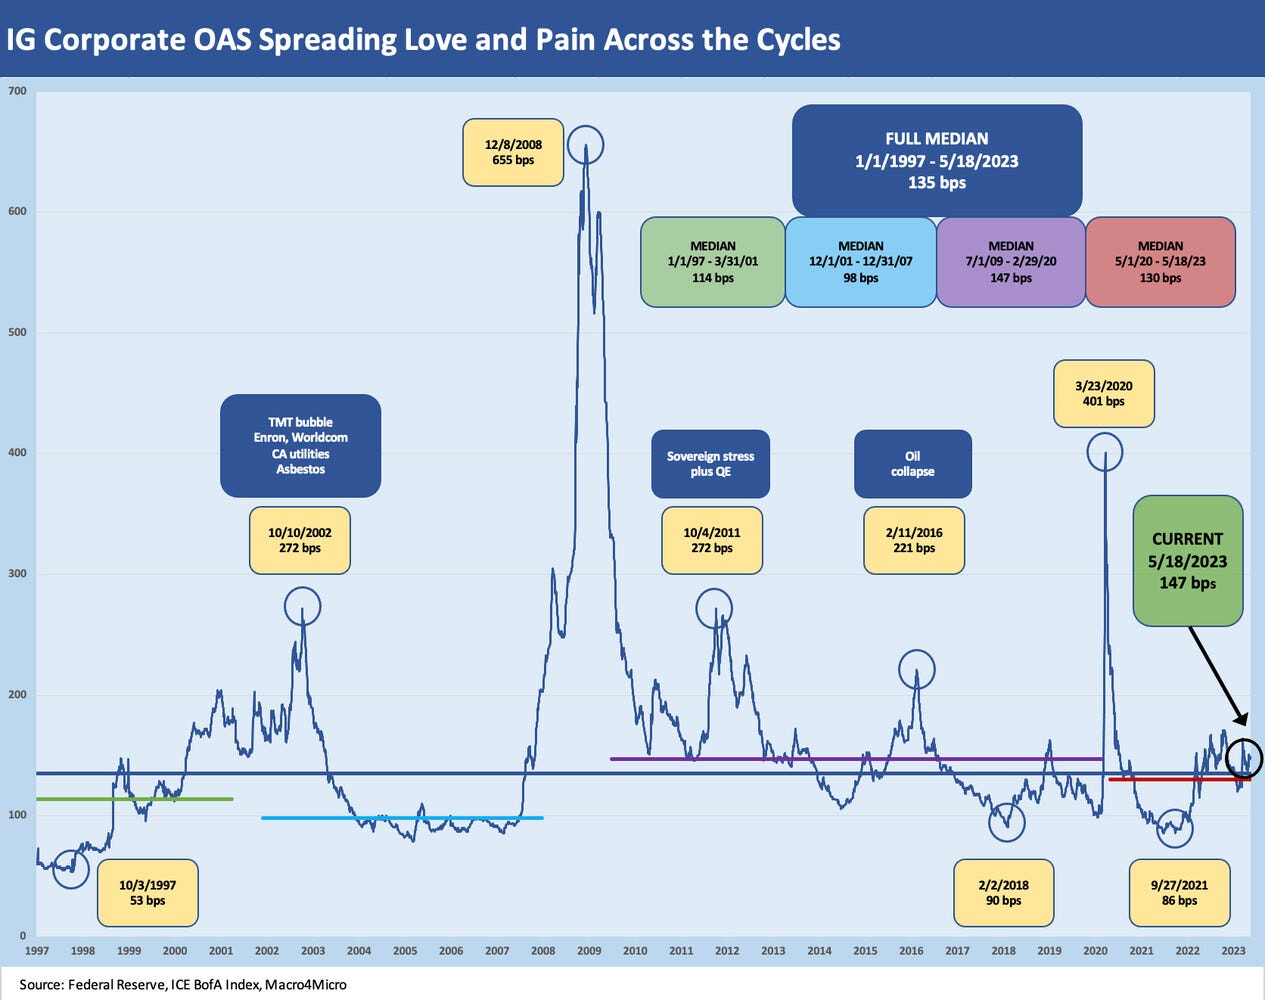
The above chart updates the state of IG index spreads across time through last week. We have looked at these histories in more detail in other commentaries (see Footnotes and Flashbacks: Week Ending April 23, 2023, IG Corporate Spreads: Tough Pathway, A Few Doors Ahead 3-19-23). The easy takeaway is that the long-term median for US IG OAS is around +135 bps vs. the current +147 bps. From July 2009 (recession ended June 2009) through March 2020 (COVID arrives), the median IG OAS was +147 bps.
We always get back to a simple question: Is this a median risk market? We would say that this is a riskier market cyclically and in terms of shifting mix in major sectors such as financials. When framing that +147 bps OAS, that is a lower risk premium in proportionate terms vs. the risk-free asset (UST) than during the post-crisis years with ZIRP and low absolute UST rates. We admit we pause a little on the use of the term “risk free asset” around this time in debt ceiling dynamics, but it still works (close enough for government work?).
We see the big swings off the low IG OAS levels in prior cycles. The question is what triggers the repricing and when? Credit contraction after SVB was on the plate as was steady wear and tear from higher rates, higher energy costs (though much more manageable now), and weaker consumer credit quality from household leveraging. There is a laundry list of factors there to debate.
For now, the debt ceiling crisis would reprice US HY and the quality spreads differential attack would come from below via the BBB to BB differential as HY OAS widening would start to infect IG spreads at a time banks are also feeling some heat.
The above chart updates the US HY index OAS chart with the current +469 bps inside the long-term median of +475 bps. This market is not a median risk market either. Across the expanse of history, we need to consider the favorable mix shift in credit tier mix with the BB tier almost half the index. We have discussed these issues in previous comments (see Footnotes and Flashbacks: Week Ending April 30, 2023, US HY Spread Histories: Weird Science, New Parts 3-19-23, Spreads Across Tiers: Decompression + Volatility 3-18-23). We see the HY market as overdue for widening as 2023 continues. That has been our expectation for a while as we covered in the fall.
Overall, the credit cycle is in decent shape as of now with a lot of room to see some rise in defaults while still staying below average. The valuation from a risk premium perspective (spreads) is questionable, however, and the symmetry unfavorable. The run rate in the cycle and earnings season color has been constructive, but the moving parts and handicapping are not going so well with the high jinks and low jinks of the brain trust in Washington.
MICRO
Last week saw a major midstream M&A deal when ONEOK and Magellan agreed to a merger that caught some headlines and some grief on the equity side for ONEOK (see Signals and Soundbites: Magellan Finds ONEOK 5-15-23). We expect this sector will be one with more “events” in 2023 as more names seek growth opportunities via M&A or seek to deploy cash flow in ways that will raise the hopes of shareholders for better strategic positioning ahead.
With LNG expected to be a major focal point and the barriers to expansion possibly coming down on project approvals, the competitive strategies will get debated across names with an eye on policy changes a key ingredient. There will be a lot of discussion on energy sector dynamics in an election year, and this sector is still seen as somewhat fragmented and ripe for more action of the sort seen this past week.
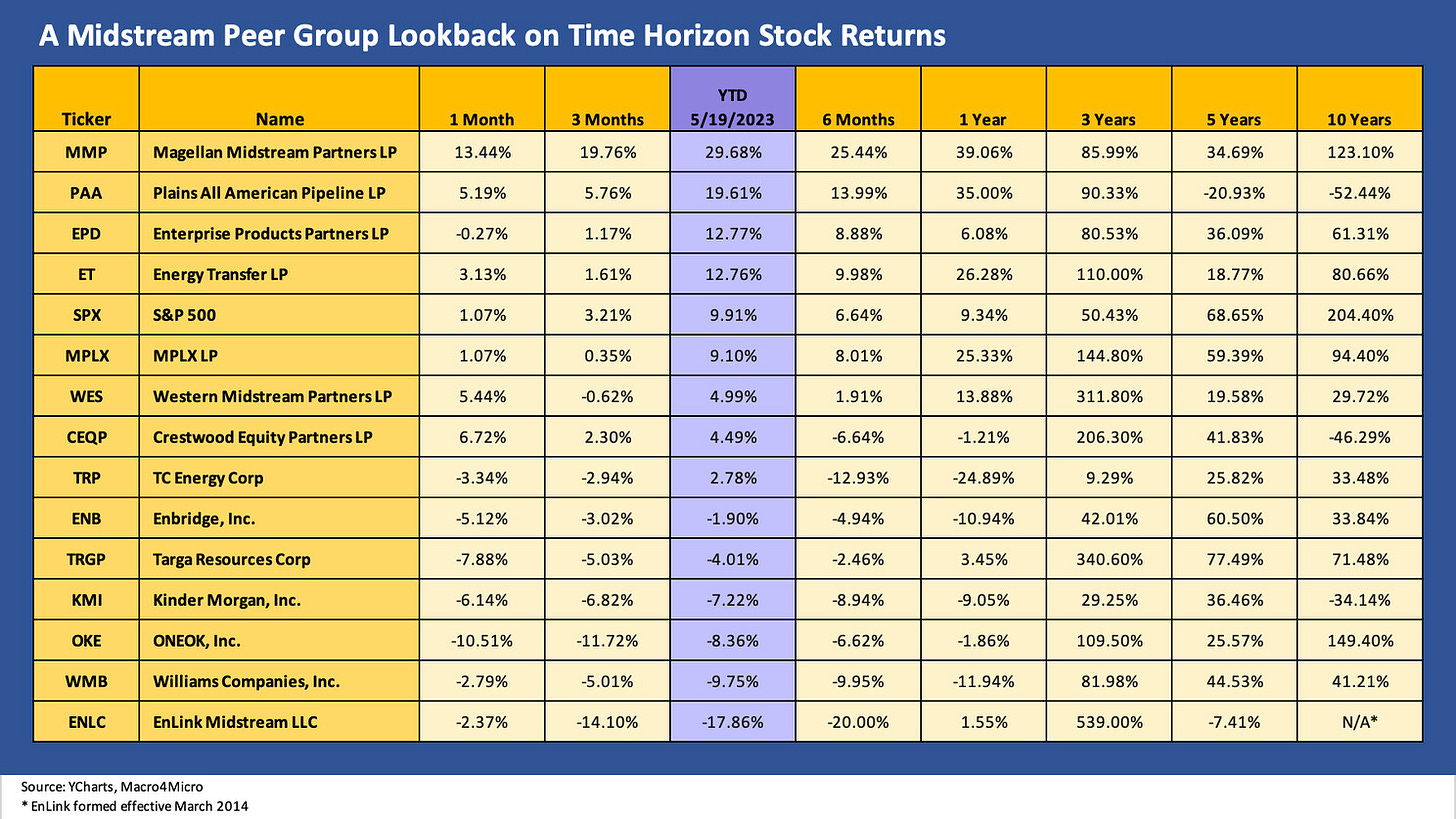
The running total returns across the midstream equities are detailed in the above chart. We add some more names than we included in the earlier commentary this week. We line them up in descending order of YTD total returns. We see quite a range in the returns with a Hi-Lo range of around 48 points. Selection counts and pays.
The midstream names comprise a very popular subsector for those with income stock portfolios, and we played in a healthy share of the mix and actively managed the equity exposure before downsizing that mix opportunistically in 2022 and early 2023. We have not traded any lately and do not intend to until the smoke clears on all the debt ceiling noise. We liked the sector fundamentally, and it is a lot easier to get comfortable with the income safety factor than the game plan for some names to grow and inspire the stock market with respect to multiples.
Evaluating the free cash flow dynamics of the names is a first cousin of credit analysis and more in our comfort zone than handicapping which basin and subbasin priority will set the agenda for each midstream operators based on their current asset profile. The question of which shift in product and service mix will serve the stock valuations best is a question we have to look at whenever we frame an issuer, and the ONEOK-MMP deal left many wondering about synergies when the move was in substance a major diversification play.
We try to frame those strategic and competitive nuances when we look at the names, but figuring out credit quality is more straightforward in most situations. A major reignition of a fresh round of heavy growth capex in this sector does not appear as likely as more realignment of ownership, more roll-ups and more bolt-ons if private equity players start cashing out of some of their holdings. There is an ample mix of newer names smaller in scale, so those wanting more scale are likely to be out hunting. Those are topics to explore on other days. The return rankings above show some will need to play from behind and start a comeback.
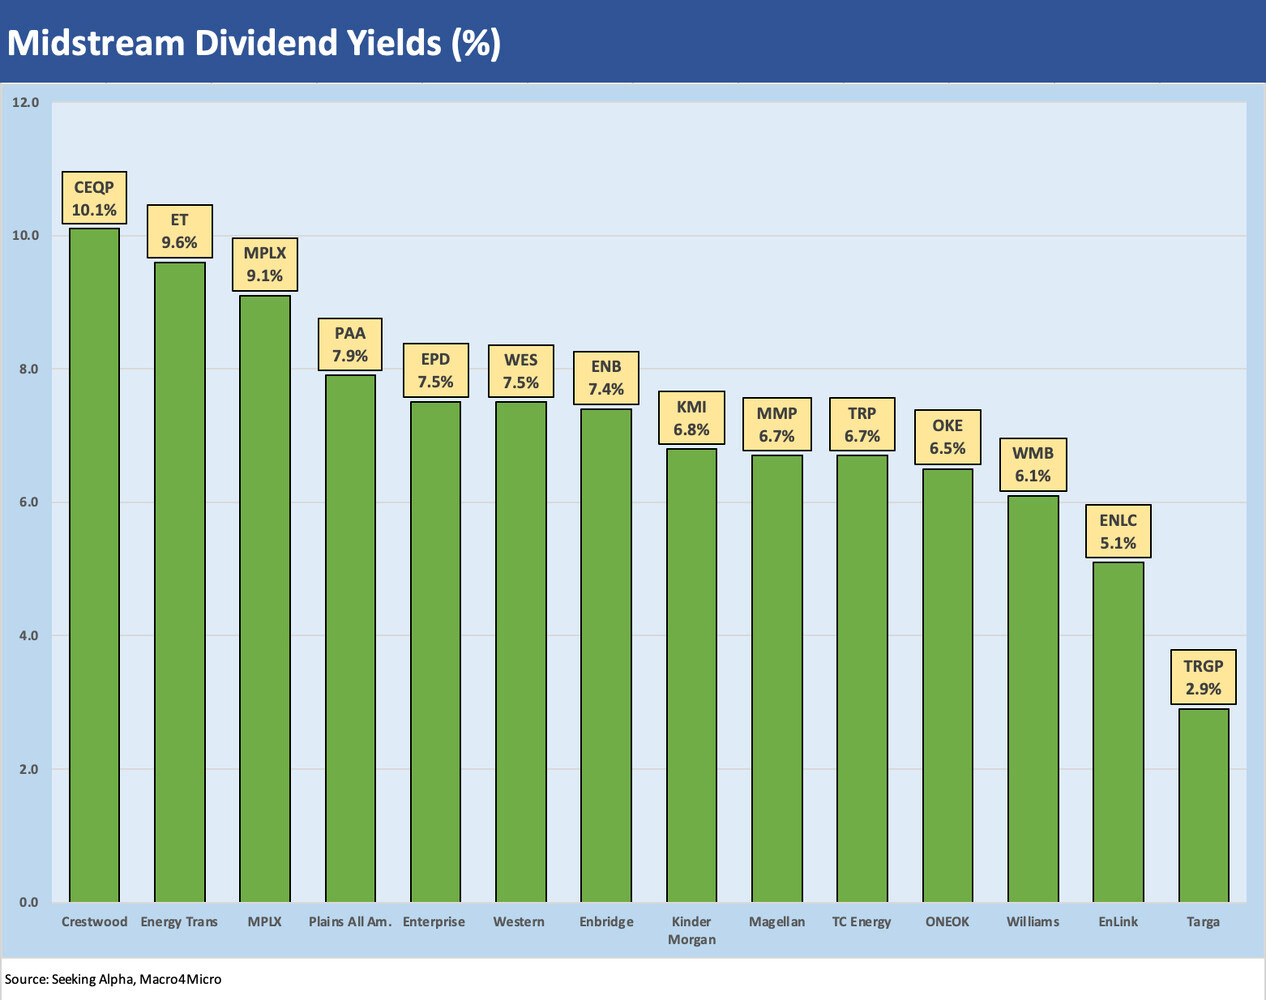
The chart above details the dividend yields across this mix of MLPs and C-Corps as a frame of reference for those who might be looking at bond yields. It is just food for thought with no intent to make a stock recommendation at all. The tax position of the portfolio, the MLP vs. C-Corp nuances and the relative risk of each is an analysis each investor must handle. I looked at these names when ZIRP was still part of the consideration and income was hard to find. The yields on these names run the gamut, but for 2H23 and into 2024 the strategic twist that can drive stock value will get more important than they were in 2021-2022. There is a very solid base of free cash flow as a starting point. There is a wider range of alternative yields in the market, so this time around the selection is off a bigger menu.






A Reynolds Masterpiece for certain. Often need to watch late night TV for such cynicism. Keep going Glenn.
Balls and strikes! Just the facts...After a few trips to Washington in the financial crisis period, I kept thinking of the Silkwood hazmat scene. It never gets better it seems. Quite the opposite.