Footnotes and Flashbacks: Week Ending May 12, 2023
The search for some sanity in Washington just moved ahead of the Fountain of Youth on the fruitless hope list.
“Now, THAT’s an inversion.”
This Week’s Macro: The debt ceiling default risk effect on the front end of the UST curve; Asset class benchmark returns; ETF sector returns 1-week, 1-month, and 3-months; Yield trends in the 1M vs. 3M UST yield relationship with the 1M vs. 2Y UST inversion at a high; UST curve migration post-SVP and post-ZIRP; The strange politics of default with too many separate games being played in this game theory exercise.
This Weeks’s Micro: We update the relative stock returns in the world of oil sands and frame the Big 2; Canadian Natural keeps winning, but Suncor pushes to get back in contention.
MACRO
The price action in the 1-month UST is telling a story that raises a lot of questions of where the debt ceiling dynamics go from here. In this weekly, we look at some of what the yield curve is doing and update our usual asset class returns. We also list some questions to ponder as we move into a time that may be discussed for decades to come in economics classes, business schools, and law schools (and not in a good way).
There are so many aspects to frame across market technicals, fundamental risks, longer term UST sovereign credit ratings, political power rivalries, and basic human nature. The situation is not helped by the weak conceptual grasp and limited factual framework (or lack of) being used by the players in the decision-making roles. Sometimes these players seem like especially poor students of Machiavelli. Other times, they seem like the students on the economics short bus. The strategy has been “talk loud, don’t listen, insult regularly, and foment as much division as possible.” We left one out: “and fund raise.” That does not bode well.
The handicapping has a few side bets going beyond whether the UST will default (we say likely). There is the question of using the 14th Amendment strategy even if just out of sheer necessity (also seems likely on the way to default). Another possibility being debated is the formation of splinter groups where some in the GOP break ranks. That would take courage and risk potential loss of power or committee seats (in other words, unlikely). Another question is how long a default might last. There is also what the credit rating agencies will do. There are more outcomes beyond that to handicap, but those are the main events.
This is a chart you will not see too often as we plot the recent moves in the 1M UST yield vs. 3M UST yield. We detail it in basis points from late Friday pricing. Given the timeline fears around a 1M UST being a two-month maturity (or more) to get it paid back (on a default that is), the yield dislocation is explainable but also extraordinary.
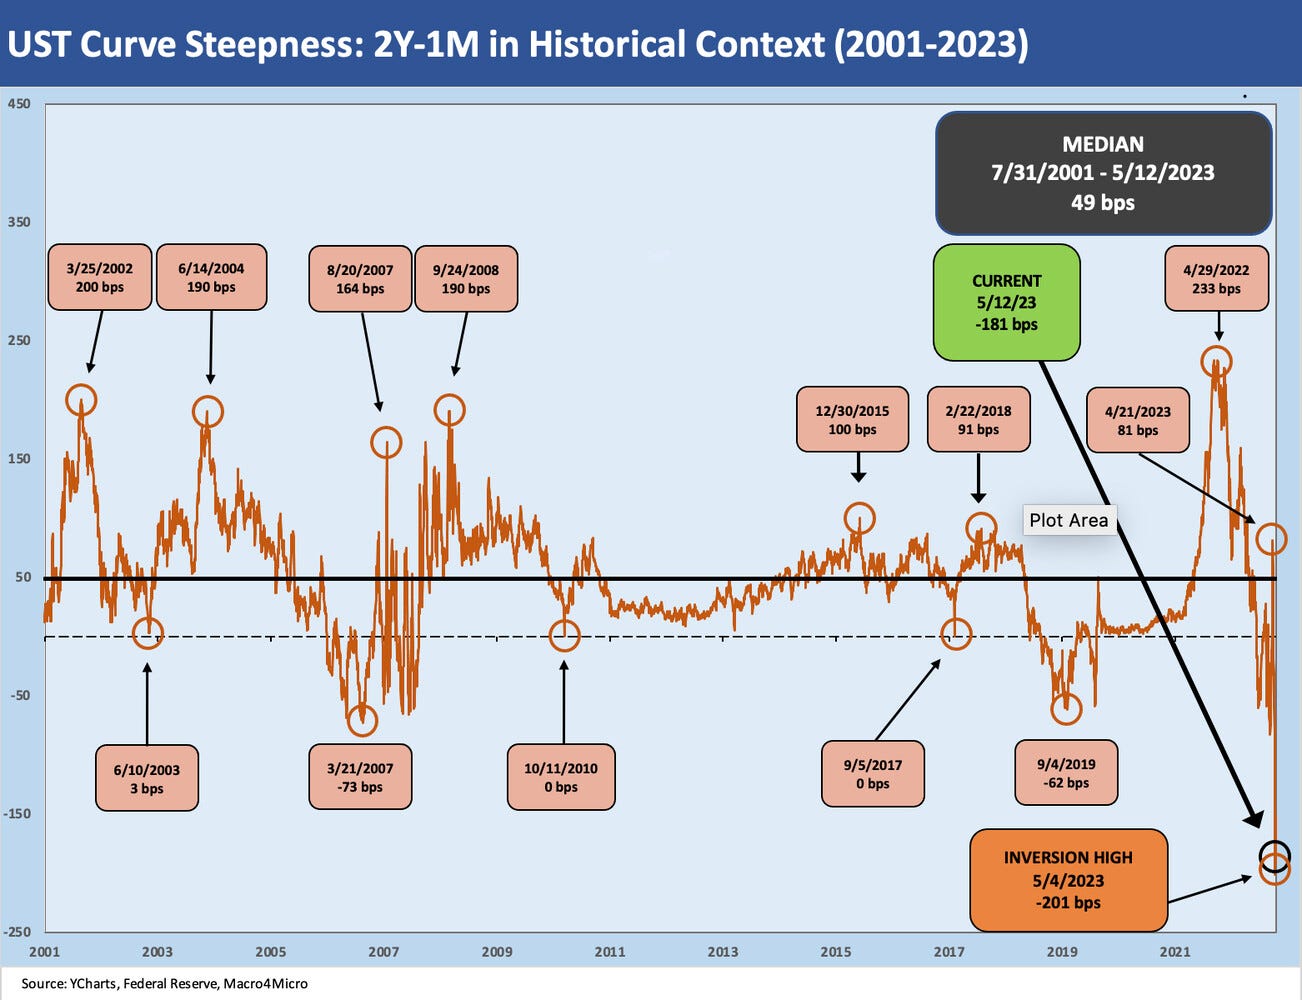
The 1M UST vs. 2Y UST relationship is another outlier from history. The 2Y UST has become one of the main focal points for markets during times of rapid monetary policy adjustments but especially in recent months with the continuing uncertainty around inflation, recession risk, and the perception of the shaky foundations of the regional banks. The disconnect between the 1M and 2Y is striking at a time when the fed funds target rate of 5.25% for upper bound is increasingly being seen as stable (but hardly assured).
The resulting inversion of the 2Y UST vs. the 1M UST crossed 200 bps in early May, and that is more than triple the level in March around the 1-year anniversary of the end of ZIRP. The inversion from short paper in the UST makes for an unusual cash allocation decision. Do you take the risks of turmoil and buy the shortest maturities for cash or leave it in money market funds where the threats of redemption waves might end up as a short-term worry.
The flight to higher yielding UST money market funds (“MMFs”) now has to consider that a lot of short-term treasuries could end up in default. Bill Gross was on the screen saying buy the highest yield short paper. The theory is that the UST will not default, or it will not default for long.
As a disclosure item, I have some laddered UST holdings maturing each month through Sept, and I am not doing anything other than a John Lennon on the topic (“I'm just sitting here watching the wheels go round and round…”). If the UST defaults, I like my chances for a par recovery in a very short time frame. In contrast to UST, a few weeks of defaults will set off market panics in many asset classes and other mutual funds could see some serious redemption-driven dislocations. That could create some material price dislocations to buy into.
The idea of having “maturity transformation risk” in a short term UST government fund is strange enough, but redemption-related volatility in pricing for many other asset classes with less liquidity is another matter. If a default goes on much longer, we would see forced selling of securities to raise liquidity. The more illiquid the securities (or loans), the worse the impact would be. ETFs would see some whipsaws in more off-the-run names and structures.
Another wildcard is the much-discussed 14th Amendment Constitutional gambit on ignoring the debt limit. That topic has been held up to the light since Obama was rumored to have that in his back pocket in 2011 and 2013. Some say it will succeed, and some say it will fail. That potential action got a lot more attention again from Laurence Tribe in a recent OpEd in the NY Times. The Harvard Law Professor has become the John Houseman of Zoom during the pandemic. He weighed in recently that Biden would almost have no other choice but to do his constitutional duty and use this provision for refinancing and borrowing to avoid default.
The rationale makes sense even if the Supreme Court often does not. The Constitution basically says that “default is unconstitutional.” It also says the People’s House (despite so many very strange people in that House) runs the budget. The White House does not run the budget. However, this is not a budget vote. It is paying for the budget the House already approved. That is my simple version of what I have read on it over the debt ceiling brinkmanship years, but that would be for the guys from the hallowed halls of tweed to debate in front of the black robes. It will be interesting to see who sues the Treasury to default. Their Moms would be so proud. Unless their moms are on Social Security.
For a little longer timeline history on the 1M to 2Y UST relationship, we look back at the cycles from the start of the post-TMT expansion in 2001 through this past week. Nothing comes close in terms of the current inversion. The March 2007 inversion did not end well with the subprime and structured credit markets ticking and with counterparty and systemic leverage at frightening levels. The counterparty theoretical credit lines and actual exposure was opaque, many were essentially undisclosed, and many were poorly/inaccurately measured.
The Sept 2019 inversion did not end well either, but that ending comes with the asterisk of the March 2020 COVID shutdown. As a reminder, the Fed was easing in the second half of 2019 as the economy was stuttering. That period saw Fed cuts of 25 bps at the end of July, in August, and at the end of Oct 2019. As Year 3 of the single Trump term, 2019 would mark the third straight year where GDP growth on an annual basis could not get above a 2% handle for the full year. That matched the performance of Trump’s predecessor over his two terms.
The 2019 Fed cuts and stalled growth came in what the former President dubbed in the recent CNN Town Hall the past week as the “greatest economy in the history of our country, probably the greatest economy in the history of the world.” Trump is clearly a master of statistics.
Comparative Asset Returns…
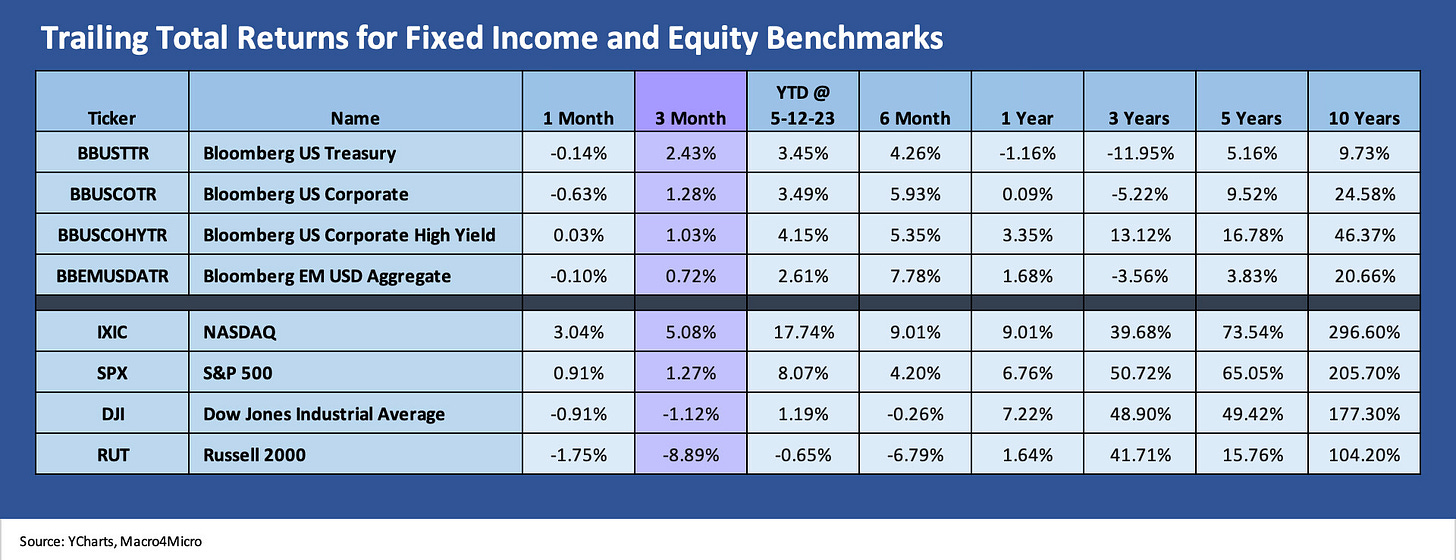
The above chart frames the main debt and equity benchmarks we track, and we line them up in descending order of 3-month returns for debt and for equity. For the trailing 3 months, duration has been the winner as the UST curve shifted down (detailed in our UST charts each week). The UST returns at 2.43% for the 3 month period is almost double the #2 asset class in IG corporates.
The results underscores what an underwhelming trailing month it has been in debt and equities alike as the market wrestled with the balancing act of debt ceiling fears, another Fed hike, a disruptive period in the aftermath of the regional bank turmoil where credit contraction shows up in so many commentaries. We see 3 of 4 debt asset classes negative for the month and US HY barely positive.
In equities, tech benchmarks still carry the day over recent trailing periods with small caps (Russell 2000) on the bottom. The YTD numbers weigh in well with both the NASDAQ and S&P 500, which is still riding a very strong January 2023.
The above chart covers the “1500 and 3000 series” and highlights the lack of market breadth. The pattern has been consistent with 5 of 6 benchmarks negative over the trailing 1 month and 3 months. Energy has been beaten down in 2023 and the same for financials but some of the worst of the price action eased this past month for financials after an abysmal March into April for regional banks. Growth stocks are still materially outperforming value.
ETF and benchmark index returns…
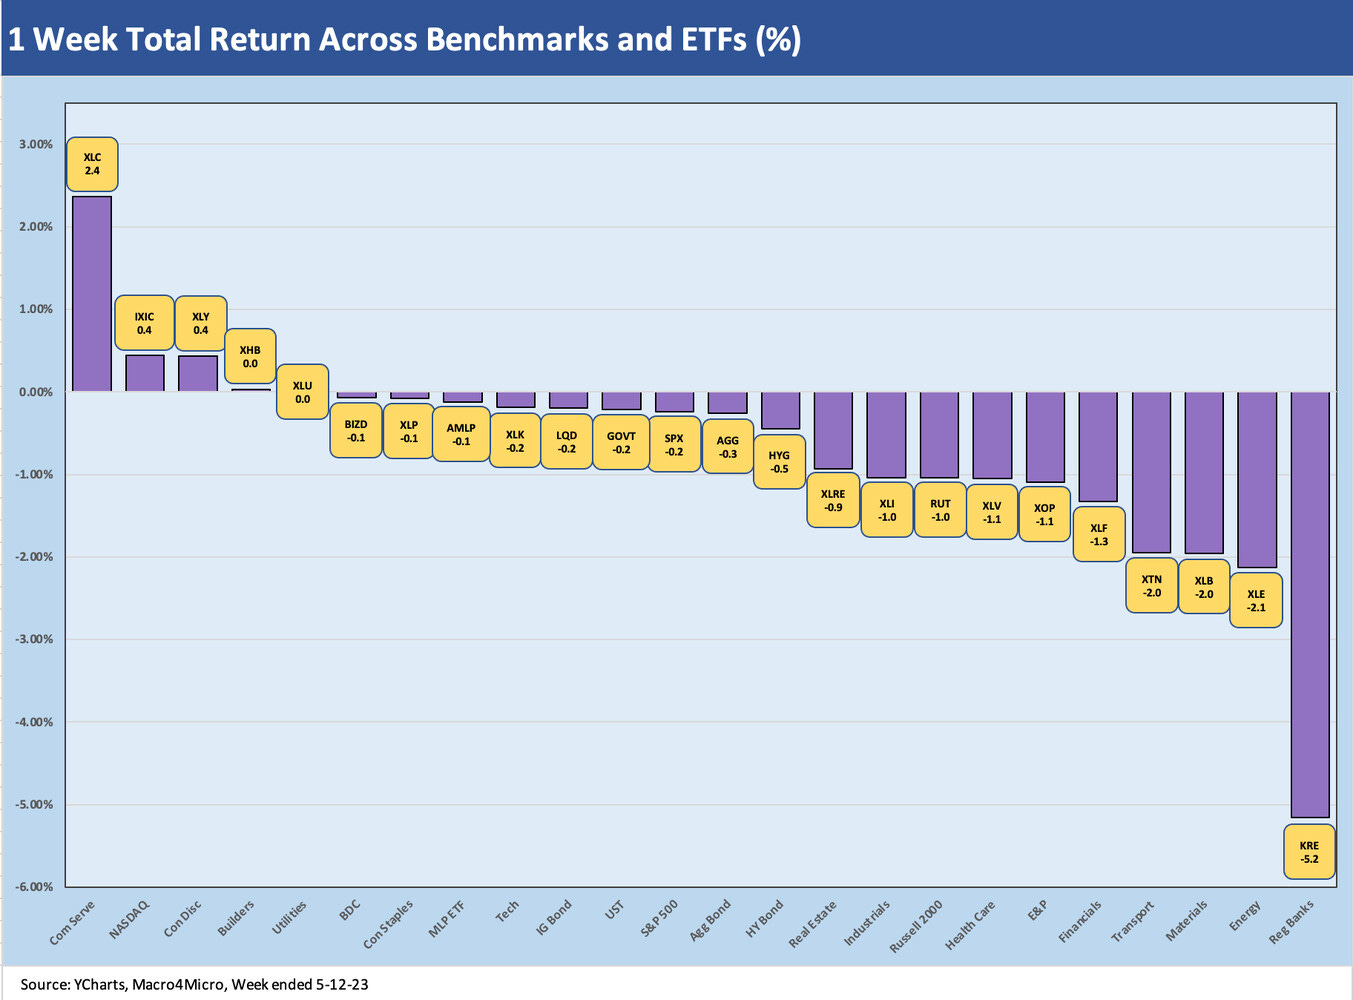
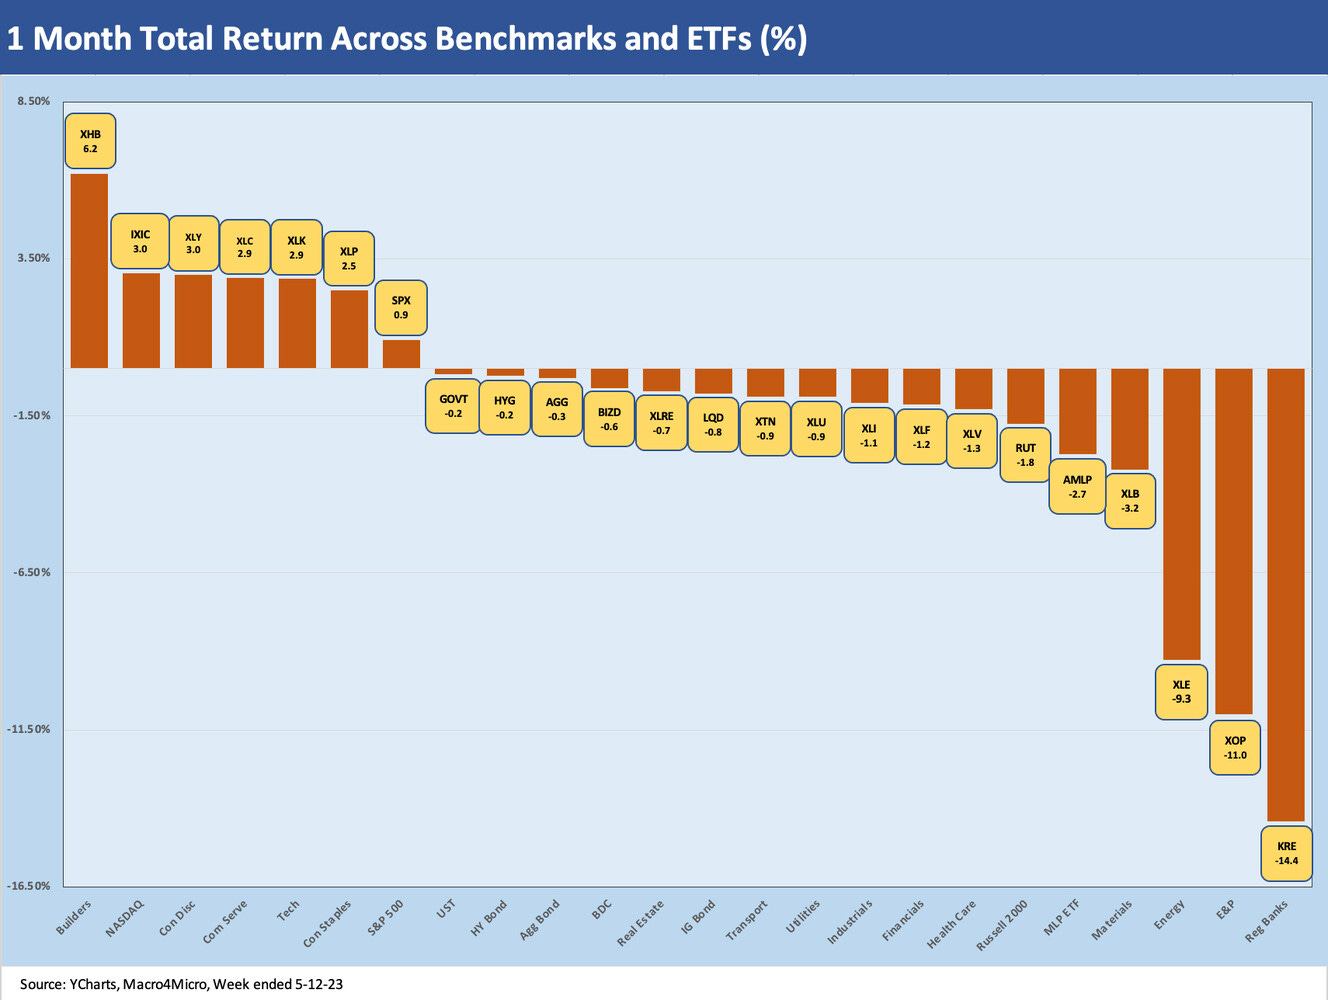
In the next three charts, we post trailing total returns on a cross-section of ETFs serving as asset class and industry proxies and also the usual major equity benchmarks. This week we added a 1-week time horizon to our usual 1-month and 3-month charts. We use 24 ETFs and market indexes.
1-week ETF returns…
The past week saw only 3 of 24 ETFs and benchmarks in positive territory with two more rounding to 0%. Only Communications Services (XLC) was able to get above +0.5% with its 2.4% performance. Well over on the right, we see Regional Banks (KRE) get another beatdown at -5.2%. Regionals are now getting more focus on asset quality risks (notably Commercial Real Estate) beyond the deposit flight fears that have plagued them since SVB.
We have been trying to make some of the real estate mix and property type issues more transparent in some of our recent commentaries (see Fixed Investment: Some Structure and Equipment Layers 5-12-23, Construction Spending: Demystifying Nonresidential Mix 5-9-23). Once an asset class (e.g., Offices) gets tagged as heading for a protracted down cycle, it is tough to shake. The reality is that such asset classes have a wide range of fundamentals across location, rental rates, tenant risk, and property type, and loan rates on the financing side.
Whether it be legacy A, B, or C office buildings or new buildings and more current projects with attractive economics and properly priced risks, the commercial real estate business is highly complex. How the regulators approach the real estate concentration risk issues will be an interesting one to watch from the outside. The same is true with the SEC in terms of any revised disclosure demands in filings and offering materials. The selectivity priorities will be very high in the times ahead with regional and smaller banks getting rattled in 2023.
1-month ETF returns…
For 1-month returns, we see 7 of the 24 in positive territory with homebuilding companies (XHB) at the top. We see 3 of the Top 5 are more tech and media centric areas with the NASDAQ at #2, Communications Services (XLC) at #4, and the Tech ETF (XLK) at #5. Even Consumer Discretionary comes with a bit of an asterisk with Amazon as the largest holding and together with Tesla at over 1/3 of that ETF at last check. AMZN had a good 1-month run.
On the tight side among the losers for the month, we see Regional Banks on the bottom at -14.4% with 3 of the worst 5 in Energy with XOP, XLE and AMLP. XOP at -11.0% continues a bad streak with WTI around $70 per bbl and natural gas down around $2.27 to end the week. A UST debt default would not support oil forecasts.
3-month ETF returns…
The yield curve faces a wide range of potential outcomes…
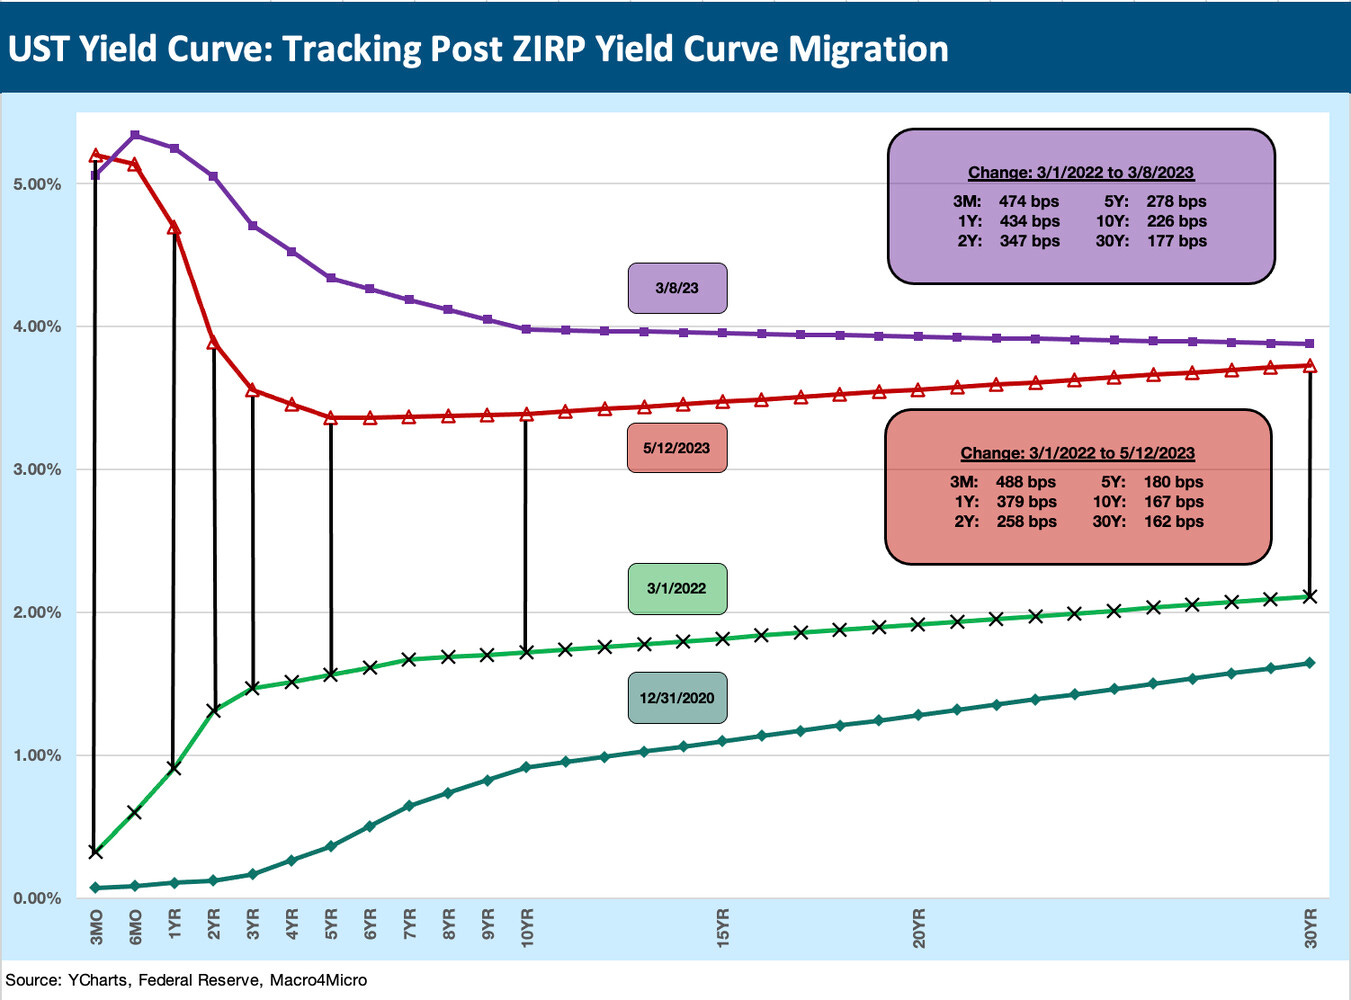
Below we update the migration patterns of the UST curve across this very eventful period from March 2022 to the past week. The period marked the highest inflation and most rapid tightening since the Volker inflation fighting years although we are quick to point out that the 1979-1981 period was a much scarier and uncertain House of Pain than what we have seen in monetary policy of late. The monetary policy of the Volcker years was a world apart, but what is transpiring in Congress with the debt ceiling is in a different universe of risk in its own right with default the end game.
Earlier in this commentary, we already looked at the aberration in the 1M UST on connection with debt default risks. The above chart updates our running migration of the UST curve from March 2022 (the month ZIRP ended) through the current UST curve. We also time stamped the March 8, 2023 UST curve as the day before SVB started its spiral and failed to open on March 10, 2023 when it was seized by the regulators. The movement along the UST curve from 3M to 30Y was relatively muted this past week even if the 1M UST was going through its gyrations.
The above chart updates the running movement of the UST curve from 3-8-23 through Friday close for the post-SVB price action. The 2Y is -116 bps lower while the 10Y is -59 bps lower and the 30Y -15 bps lower. That goes in the category of bull steepener with low rates moving lower more quickly than long rates from 2Y to 30Y.
TOPICS AND QUESTIONS TO PONDER ON DEFAULT RISK…
In the end, is this just a big exercise in game theory and hardball negotiations?
We would all like to think so, but that is where the subjective aspects of motives, intent, priorities, and willingness of parties to compromise get called into question. Game theory implies everyone is playing the same game. A basic question could be “Do you think there are some parties in the House that want to see a default?” For many observers, the answer to that question is likely “Yes!”
If the excessive demands cannot be met, then the deck is stacked, and default is coming unless some collection of House members defect and cut their own deal. There are GOP members in districts carried by Biden. That takes a level of political courage that does not seem to exist. The fact that former President Trump recommended default in the CNN town meeting (“You might as well do it now because you’ll have to do it later.”) could embolden the more extreme elements of the party.
In the event of default, will the UST curve move materially higher or lower?
The last major sovereign panic was in summer of 2011 into the early fall. The UST market rallied impressively after the default threat passed. That market was set against the backdrop of the Eurozone sovereign panic, and despite the UST downgrade, the markets needed a deep and liquid risk-free asset class in a currency that was also deep and liquid. That meant UST. The Eurozone sovereign panic bouts really did not end until the summer of 2012 after the famous Draghi “Whatever it takes” moment. That sent bank securities rallying dramatically on low systemic fear. Meanwhile, US HY credit was all about “risk-on” from there through mid-2014.
One theory is that the market sells off (especially on the front end), the inversion steepens, but then the issue gets settled and the UST goes back to being the largest and most liquid “no longer risk-free market” (but close enough for government funding). The disaster will be averted until the next one, and then the curve will start rallying since enough damage will have been done to drive more risk aversion for consumers and lenders and those pondering capital investment. In other words, the recession risk will stay a factor and the debt ceiling hangover will last until the next election and budget war. Confidence will be shot.
Another theory is that a default will start to finally break the will of more investors including China and Japan. The UST credit rating will see multiple downgrades, and more central banks will keep thinking “buy gold, not the dollar.” That could signal higher rates. Countries will start to look harder at replacing the dollar in more commodities and coordinate globally with support from China as the key driver of commodities demand. Trump will tell us he can talk them out of it in 24 hours. Right after Russia and Ukraine. So that is 48 hours total.
What about the dollar?
Currencies are outside our wheelhouse, but the high interest rates in the US and relatively strong economy (before a default) leaves a lot of moving parts to react to once the debt ceiling topic is renewed. A massive base of UST selling is not going to help if that unfolds. A strong dollar in theory would be toast, and then the inflation debate kicks in on imports and supplier chains.
The euro was supposed to be the alternative currency to take share away from the dollar, but the 2010-2012 chaos derailed that idea, and the largest war in Europe since WWII still calls that into question. The actions of Russia, China, the Saudis, etc. on currency coordination are getting a lot of press, but that “collection” of disparate interests has too many asterisks on them. Those issues are for some other time.
Shifting currency flows and capital controls are a journey unto themselves back to the early 1970s with Nixon (Bretton Woods, etc.), the Plaza Accord of 1985, the European currency crisis of 1992, and the formation of the eurozone in 1999. That is a lot of crosscurrents that clearly say, “changing currency regimes is a lot harder than it looks.” You would need to jam thousands of economists into Giants stadium and then exhume a few thousand more to sort out those policy correlation factors and what it means for trade and growth.
What is different now than in the 2011 default scare?
This time around the situation in the US is far riskier. The similarity to 2011 is a Democratic President and Democratic Senate Majority leader with a GOP House speaker. The subjective side of it is that Kevin McCarthy is not in the same league (or close) as John Boehner in many areas including credibility and political courage to name two starkly obvious ones.
The Speaker voting process for McCarthy’s election was there for market participants, credit rating agencies, and international investors (including the two largest holders as in Japan and China) to see. It was not reassuring, especially as to which players were front and center in setting the agenda in the House and who still set the agenda today. The nature of some of the “characters” in the game were also too visible for comfort. The “one dagger, one dead speaker” rule does not inspire confidence in the ability of a speaker to coordinate cooperation of any sort with the “other side.”
The 2011 experience was before so many ugly political developments in Washington including two impeachments, a sacked capital, and a wide range of House members refusing to accept the 2020 election. Those are important indicators of what is going on in the rooms, and that list goes on from there. The problem in close votes and narrow margins is that the lowest caliber, toxic extremists gather disproportionate power. That tilts the default meter into the red zone.
What about the rating agencies?
The question around how the rating agencies respond to this latest round of fiscal chaos will be interesting. S&P got skewered for its downgrade in 2011, and the reality was that there is very little rigorous actuarial history for assigning ratings and assessing default risk for high income countries.
The agencies can talk about comparative sovereign metrics and debt sustainability and all the metrics they want, but the fact is there is not a magic debt/GDP number to hang your hat on. The ability to finance/refinance tax, print money and keep investors confident is hard to measure. That is why the subjective factors take over.
Goodbye AAA forever?
We recall when the landmark book “This Time Is Different” and everyone was talking about sovereign risk and defaults and systemic debt ratios. Our read of the book told us one thing on debt ratios and default. That is, “We have no idea what leverage will trigger stress” (our words). What triggers defaults is an inability to sell debt to refinance. There Is also the reality that less demand triggers repricing of yields.
There are more complexities for countries that issue debt in other currencies (read dollars) and then face a currency crisis, but the US is a different beast (for now). Imagine if China and the OPEC nations (and South Africa and Brazil) find a Plan B for currency reserves. The fear of sanctions have them talking about that now, and we have Taiwan stress dead ahead. Where do their UST holdings go?
We were pressed some years ago on one of those panel debates way back in the sovereign stress days on “What makes a AAA if there is not a good way to measure it?” Our answer then is similar to what it would be today “The AAA is where everyone puts their money when they panic.” That was still the UST back in 2011 (it sure wasn’t Europe). We are not sure that pattern would hold if the political party hate-fest keeps turning into a default risk scenario and a hostage crisis when Congress and the White House are in different parties.
The subjective factors are much worse today than in 2011 in the minds of more than a few commentators. It seems obvious to us that it’s much worse today. The hard left does not hold the ticket to default. The hard right does. After Trump’s latest comments, and the devout following he has among such deep thinkers in Congress as we see too often in the news (most of them refuse to recognize elections), the empirical evidence is pretty clear that the backdrop for striking deals is worse. Default risk is thus higher, and they just got a green light to default from the head of the party.
Credit rating agency reaction: finessing a political knife fight…
The question is what do the credit rating agencies do when this plays out and then after when the smoke clears. The agencies might conclude that some selective default ratings might be in order and some downgrades of money market funds. We are not plugged into the credit rating agency thinking, but they will be getting pressed by institutional interests to get clear quickly.
Taking the US down to below investment grade ratings would seem highly unlikely on a sovereign default. A massive multi-notch downgrade would be the case for a Brand X country that behaved the same way with the same metrics (but would be smaller in size). We assume that the major credit ratings agencies will figure out some way to finesse this chaos while still taking action that will resonate with a rational debt risk conceptual framework. Among questions to ponder on this topic:
Would the agencies take the US all the way down to the singe A tier or just take the defaulted maturities down with an SD (selective default)? Sovereign ratings are not our discipline, but that would be a political escape route short term for the agencies.
On a semi-serious note (not really), the criteria could be “You are AAA unless there is a President who is a Democrat while the House is held by the GOP. In those years you are a CCC.” Since Presidential popular votes have been carried by a Democrat for 7 of the past 8 elections (but lost two of those 7 elections while carrying the popular vote), that could make for some volatility in ratings given the inability of the Democrats to win the House in a majority of the elections along the way.
MICRO
The Macro worries we discuss above are not doing wonders for the price of oil that drives the benchmark major Canadian names we watch. We are getting ready to get back out in print on some of the Canadian oil sands names we picked up after the oil crisis in prior lives. Suncor reported last week to wrap the oil sands sector reporting season. The massive free cash flow has turned some of these companies into major repurchasers of stock at the same time they are hiking dividends and playing the role of income stocks (Suncor dividend yield ~5.2%, Canadian Natural ~4.4%).
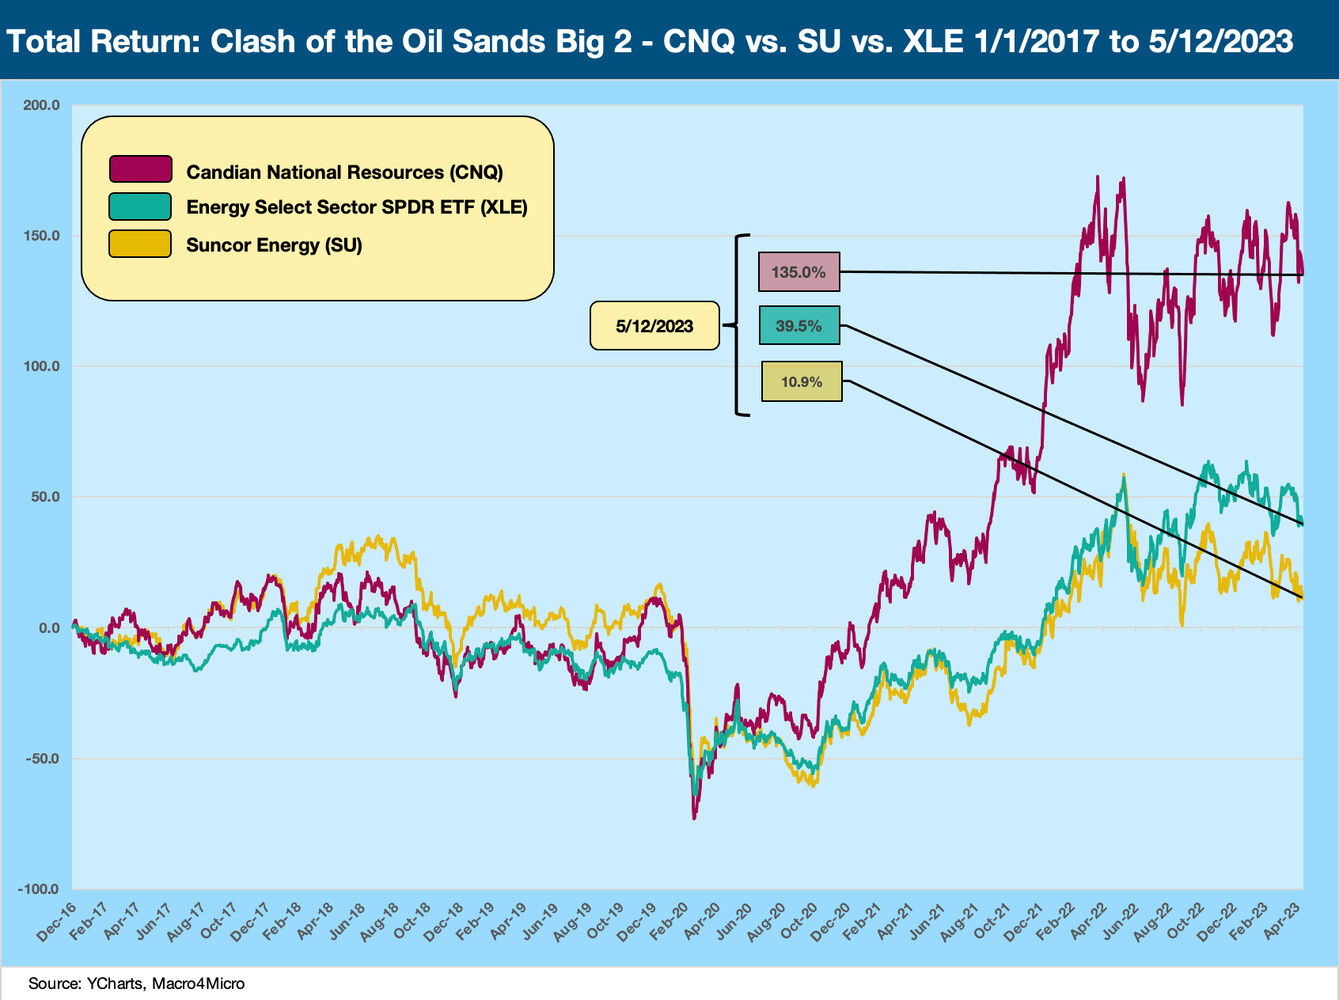
Below we look at some of the relative returns across the sector and notably in the clash of the Big 2, Canadian Natural and Suncor. CNQ had a rougher ride across the wild swings of the oil crash of 2015-2016 but has since that time dramatically expanded via M&A and new projects coming online.
In our view, CNQ is a cash machine and is more like a smaller OPEC nation (with higher production than more than a few). Suncor has had to wrestle with shareholder activists and management turmoil. The diversified asset base and strong downstream position makes it an interesting compare-and-contrast with CNQ. Both make for very solid core BBB bond holdings, but CNQ is the more interesting equity play and has multiple means of growth by acquisition or reinvestment.
The above chart plots the ride for Suncor vs. Canadian Natural from the beginning of 2017 as it pulled away from Suncor on strong execution, a favorable position as the largest upstream operator in oil sands, a favorable performance in integration of major acquisitions across the past energy cycle, and healthy free cash flow and a growing focus on shareholder returns.
Suncor had been the industry leader and #1 in market cap, but CNQ pushed past them as the “Canadianization” of the oil sands sector saw waves of asset sales (notably by US and European sellers) offer opportunities to be exploited by well positioned buyers such as CNQ, who executed on a mega deal to buy a 70% stake in the Athabasca Oil Sands Project from Shell and Marathon back in 2017.
The opportunities opened up to Cenovus as well, and CVE was also aggressive in their acquisition plans (notably with their major ConocoPhillips oil sands asset purchase in 2017). It took a while for the market to buy into CVE’s game plan. In contrast, CNQ’s track record and scale was more easily embraced by institutional investors.
The above chart posts the relative returns of the Big 4 of oil sands (CNQ, SU, IMO, and CVE) along with MEG Energy as a major player (but a distant #5) as well as Baytex and Athabasca to round out the group even though that last two are not as useful as “comps.”
Baytex is moving in the direction of US expansion (Ranger Oil acquisition) and Athabasca is a materially smaller player. We use the US-centric E&P ETF and larger more diversified Energy ETF (XLE) as measuring sticks. Only CNQ among the Canadian names beat the ETFs over the trailing 3-month period, but the sector overall was getting beaten up along with Energy equities broadly.
The good news for holders of the BBB tier bonds of Suncor, Canadian Natural, and Cenovus are that these companies boast very strong free cash flow and operating cost metrics that have stood the tests of some material volatility this past decade from the 2015-early 2016 crash through the de facto market collapse during COVID. The Canadian oil sands players had an anomalous plunge in prices in 4Q18. That is a separate story and notably how the Alberta regulators executed in quota systems.
We found this sector and these major oil sands companies very interesting and distinctive in their analytical framework. We will be out with more company-specific research on them in the immediate future, starting with the Big Two: Suncor and Canadian Natural. We also covered CVE and MEG in the past and will be getting to those as well.


